The best way of getting the optimal performance out of your digital infrastructures – both software and hardware – is to constantly monitor it. In this Grafana review and alternatives list, we will have a look at such tools and how you can make sure you get the best out of your IT investment.
What is Grafana?
Grafana is an open-source web metrics visualization and IT infrastructure monitoring tool that allows you to see all of your digital resources’ performance in one unified dashboard. It pulls the metrics from any source, like Graphite and Prometheus, and displays the data in an informational and consumable format.
It is mainly a graphical editor InfluxDB dashboard and open-source Graphite dashboard composer that allows for the creation of innovative methods of imaging time-series metrics. This composer achieves this by using graphs.
In other words, it converts metrics into graphs in real-time. But it does it very well and the results are both aesthetically pleasing while also being very insightful.
The dashboards enable you to annotate and understand the data directly. It presents the data in formats that allow for easy understanding via charts, tables, histograms, heat maps, world maps, and more.

Grafana offers various graphs formats to choose from
Grafana, originally released in 2014, is a tool that can be used with a variety of data sources that is popular among developers and used by some of the largest corporations like PayPal and JP Morgan mainly due to its flexibility and high scalability.
But, it is also the tool of choice for developing startups because it is an easy tool to get started on monitoring their assets’ performance. They implement it to monitor their infrastructure and perform log analytics as soon as they start implementing the automation of their data collection, viewing, and management.
Perhaps, the most attractive feature most of these users find is the fact that you only need to drag and drop widgets into dashboards or that you can create extensive integrations using low-code configurations.
Advantages of Grafana
There are many advantages to using Grafana which include:
- It is an easy-to-use, hassle-free administration tool.
- Hosted Grafana is built for scale – this makes it a tool that will be at home in any architecture or infrastructure design, be it big or small.
- Create, edit, save, query, and search dashboards that give a full insight into metrics that are sourced from any part of your stack or infrastructure. If there are metrics to be exported, Grafana will graph them.
- Easily change column spans and row heights, and drag-and-drop panels to rearrange them any way you want; it is a flexible tool that will make any dashboard designer happy to work with.
- The tool’s alerting features allow for integration with third-party communication solutions like email, Slack, PagerDuty, and even customized alert hooks where users will be in the know around the clock, wherever they may be.
Perhaps the one thing that makes this tool loveable is that dashboards can be downloaded and shared to be used in other installations. There is a dashboard gallery where users can download pre-created solutions and adopt them into their networks. And then there is the fact that there are hundreds of plugins that further extend Grafana and make for extra customizable analysis.
What makes Grafana stand out?
There are even more features that make Grafana stand out from its competitors. These include:
- Dashboard templates One of the most impressive features that contribute to making Grafana a leader, is the array of templates available for developing custom dashboards without having to start from scratch. Users can be up and monitoring in minutes.
- Automatic setup For administrators in a hurry, there is the option of automating the entire setup process with the help of scripts. Grafana’s provisioning feature lets you scale with ease and avoid repeating the creation of dashboards as you go along.
- Intelligence The tool’s machine learning (ML) studies data patterns and predicts time series. This helps with forecasts which can, in turn, be used to set up milestones, outliers, suspicious activities, alerts, and capacity requirements. The ML supports various data sources like Postgres, BigQuery, and Snowflake.
- Data correlation Users can mark their graphs and correlate data to spot anomalies and observe them using more than one metric. The tool’s feature makes it easy to manually create the annotations.
- Public display options Grafana is the ideal choice for when data needs to be displayed in public on monitors or TV. It can be configured to cycle through dashboards in a “rolling coverage” of metrics. It has a kiosk mode where only the desired UI components are displayed in read-only formats that accept logins and perform tasks like opening playlists.
- Extended functionalities Custom plugins help create more visualization, tools, and functions that cover any scope as long as there are metrics to be gauged. It can be made to do anything from adding users to displaying insights on maps. It allows for the mapping of users to companies so various team members can chat amongst themselves.
- Collaboration Multiple users can be granted access to dashboards with various permissions allocated to them from the folder level up.
- Security Grafana works well with several authentication methods that include LDAP, OA, and more authentication styles. Even when a company uses its unique authentication model the tool will allow for collaboration between in-house teams as well as authenticated access to dashboards.
- Versatility Whether users want to store their data in SQL databases, scrape Prometheus HTTP endpoints, or access Google Analytics data, Grafana can be implemented to work at all levels of their network stacks and gauge metrics with ease.

Grafana can even monitor Linux stats
As you can probably see, Grafana is the tool for metrics monitoring and reporting. Wherever there is a metric, this tool can convert it into timeline-plotted graphical displays and do it with beautiful imagery. Just have a look at their dashboard gallery.
Grafana price
Grafana offers two deployment versions: Cloud-hosted and On-premise Self-managed. The price details are:
- The “free forever access” version is available for up to three active users, 10k active metrics, 50GB logs, and 50GB traces. The offer comes with a 14-day trial Pro version for one user with complete access.
- The Advanced and Enterprise versions of Grafana come with even more features and resources, but need you to contact them for detailed, custom pricing offers.
The detailed price table looks like this:

Grafana pricing table
More importantly, Grafana has a sandbox you can play around with to help you make a decision. The cloud version of Grafana can be tested for FREE. Alternatively, you can download the standalone version, also for FREE, and use it on-premises.
Features to look for when looking for alternatives to Grafana
Some features you need to look into when looking for alternatives to Grafana include:
- Ease-of-use The tool should be easy to install, configure, and manage.
- Scope It should be able to import and gauge a wide range of metrics and map data to a wider range of types and quality visualization formats.
- Interactivity Dashboards and reports should display data in easily consumable formats as well as allow for in-depth analysis by drilling down into basic data units.
- Versatility It should be able to run on any device including laptops, tablets, and servers including running in and importing data from the
- Tech know-how The tool should have a low learning curve, low training costs, and wider access to education resources.
- Low overhead The system and software requirements for installation should be reasonable if not negligible.
- Security The data, dashboards, and users should be secure at all times with no compromise caused by the installation and use of the tool.
- Price The overall price of the solution should be a worthy one with a positive ROI.
Since Grafana is one of the top leaders in the data visualization market, probably the only deciding factor that will make for a better alternative would be finding a solution that meets all the above criteria while also addressing any custom metric and dashboard requirements.
Grafana Alternatives
Our methodology for selecting a Grafana alternative tool
We’ve broken down our analysis for you based on these key criteria:
- The tool’s ability to offer diverse and quality data visualization.
- The ease of installation, configuration, and ongoing management.
- The range of metrics it can import and analyze.
- Accessibility on various devices and compatibility with different environments.
- The level of security it offers for data and user information.
Let us now have a look at some alternatives to Grafana. They are:
1. ManageEngine Applications Manager (FREE TRIAL)

ManageEngine Applications Manager is an all-in-one monitoring system that comes with a wide range of features, making it easier for IT professionals and businesses to track applications, services, and infrastructure. The tool is a complete package in itself, offering access to monitor all digital resources and applications from a single console.
Key Features
- Versatile monitoring tool: The tool helps monitor applications across all on-premise, hybrid, and multi-cloud environments.
- Detailed Diagnostics: The tool offers deep insights into how digital resources perform and displays them in an informational format.
- Pre-built reports: Users can access 500+ reports to display trends and make informed decisions for capacity planning. Also, supports generating ML-driven forecast reports.
Why do we recommend it?
ManageEngine Applications Manager turns out to be a great option for businesses due to its comprehensive monitoring capabilities and access to AI-assisted smart alert systems. The custom and interactive dashboard also helps ease the management and display of complex data to team members or stakeholders.
Who is it recommended for?
Enterprises that demand real-time monitoring of their infrastructure across cloud, on-premise, and IoT environments must opt for this tool.
Pros:
- Offers an interactive dashboard for users
- Detailed reporting system with access to 500+ pre-built templates.
- Offers support to multiple infrastructures.
- Supports 150+ technologies
Cons:
- Beginners might find it time-consuming to navigate through multiple features and functionalities.
If the need to monitor applications is high, you can choose from the two paid versions available. Users can download the 30-day free trial.
EDITOR'S CHOICE
ManageEngine Applications Manager is a top choice by our editors because it comes with multiple monitoring features. Also, if you are looking for a Grafana alternative, the tool comes with an interactive dashboard that allows users to detect anomalies in real-time, track alerts, and respond to them faster. The tool further allows professionals to view the performance of all digital resources from a single console. Thus, it reduces the need to switch between multiple platforms. Ease of use, scalability, real-time detailed reporting, faster deployment, and deep analytical capabilities are a few features that make it a good option for professionals.
Download: Get a 30-day FREE Trial
Official Site: https://www.manageengine.com/products/applications_manager/
OS: Windows, Linux
2. Dynatrace
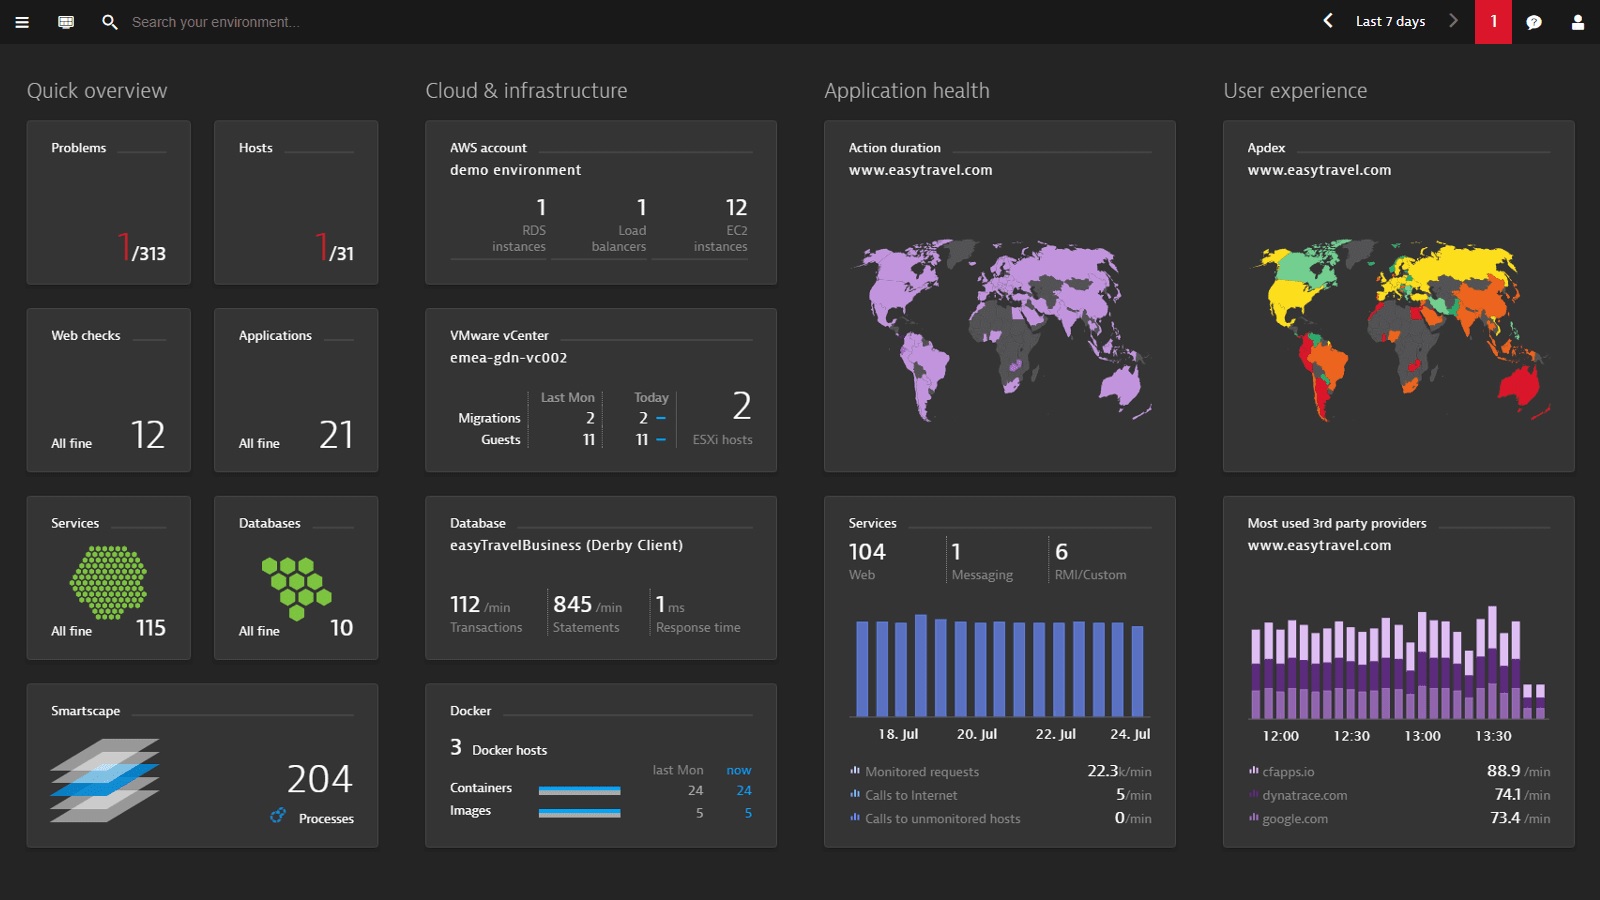
Dynatrace is an automatic and intelligent observability tool that works across cloud and hybrid environments. It performs continuous auto-discovery of assets, services, containers, devices, logs, and events.
Key Features:
- Interactive Kubernetes dashboard: It offers a Kubernetes cluster overview to provide users with immediately actionable insight into cluster health to make it easy to prioritize efforts.
- Easy customization: Users can drag-and-drop panels for custom insights into the key data they choose.
- In-depth process analysis: Dashboards give out meaningful analysis by digging deeper to get network metrics at the process level including detailed metrics on process-to-process communications.
Why do we recommend it?
Dynatrace stands out for its intelligent, automated observability across cloud and hybrid environments, offering insightful Kubernetes dashboards and in-depth process analysis.
Who is it recommended for?
It’s particularly suited for teams managing Kubernetes clusters and those needing customizable, in-depth insights into their IT infrastructure.
Pros:
- Advanced Kubernetes monitoring
- Highly customizable interface
- In-depth analytical capabilities
Cons:
- The learning curve for new users
Try Dynatrace for FREE.
3. Nagios XI
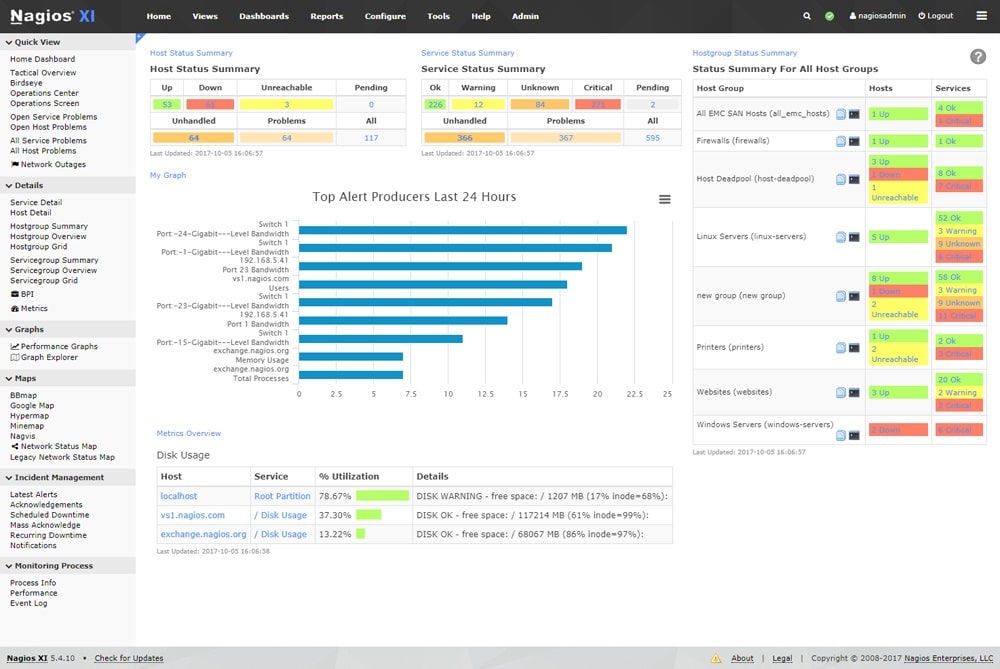
Nagios XI is another popular infrastructure monitoring tool. It offers tools for monitoring applications and application states on any operating system, including Windows, Linux, UNIX applications, and cloud platforms.
Key Features:
- In-depth analysis of assets: Is used to monitor applications, services, and processes. It also helps track the performance of network protocols, systems metrics, and network infrastructure. With the addition of hundreds of third-party add-ons, it can virtually cover all in-house applications, services, and systems.
- Powerful and customizable dashboards: Users have access to powerful monitoring information and third-party data. They get quick access to the information they find most useful and displayed in GUIs that are customizable layouts, designs, and preferences on a per-user basis.
- Advanced user management: The tool allows for easy access control; admins can manage user accounts easily by, for example, creating new accounts with a few clicks to automatically send login credentials to the users via email.
Why do we recommend it?
Nagios XI offers detailed monitoring of applications, services, and processes, combined with powerful, user-specific dashboard customization.
Who is it recommended for?
Ideal for IT administrators needing deep insights into network protocols, system metrics, and infrastructure, with a focus on customization and user management.
Pros:
- In-depth monitoring capabilities
- Highly customizable dashboards
- Efficient user account management
Cons:
- May require technical expertise
Try Nagios XI for FREE.
4. Zabbix

Zabbix is a complete and open-source infrastructure monitoring solution that covers assets such as networks, servers, virtual machines, and cloud services and displays their metrics for analysis.
Key Features:
- Regular updates: This tool has managed to remain a cutting-edge tool because it is updated regularly. It has new features generally released every six months while new versions are released in 5 years.
- Scalable distributed monitoring: It can be used to monitor anything from smart homes to multi-tenant enterprise environments and can be deployed on any infrastructure, straight from a central Web UI that comes with native encryption support between all of the components.
- High integration: Users don’t have to worry about compatibility with the systems already in place; they have the option to choose from a wide array of official ready-to-use templates to integrate with alerting, ticketing, IoT, and ITSM systems.
Why do we recommend it?
Zabbix’s regular updates and scalable monitoring capabilities make it a versatile choice for diverse environments, with excellent integration options.
Who is it recommended for?
Suitable for those needing a scalable and regularly updated monitoring solution, particularly in complex, multi-tenant environments.
Pros:
- Continuously updated
- Scalable for various environments
- Wide integration options
Cons:
- The interface may be complex
Download Zabbix for FREE.
5. Prometheus

Prometheus is also an open source, community-driven systems monitoring and alerting toolkit where all its components are available under the Apache 2 License on GitHub. It fundamentally collects and stores metrics as time series data – metrics information is stored with its timestamp at which it was recorded – alongside other optional key-value pairs called labels.
Key Features:
- Versatile alerts configuration: The tool can be configured for alerts to specific conditions that, when triggered, are forwarded to the Alertmanager service which forwards them to email, Slack, or notification services like PagerDuty.
- Data feeds to other visualization tools: Prometheus is not a dashboarding solution, per se, although it can be used to graph specific queries. For better utilization, it is hooked up with solutions like Grafana to generate dashboards.
- Lite and efficient: It has a simple yet powerful data model and a query language that lets you analyze how your applications and infrastructure are performing without affecting your endpoint and UX performances.
Why do we recommend it?
Prometheus excels in providing versatile alert configurations and integrates well with other visualization tools, offering efficient performance monitoring.
Who is it recommended for?
Best for teams looking for a lightweight monitoring solution that integrates seamlessly with other visualization platforms like Grafana.
Pros:
- Flexible alert settings
- Complements existing tools
- Efficient and lightweight
Cons:
- Not a standalone dashboard solution
Try Prometheus for FREE.
Grafana review and alternatives conclusion
There is no doubt that Grafana is a leader in the IT infrastructure monitoring realm. If there is anything to be said against this tool it may be the fact that it might need deeper IT budgets. It could also be a drain on network and processing resources if there isn’t enough provision made accessible to it – which could add to its costs. But, these become negligible when it comes to larger clients that can afford them.
With that being said, the best alternative would be ManageEngine Applications Manager which offers more complete coverage and has dashboards that can be of help at any level of a network infrastructure.
We would like to hear your thoughts on the Grafana review and alternatives list. Leave us a comment below.