In this Event Log Forwarding Guide, we will have a look at what it means, how to do it manually using native commands and features, as well as four tools that can be used to automate the whole process.
Here is our list of the best event log forwarding tools:
- Site24x7 EDITOR’S CHOICE Cloud-based solutions for Windows and Linux event logs, identifies server faults, and tracks security events, instant alerts. Start a 30-day free trial.
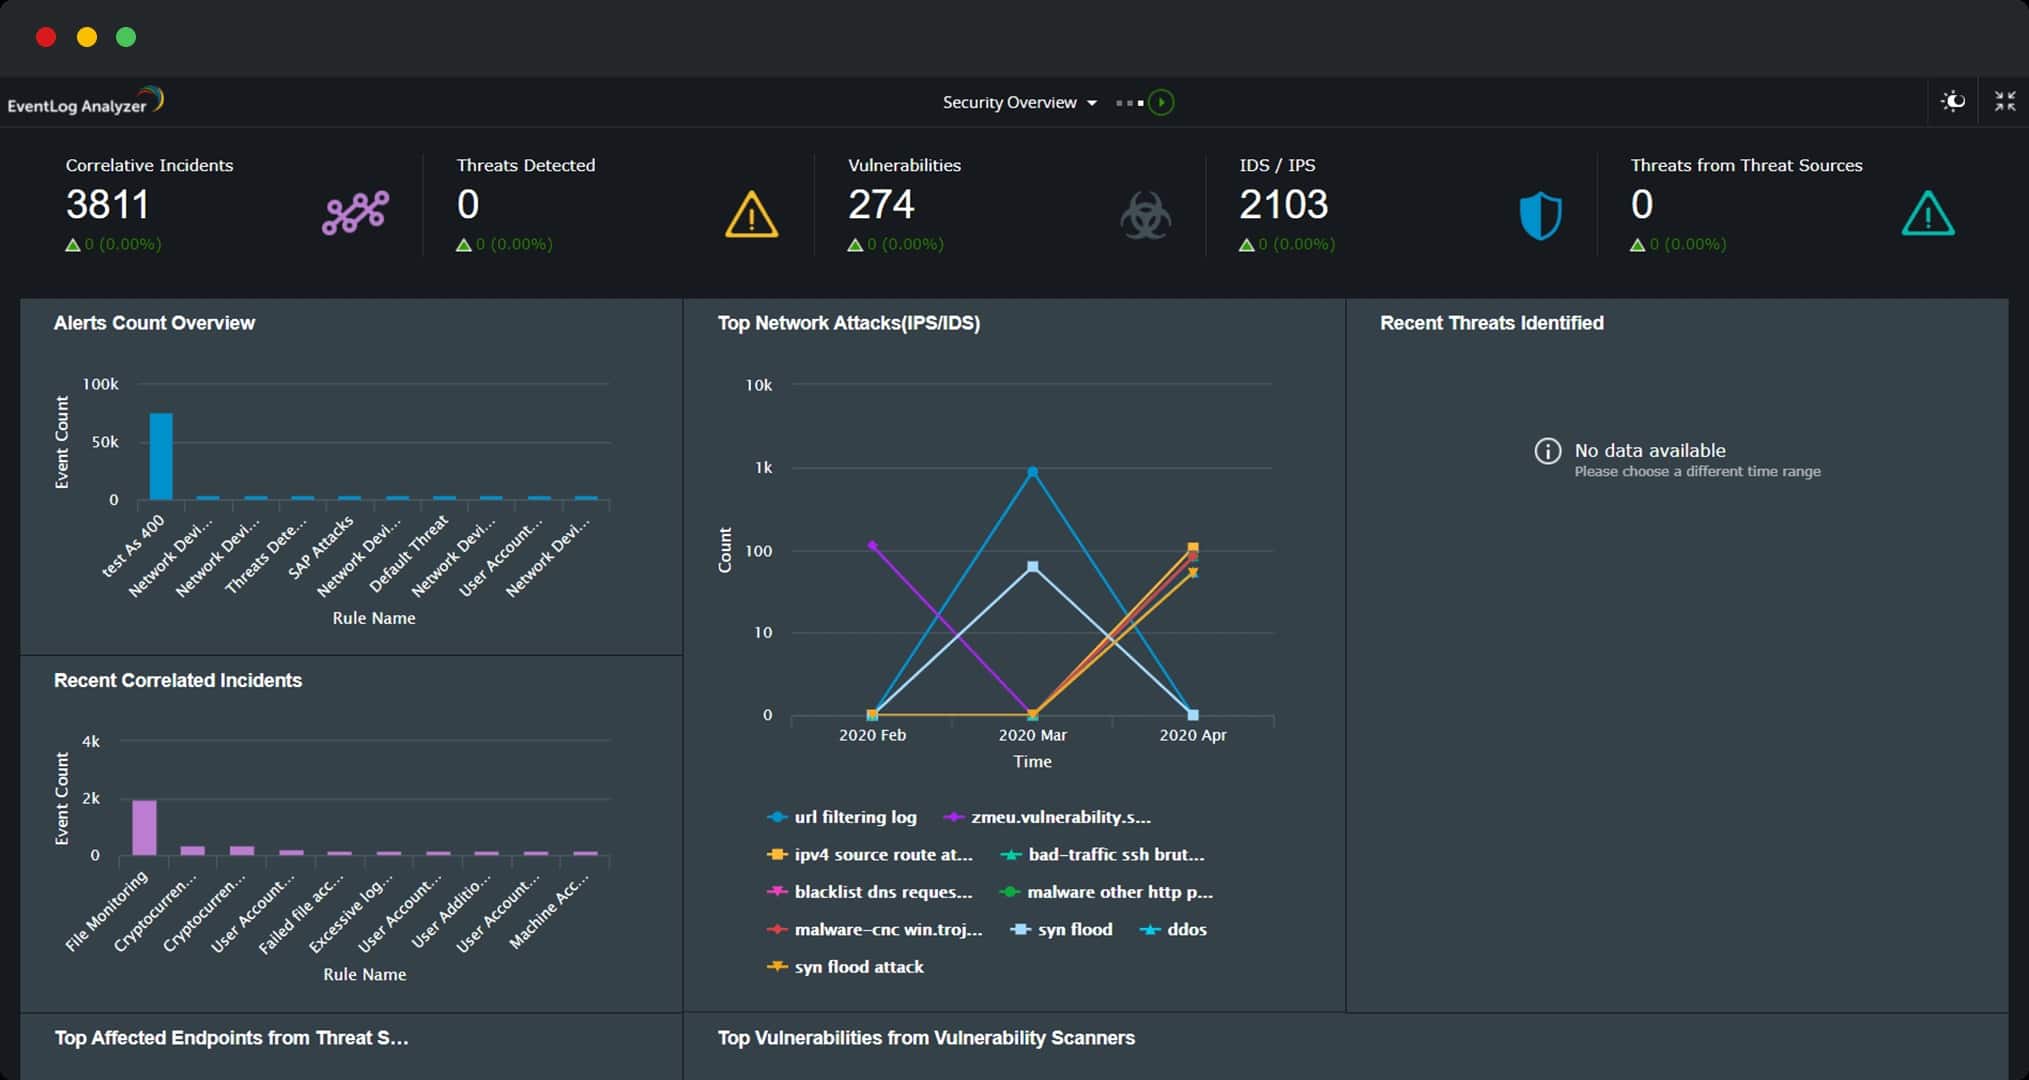
- ManageEngine EventLog Analyzer (FREE TRIAL) Collects, parses, and analyzes logs from various sources, customizable reporting, interactive dashboards. Start a 30-day free trial.
- Kiwi Syslog Server – Centralized event management, real-time alerts, automatic responses, browser access.
- LogDNA – Ingests and processes log data in real-time, powerful exclusion rules, versatile data input options, custom parsing templates.
What is an event?
Let us start by defining what an event is.
Most operating systems – both desktop and server versions – keep records of errors that occur as they are running. These errors are considered to be ‘events’ that are registered to help administrators figure out what caused them.
Events are errors that occur on a computer or server and can be caused either by a user or a running process. Of course, the user might be an innocent end-user or a malicious hacker. Meanwhile, the process could be run by a misconfigured application or a rogue one that has been planted by a hacker looking to breach the server.
The information that is gathered by way of the events helps administrators figure out exactly what is going on.
What is an event log?
All the events are recorded in a log – an archive that is used to store, group, and present them easily. They are the logs that administrators look into when troubleshooting, tracking root causes or resolving issues.
An event log presents the data – that is gathered from various sources within the server it is hosted on – in a way that is easy to understand. In Windows, the Event Viewer is used to present the events in the logs. They are grouped depending on characteristics like severity, source, and time of occurrence.
An important point, that will be important as we talk about Event Log Forwarding, is that the administrator needs to connect to each server individually to work with its logs.
How does an event log help us?
The main reason we need event logs is to have a way of monitoring the health of our computers and servers. These logs give us insight into what has happened (in case of a crash), what is happening (to see what is causing the server to run slow), and even predict future performance issues (tracking disk space warnings that could cause issues soon).
It also gives us insights into applications that aren’t working well or if there is an attempt being made to breach the network.
An example could be if any attempts are being made to gain unauthorized access to the network or the assets that are on it. A good indication of this would be the number of failed login attempts that are being made compared to the time that has passed between each attempt. Too many failed logins in a short amount of time need to be investigated as an attempt being made via a brute force attack.
A look at the event logging in major operating systems
Most – if not all – operating systems have event-logging capabilities. While some may have native log management and viewing tools, others rely on third-party solutions to allow users to make sense of the data.
Now, we will have a look at the native ways we can access and leverage log data of two major operating systems: Windows and Linux.
Windows
Windows has Event Viewer – a component of the operating system that is used to view event logs on a local or remote machine.
To start the Event Viewer:
- Click on Start.
- Type “Event Viewer” into the search box.
- Click on the resulting application shown at the top of the results.

That’s it. This opens the Event Viewer application and you’re ready to start investigating.

The next step is to scroll down the errors list and see what kind of events have been logged.

Administrators can now investigate an event by drilling down into the details – all they need do is double-click on it and find information on:
- Level The seriousness of the event, which we will see in the next section.
- Date and time The date and time the event was logged.
- User The username of the user logged onto the machine at the time of the event.
- Computer The name of the computer the event occurred on.
- Event ID A Windows identification number that specifies the event type.
- Source The software or hardware that triggered the event.
- Type The type of event, including information, warning, error, security success audit, or security failure audit.
What levels of Windows events do we have?

To answer this question we will need to look at events in a Windows operating system where there are six types or “Levels” of events:
- Critical These messages are an indication of a severe problem. This is the most serious type of problem that needs to be addressed immediately. It is usually triggered by something that is broken somewhere, and the component that triggered the event has probably crashed. An example would be, Event ID 41 – Kernel-Power which indicates that a machine rebooted without a clean shutdown.
- Errors These events indicate a significant problem such as loss of data or loss of functionality. A failure of a service to load during startup would be an example that could trigger this event.
- Warnings Although, not necessarily significant, these events may indicate a possible future problem. A good example here would be when disk space is low. Also, if an application recovered from an event without loss of functionality or data, it would trigger a Warning event.
- Information These are events that describe the successful operation of an application, driver, or service. When a driver loads successfully, for example, it may be logged as an Information event.
- Success Audit These events record audited security access attempts that are successful. For example, users’ successful attempts to log on to the system are logged as Success Audit events.
- Failure Audit These events record audited security access attempts that have failed. For example, if users tried to access a network and failed, their attempts are logged as Failure Audit events.
Depending on the severity level of the logged event, the administrator can move on to taking the appropriate action.
Microsoft has a list of events that need to be monitored. Some examples include:
- Event ID 4649 A replay attack was detected. This event can be a sign of a Kerberos replay attack or simply, among other things, a network device configuration or routing problem.
- Event ID 104 Indicates that an event log was cleared; this is something a hacker would do to hide their tracks.
- Event ID 4663 Generated when a high number of files are being deleted, it could be that an administrator is clearing data or an attacker is erasing a hard disk.
- Event ID 530 A logon attempt failed, despite the account and password combination is correct, because it was made outside the allowed
- Event ID 531 A failed logon attempt was made using a disabled account.
- Event ID 539 A failed logon attempt was made using an account that had been locked out. If there are a large number of these events logged, it could mean that a service account password is configured incorrectly or a program is trying to connect with a password that doesn’t match the password on the server. It could also mean that there is a brute force attack in progress.
- Event ID 644 An account was locked following several unsuccessful login attempts within a specified time limit. This would lead to triggering Event ID 59 above if the application, service, or user continued to try and log in using the locked account.
- EVENT ID 4724 A password reset has occurred. This could mean that a conscientious administrator is simply resetting passwords as a security measure or that a disgruntled administrator just locked everyone out.
- EVENT ID 4704 and 4717 Changes were made to user rights assignments; this is something a hacker would do as they attempted to elevate their account permissions to access secure resources.
- EVENT ID 4719 and 4739 Show that someone has tampered with the Audit and Account policies. Depending on the user, it could be harmless or a prelude to an internal hack.
- EVENT ID 1102 This event indicates that the security log has been cleared. Here too, it could be a sign of good housekeeping or a good hacker that is trying to cover their tracks.
Linux
Linux is the other popular operating system that we will be looking at. Its log files are stored in plain text and can be found in the /var/log directory and subdirectory. There are Linux logs for everything including the system, kernel, package managers, boot processes, Apache, MySQL, and more.
After navigating to the log directory – by typing cd /var/log from the root directory – we can access the files by following these steps:
- The command to display the content of the directory is ls – it will list the files.
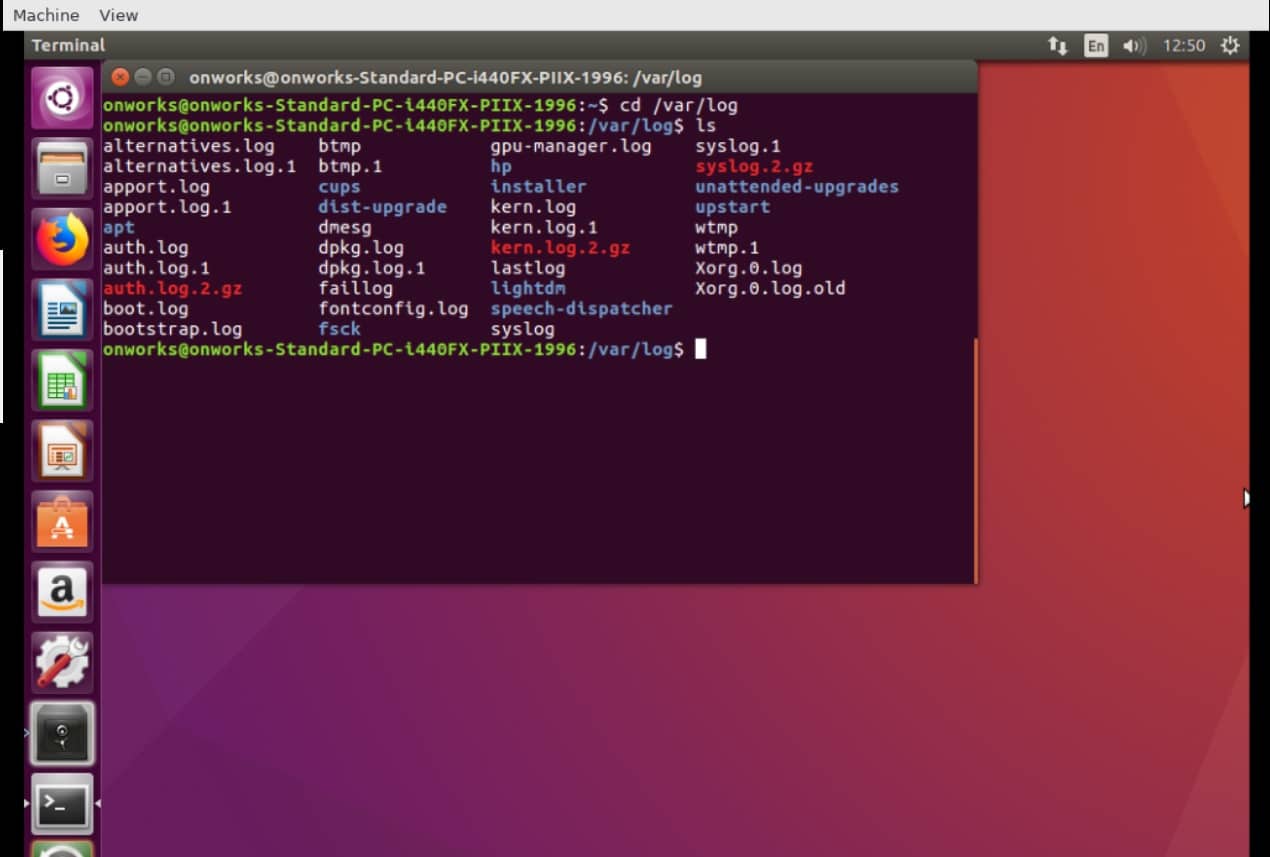
One of the most important logs to view is the syslog because it logs everything except auth-related messages.
- Issue the command sudo cat syslog – while still in the /var/log directory – to view everything logged in syslog.
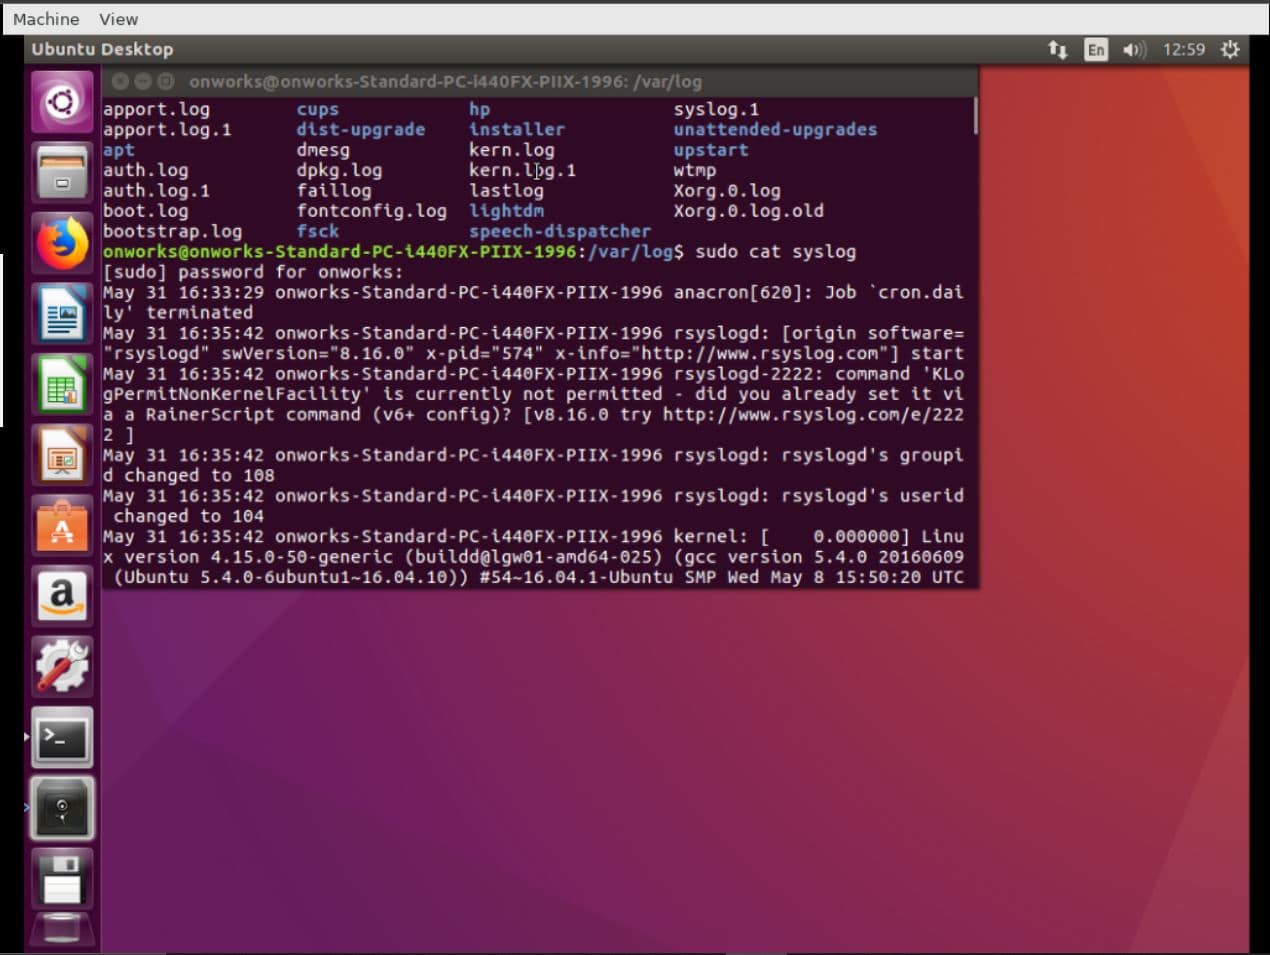
- To get to the last entry – which is the latest one – type Shift+G. This will skip to the “END”.
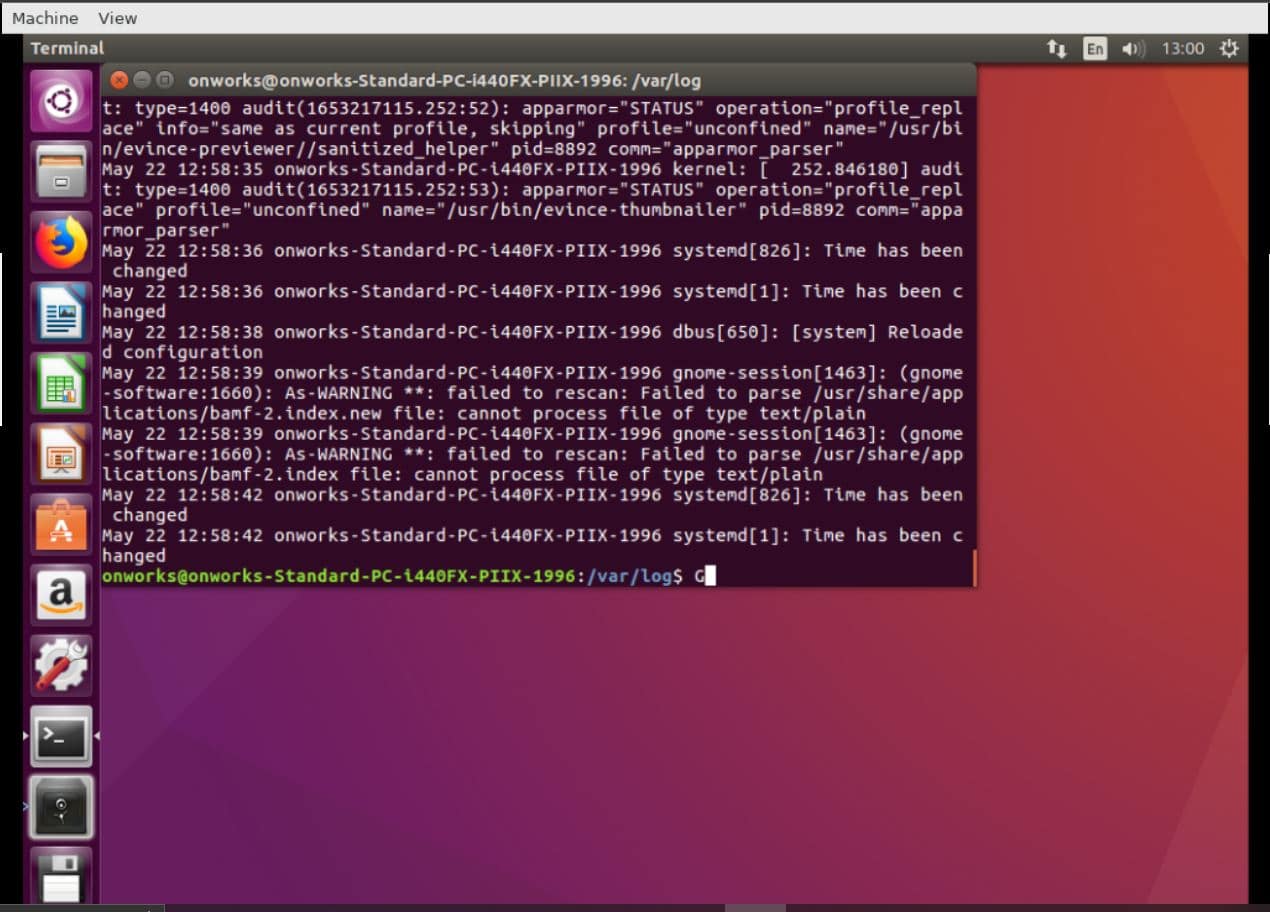
- To stay on top of entries, as they occur, you can use the “tail” command. For example, to keep track of events in the syslog file as they come in, the command would be tail /var/log/syslog (to list the last 10 events) or tail –f /var/log/syslog to “follow” the events as they are being appended to the bottom of the list. More commands and their full syntaxes can be found here.
- The command to exit the log is Ctrl+X.
Next, we will have a look at some logs that need to be monitored. These include:
- /var/log/messages Logs generic system activities and is used to store informational and non-critical system messages.
- /var/log/auth.log Llogs authentication-related events in Debian and Ubuntu servers.
- /var/log/boot.log Logs boot-up messages generated by /etc/init.d/bootmisc.sh – the system initialization script – as a device goes through the startup process.
- /var/log/dmesg Logs information related to hardware devices and drivers.
- /var/log/kern.log Logs critical kernel information.
- /var/log/faillog Logs important information about failed login attempts.
- /var/log/cron Logs information on cron jobs.
- /var/log/yum.log Logs information about new packages that have been installed using the “yum” command.
- /var/log/maillog or /var/log/mail.log Logs records concerning mail servers.
- var/log/httpd/ This is the directory that holds logs recorded by an Apache server and that are stored in two files: error_log and access_log.
- /var/log/mysqld.log or /var/log/mysql.log Logs MySQL records regarding debug, failure, and success messages related to the [mysqld] and [mysqld_safe]
What is event log forwarding?
Ok; now that we have seen what an event and event log is, it is time to talk about Event Log Forwarding.
Event log forwarding is the process of consolidating event logs from distributed servers on a network into one central repository. The purpose of forwarding event logs is to have to deal with one all-inclusive archive instead of having to connect to, and monitor, servers individually.
Most major operating systems, including Windows and Linux, have log forwarding capabilities.
Windows, by default, allows event logs to be forwarded from servers to a central server. The forwarded events are stored in the Forwarded Events folder that is located under Windows Logs.
Meanwhile, Linux also offers rsyslog – a software solution that is included by default in the operating system – to send logs remotely. In case it isn’t installed, users can easily download it.
Why do we need to forward logs?
Some of the main reasons to opt for Event Log Forwarding include:
- Centralized logging and auditing Administrators can create a warehouse of data that gives them a complete picture of the current status of all their devices.
- One query for all servers Administrators can run queries against a single data repository, instead of having to collect the same data on each server.
- As part of a disaster recovery plan Hackers tend to tamper with the events logs of the servers they attack in a bid to cover their tracks. A centralized repository will serve as a backup to help with uncovering what they have done and then restore breached systems.
- Saving disk space Data storage on mission-critical servers can be optimized by moving event logs to a dedicated repository.
- Restricted access Administrators can grant access to the central repository instead of allowing other stakeholders (auditors, security engineers, etc.) without allowing them to log into the actual production servers.
The Best Event Log Forwarding Tools
Next, let us have a brief look at the four best tools for event log forwarding for both Windows and Linux servers.
1. Site24x7 (FREE TRIAL)
Site24x7 offers two solutions for Windows and Linux events log forwarding: Windows Event Log Monitoring and Linux Syslog Monitoring from the Cloud (SaaS), respectively.
Key Features:
- Windows and Linux monitoring
- Instant alerts
- Event log analysis
- Keyword search and filtering
Why do we recommend it?
Site24x7 is recommended for its cloud-based approach to event log monitoring, offering flexibility and ease of use, especially for tracking security-related events.
Administrators can analyze forwarded event logs triggered by applications, security incidents, setups, and system faults or failures. They can also identify faults in server memory and track security events like failed logins, cleared audit logs, and more.
It can send out instant alerts about errors associated with event facilities like clock daemon, kernel, FTP, and performance degradation before end-users are affected.
Who is it recommended for?
Ideal for administrators who prefer a SaaS solution for monitoring both Windows and Linux environments, especially for security incident tracking.
Pros:
- Efficient tracking of server faults and security incidents.
- Real-time alerts for proactive management.
- User-friendly for keyword searches and event log filtering.
Cons:
- May lack the depth needed for complex enterprise environments.
Administrators can use this tool to analyze event logs and search for specific keywords, filter them by ID, and list them by occurrences. Try Site24x7 FREE for 30 days.
2. ManageEngine EventLog Analyzer (FREE TRIAL)
ManageEngine EventLog Analyzer collects logs from multiple log sources – including Windows, Linux, and UNIX servers. But apart from servers it also accepts logs from applications, databases, firewalls, routers, switches, IDS/IPS, and other cloud infrastructures.
Key Features:
- Multi-source log collection
- Customizable reports
- Interactive dashboards
- Log correlation
Why do we recommend it?
ManageEngine EventLog Analyzer stands out for its ability to collect and analyze logs from a wide range of sources, offering deep insights into network activities.
Administrators can collect, filter, parse, analyze, correlate, search, and archive event logs sent from all mission-critical devices on their network.
They can then create and extract custom reports – with their new fields of their own if need be – to make their log data more informative. Interactive dashboards display intuitive graphs while reports can be used to monitor for suspicious activities, depending on requirements.
Who is it recommended for?
Best suited for IT professionals in larger organizations needing to correlate logs from various devices like servers, firewalls, and routers for enhanced security monitoring.
Pros:
- Advanced reporting and dashboard features.
- Effective for monitoring suspicious activities.
- Comprehensive log parsing and correlation capabilities.
Cons:
- Complexity may be overwhelming for small-scale networks.
Get started by registering for access to a 30-day free trial.
3. Kiwi Syslog Server

SolarWinds Kiwi Syslog Server is a tool for managing syslog messages and SNMP traps from network devices as well as operating systems like Windows, Linux, and UNIX.
Key Features:
- Centralized event management
- Real-time alerts
- Automatic responses
- Browser-based access
Why do we recommend it?
SolarWinds Kiwi Syslog Server is recommended for its comprehensive management of syslog messages and SNMP traps, coupled with real-time alerts that ensure prompt action on critical events.
Administrators can centrally manage forwarded events from one console. They can also receive real-time alerts of critical events indicating problems with servers or network devices. They can access their syslog data from anywhere using a browser. The tool allows for automatic responses to syslog messages as well as easily inspecting log messages for faster troubleshooting.
Who is it recommended for?
This tool is ideal for network administrators managing diverse network devices and operating systems, who need centralized and responsive event log management.
Pros:
- Supports multiple OS like Windows, Linux, UNIX.
- Centrally manages and alerts on critical events.
- Enables remote access to syslog data.
- Facilitates automatic responses for efficient troubleshooting.
Cons:
- May be complex for small-scale operations or beginners.
Download a 14-day free trial.
4. LogDNA
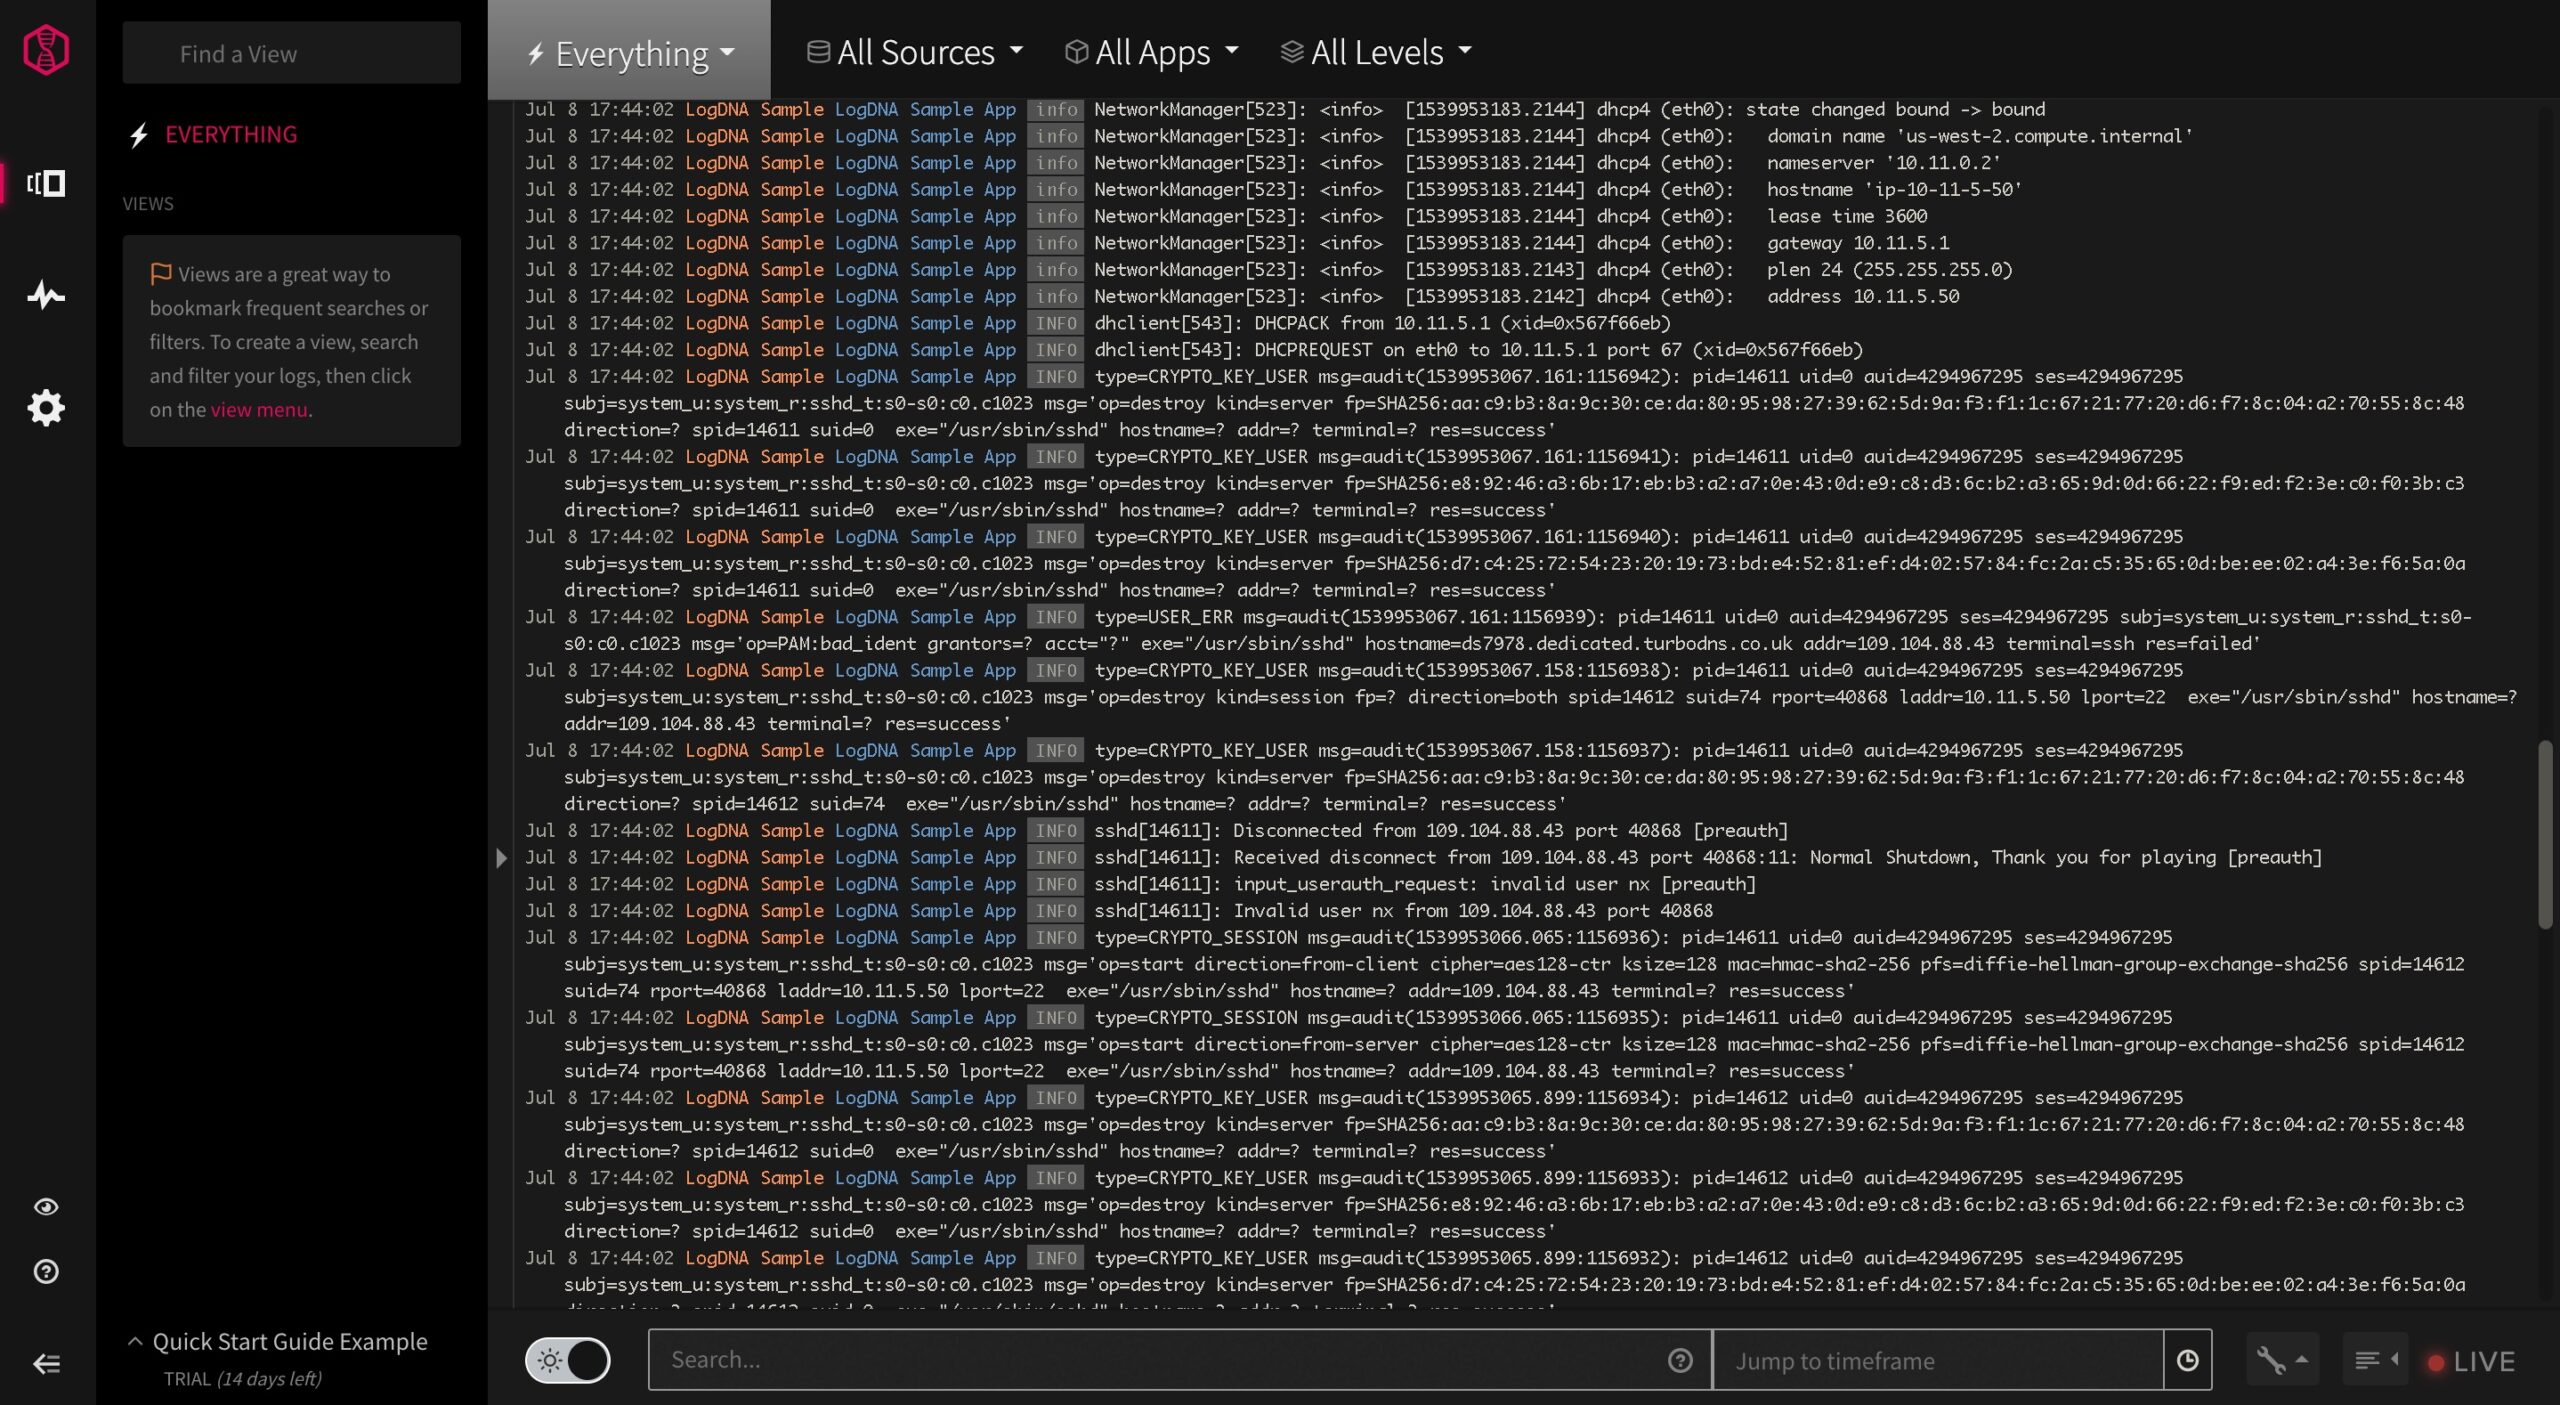
LogDNA is a tool for ingesting, storing, processing, analyzing, and routing log data. It centralizes data from any source, processes it in real-time, and forwards it to multiple destinations for specific use cases.
Key Features:
- Real-time log processing
- Custom parsing templates
- Powerful exclusion rules
- Versatile data input options
Why do we recommend it?
LogDNA is exceptional for its real-time processing and analysis capabilities, offering a high degree of customization in log management.
The tool has screens, dashboards, and graphs that aggregate and visualize critical log events to help identify trends.
Administrators have access to tools like powerful exclusion rules to manage log volume by only storing critical events. Regardless of the source, the tool can handle input from the LogDNA Agent, syslog, code libraries, or APIs. Once captured, this tool can automatically parse major log line types while using its Custom Parsing Templates for other input formats.
Who is it recommended for?
Best for teams that require a dynamic and scalable solution to manage high log volumes from varied sources, including cloud environments.
Pros:
- Rapid processing and forwarding of log data.
- Customizable to specific log formats and needs.
- Broad compatibility with various log sources.
Cons:
- Can be complex for users with basic log management needs.
Try LogDNA for FREE for 14 days.
Event Log Forwarding is part of infrastructure security
We hope that this Event Log Forwarding Guide has been of help to you. The main point to be taken from it is that this is a process that is critical for businesses that want to keep their data and networks secure. It can be used alongside infrastructure monitoring tools to protect mission-critical digital assets.
We would like to hear your thoughts – leave us a comment below.

