Over the past decade or so, network monitoring tools have become one of the core resources of most IT administrators in large organizations. As network monitoring has become more popularized, the market has become oversaturated with new tools, making it difficult to separate the good from the bad. In this article we look at some of the best network monitoring tools on the market and provide you with the key differentiators to look out for.
Here is our list of the best network monitoring tools on the market:
- Auvik EDITOR’S CHOICE SaaS package offers a series of network monitoring and management modules. These include network discovery and device monitoring with SNMP and link-by-link traffic capacity monitoring with flow protocols. The platform also offers a network configuration manager. Access a 14-day free trial.
- Paessler PRTG (FREE TRIAL) Collection of tools that monitoring networks, servers, and applications. The network monitor is based on SNMP. Runs on Windows Server. Get the 30-day free trial.
- Progress WhatsUp Gold (FREE TRIAL) Network performance monitor that uses SNMP procedures to gather device statuses. Installs on Windows Server. Start a 30-day free trial.
- AdRem NetCrunch (FREE TRIAL) A full-stack monitoring tool that can collect and analyze data from hundreds of targets. Its intuitive presentation tools make it easy to understand the analysis. Watch a demo and start a 30-day free trial.
- ManageEngine OpManager (FREE TRIAL) Combined server and network monitoring service. The network performance functions use SNMP to gather device statuses. Available for Windows Server and Linux. Download a 30-day free trial.
- Site24x7 Network Monitoring Tool (FREE TRIAL) Cloud-based platform of system administration tools and it is available as an add-on to a server monitoring system. Access a 30-day free trial.
- Zabbix Free, open-source system monitoring tool that includes SNMP-based network device monitoring. Installs on Linux, macOS, and Unix.
- Icinga 2 Developed from a fork of Nagios Core, this infrastructure monitoring system includes network monitoring and accepts Nagios plug-ins. Runs on Linux.
- Atera Cloud platform of tools for managed service providers includes an automated network monitoring service that operates remotely.
- Obkio A versatile network monitoring tool that can monitor all kins of devices on your network and provide the data you need for efficient troubleshooting.
- Nagios XI Based on the free Nagios Core, this infrastructure monitoring tool includes network monitoring and can be expanded by plug-ins that can be expanded by plug-ins. Installs on Linux.
- SolarWinds Network Performance Monitor SNMP-based system that checks on the statuses of network devices. The console for the monitor interprets device agent reports into live performance metrics and allows the analysis of historical data. Installs on Windows Server.
Our methodology for selecting the best network monitoring tools
When looking for a network monitoring tool, there are a number of factors to consider in order to get the most value for money. The key criteria listed below are features you can expect from a top-of-the-line network monitoring tool:
- Real-time and historic network monitoring
- Customizable dashboards
- Visualization features such as charts and graphs
- Alert systems
- User configured parameters
- Reports
If you find a tool with most of these features, then you can be sure it will hold its own within a dynamic enterprise environment.
The Best Network Monitoring Tools
These are some of the best network monitoring tools on the market.
1. Auvik (FREE TRIAL)
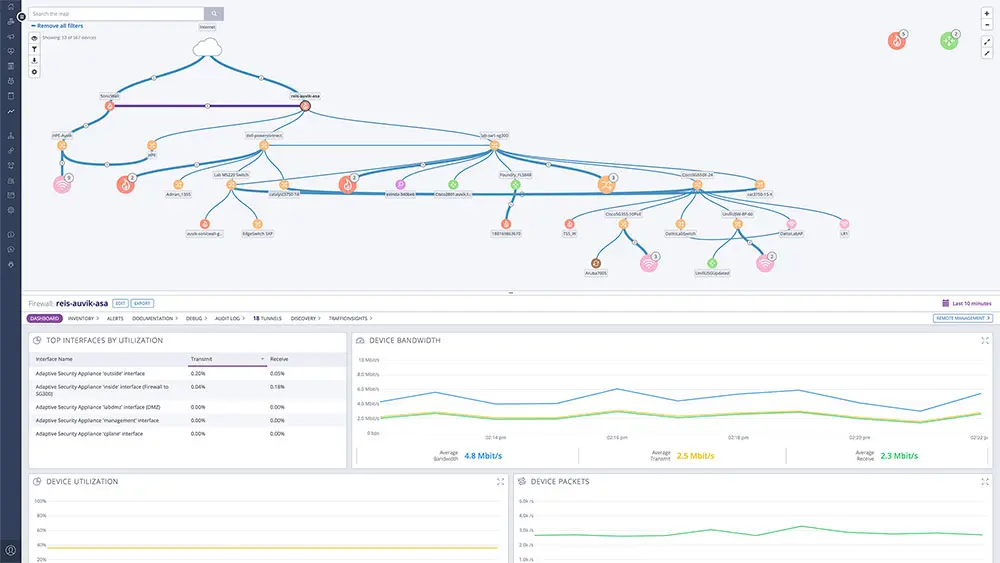
Auvik is a cloud-based SaaS platform that specializes in network monitoring and management. The package is able to monitor a network by installing a data collector on it – it can monitor multiple networks within one account.
Key Features:
- Automated Network Discovery: Automatically identifies and maps all devices within your network, providing real-time visibility into network topology and device connections.
- Preconfigured and Customizable Alerts: With over 50 preconfigured alerts based on industry best practices, Auvik notifies you of network events ranging from informational to critical. These alerts can be customized to suit specific monitoring needs.
- Remote Management: Enables remote access to network devices through in-app terminal, remote browser, and remote tunnel features, allowing for efficient troubleshooting and configuration without on-site visits.
- Configuration Backup and Recovery: Automatically backs up device configurations every 60 minutes, maintaining version control and facilitating quick recovery in case of device failure or misconfiguration.
- Traffic Analysis: TrafficInsights feature provides detailed information on network traffic patterns, helping identify bandwidth hogs and potential security threats.
Why do we recommend it?
Auvik stands out for its automated network discovery and real-time monitoring capabilities, providing IT teams with comprehensive visibility and control over their network infrastructure. The platform’s customizable alerts and remote management features further enhance its utility, making it a robust solution for proactive network management.
The data collector acts as an SNMP Manager. It sends out a request as a broadcast, so it doesn’t need to know any of the IP addresses of the devices on the network – it gets that information from the responses. Thus, this polling cycle is a discovery routine. All of the information that it gleans from this process gets uploaded to the Auvik server.
Auvik assembles the incoming data into a network inventory and it also generates a network map. Each network device will send out a warning if it develops a problem. These notifications appear in the Auvik console. Auvik can be set up to forward alerts to Service Desk systems as tickets.
The network traffic analyzer in the package communicates with network devices to extract data throughput metrics. The system already knows the full capacity of each interface from the SNMP sweep, so this unit is able to identify whether a link has hit full capacity or is approaching that level. The system will generate an alert for such a situation.
The third important service provided by Auvik is its Network Configuration Manager. This copies the configuration of each device as an image and stores it. The service revisits all devices every 60 minutes and takes another snapshot. Comparing that with the stored images for that device will reveal whether a change has been made. The system alerts the administrator who then has the choice of removing those changes by restoring the stored configuration or making them permanent by replacing the stored image with the new one.
Who is it recommended for?
Auvik is ideal for managed service providers (MSPs) and IT departments seeking a cloud-based network monitoring solution that offers quick deployment and scalability. Organizations managing multiple sites or complex network environments will particularly benefit from Auvik’s automated mapping and remote access functionalities.
Pros:
- Ease of Deployment: Users appreciate the straightforward setup process, enabling quick deployment across multiple sites without extensive configuration.
- Comprehensive Network Visibility: Automated discovery and mapping features offer a clear and detailed view of the network infrastructure, aiding in efficient management and troubleshooting.
- Customizable Alerting System: Ability to tailor alerts ensures that IT teams receive relevant notifications, reducing alert fatigue and improving response times.
- Remote Access Capabilities: Remote management tools enhance operational efficiency by allowing administrators to manage and troubleshoot devices without physical presence.
- Regular Configuration Backups: Automated backups of device configurations provide a safety net, enabling quick restoration in case of issues and ensuring network stability.
Cons:
- Traffic Analysis Limitations: While TrafficInsights offers valuable data, some users feel that the depth of traffic analysis could be enhanced to provide more granular insights.
Auvik doesn’t publish a price for either of its two editions, so you should contact the company to request a quote. You can try out the Auvik package with a 14-day free trial.
EDITOR'S CHOICE
Auvik is our top pick for a network monitoring tool because it provides four essential services for network administrators: Network discovery and documentation, device status monitoring, traffic monitoring, and network device configuration management. This package uses SNMP for deceive discovery and status monitoring, the IPFIX, NetFlow, sFlow, and J-Flow protocols for traffic measurements, and a scanning and backup routine for network configuration protection. This package is based in the cloud and can reach out to any network across the internet. It can also monitor multiple networks within one account.
Download: Start a 14-day FREE Trial
Official Site: https://www.auvik.com/features/#trial
OS: Cloud/SaaS
2. Paessler PRTG (FREE TRIAL)
Next up on our list we have Paessler PRTG. PRTG is one of the most well-known network monitoring tools on the market at the moment. One of the biggest selling points of PRTG thus far has been its versatility. It monitors everything from bandwidth to web pages, cloud services, servers, traffic, and databases, making it one of the most comprehensive network monitoring tools.
Key Features:
- Versatility: Monitors various network elements, including bandwidth, web pages, cloud services, servers, traffic, and databases, providing comprehensive monitoring capabilities.
- Dashboard Display: Hierarchical navigation tree on the dashboard offers clear visualization of network infrastructure status, distinguishing between operational and problematic elements.
- Monitoring Methods: Utilizes packet sniffing, SNMP, HTTP, WMI, and SQL for efficient and thorough network monitoring.
- Mobile App: Allows remote monitoring via a mobile app, offering convenience and accessibility for monitoring network devices on the go.
- Scalable Pricing: Offers flexible pricing options based on sensor requirements, accommodating the needs of organizations with varying network sizes and complexities.
Why do we recommend it?
Paessler PRTG earns our recommendation as a top-tier network monitoring tool due to its exceptional versatility, comprehensive monitoring capabilities, and user-friendly deployment process. Our recommendation is based on thorough testing and evaluation, affirming PRTG’s ability to effectively monitor various aspects of network infrastructure with ease. With its intuitive dashboard display and hierarchical navigation tree, PRTG simplifies network monitoring by providing clear insights into system performance and identifying potential issues promptly. Additionally, the convenience of its mobile app further enhances accessibility, especially for remote monitoring scenarios, making it an invaluable asset for organizations of all sizes.
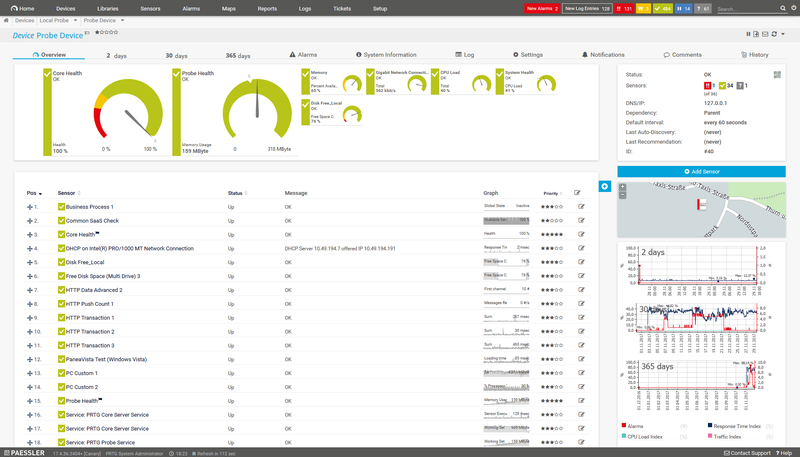
All data taken from your network infrastructure is displayed on the dashboard in a hierarchical navigation tree. Systems that are up and running are denoted with the color green, whereas problematic services are outlined in red. This makes it easy to distinguish between network elements that are performing from those experiencing difficulties. In order to monitor a network, PRTG uses a combination of packet sniffing, SNMP, HTTP, WMI and SQL.
PRTG is very easy to deploy. PRTG’s mobile app allows users to monitor devices on a remote basis. You simply attach a QR code to a network device and scan it on your mobile to view a breakdown of how the device is performing. This is useful in larger organizations because it provides more ease of access.
Who is it recommended for?
This tool is recommended for businesses and IT professionals seeking a versatile and reliable solution for network monitoring across diverse environments. Paessler PRTG caters to organizations of all sizes, from small businesses to large enterprises, providing scalable pricing options based on sensor requirements. It is particularly well-suited for network administrators, system engineers, and IT managers tasked with maintaining network performance and reliability. Whether you require monitoring for bandwidth, web pages, cloud services, servers, traffic, or databases, PRTG offers comprehensive functionalities to meet your specific monitoring needs effectively. Additionally, organizations looking for flexible pricing options and ease of deployment will find PRTG to be a valuable addition to their network management toolkit.
Pros:
- Exceptional Versatility: Monitors a wide range of network elements, providing comprehensive monitoring coverage.
- Intuitive Dashboard: Clear visualization of network status facilitates easy identification of operational and problematic elements.
- Convenient Mobile App: Enables remote monitoring via mobile devices, enhancing accessibility for on-the-go monitoring.
- Flexible Pricing Options: Offers scalable pricing based on sensor requirements, allowing organizations to tailor their monitoring setup according to their needs.
- Ease of Deployment: Simple setup process streamlines deployment, minimizing setup time and effort.
Cons:
- Sensor-Based Pricing: Pricing structure based on sensor count may lead to increased costs for organizations requiring a large number of sensors.
- Cost Considerations: Higher sensor counts may result in significant licensing costs, potentially limiting scalability for budget-conscious organizations.
A number of pricing options are available for PRTG Network Monitor. The price of your license depends on how many sensors you opt for. For example, PRTG 500 costs €1,440 and provides 500 sensors. If you want to buy more, then you can purchase a more expensive option like PRTG 5000 which offers 5000 sensors for €9,600. If you want an unlimited number of sensors, PRTG XL1/Unlimited costs €13,800.
On the whole, the user interface is very easy to use, though the visual displays can be quite consuming at times. A 30-day free trial of PRTG Network Monitor is available.
3. Progress WhatsUp Gold (FREE TRIAL)
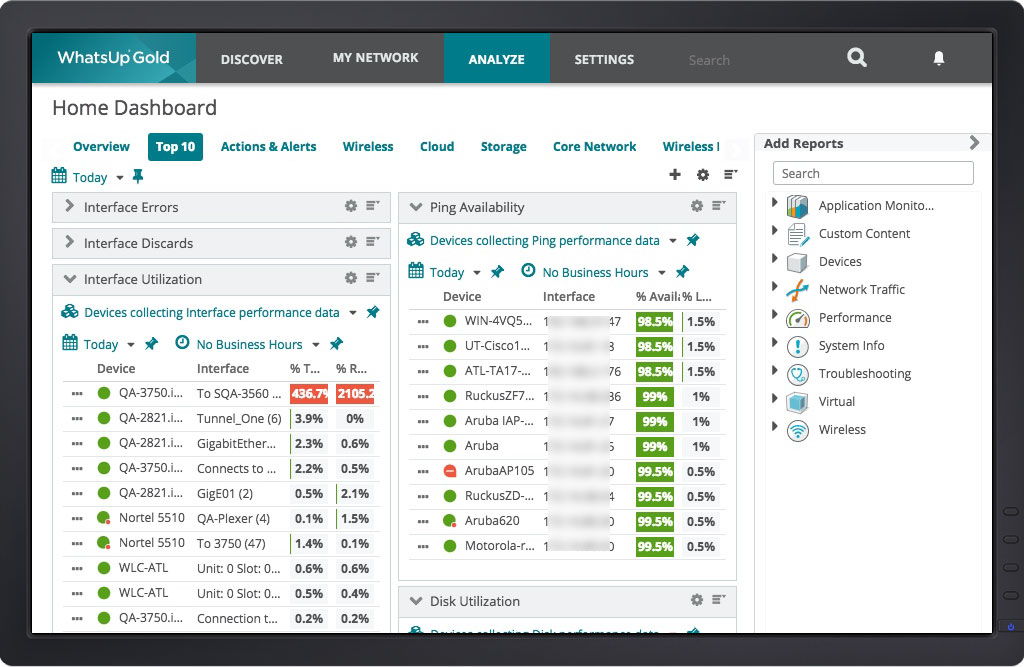
Progress WhatsUp Gold has developed a name for itself as a powerful and polished network monitoring tool for mid to large-size organizations. Without a doubt, its biggest appeal has to be its robust application performance monitoring. This allows the user to monitor their network right down to a device level. Whether your assessing the performance of Apache web servers, SQL servers, SharePoint, Exchange, or a Linux based system, WhatsUp Gold can monitor almost anything.
Key Features:
- Application Performance Monitoring: Offers robust application performance monitoring for various systems, including Apache web servers, SQL servers, SharePoint, Exchange, and Linux-based systems.
- Auto-Discovery Feature: Utilizes auto-discovery feature with IP range scan or SNMP scan to map devices on the network and produce a complete inventory of network elements.
- Cloud Services Monitoring: Monitors cloud-based systems and tracks cloud services expenditure on a monthly basis, providing comprehensive visibility into IT infrastructure.
- Network Traffic Analysis: Allows examination of network traffic flows with optional Network Traffic Analysis module for enhanced network performance monitoring.
- Scalable Pricing Options: Offers three versions: Premium (Annual Subscription), Premium (License), and Total Plus, with scalable pricing options to meet organizational needs.
Why do we recommend it?
Progress WhatsUp Gold stands out as a powerful and polished network monitoring tool. Our recommendation for WhatsUp Gold is based on its robust application performance monitoring capabilities, allowing users to monitor network performance down to a device level. With comprehensive monitoring support for various systems including Apache web servers, SQL servers, SharePoint, Exchange, and Linux-based systems, WhatsUp Gold offers unparalleled visibility into network infrastructure, making it an ideal choice for organizations prioritizing performance and reliability.
It also has its own auto-discovery feature, one of the key differentiators we outlined above. WhatsUp Gold uses either an IP range scan or an SNMP scan to map devices on your network and produce a complete inventory of network elements. You can view network topology in a diagram that shows where each device is situated on your network.
One of the main reasons why WhatsUp Gold has become popular is its ability to monitor cloud-based systems. The user can view the status of their cloud services straight from the dashboard and track cloud services expenditure on a monthly basis. This helps develop a more complete perspective of your IT infrastructure that doesn’t neglect cloud services in favour of the in-house network. WhatsUp Gold examines the health of network devices. You can examine network traffic flows by adding on a Network Traffic Analysis module.
Who is it recommended for?
WhatsUp Gold is recommended for mid to large-size organizations seeking a powerful and comprehensive network monitoring tool with advanced application performance monitoring capabilities. It caters to businesses across various industries, offering scalability and flexibility to meet diverse monitoring needs. WhatsUp Gold is particularly suitable for IT professionals, network administrators, and system engineers looking for a robust monitoring solution capable of monitoring both on-premises and cloud-based systems. Whether you require real-time monitoring, auto-discovery features, or cloud services monitoring, WhatsUp Gold provides the necessary functionalities to ensure optimal network performance and reliability. Additionally, organizations prioritizing comprehensive monitoring and cloud services integration will find WhatsUp Gold to be a valuable asset in their network management toolkit.
Pros:
- Robust Application Monitoring: Provides robust application performance monitoring for various systems, ensuring optimal performance and reliability.
- Auto-Discovery Feature: Utilizes auto-discovery feature to map devices on the network and produce a complete inventory of network elements, enhancing network visibility.
- Cloud Services Integration: Monitors cloud-based systems and tracks cloud services expenditure, offering comprehensive visibility into IT infrastructure.
- Scalable Pricing Options: Offers scalable pricing options with three versions to meet organizational needs, providing flexibility and cost-effectiveness.
- Comprehensive Monitoring: Provides comprehensive monitoring support for both on-premises and cloud-based systems, ensuring optimal network performance and reliability.
Cons:
- Complexity for Advanced Features: Advanced features such as Network Traffic Analysis may require additional setup and configuration efforts, potentially increasing complexity for users.
Three versions of WhatsUp Gold are available: Premium (Annual Subscription), Premium (License), and Total Plus. You will need to request a quote in order to see the official prices. However, if you’d like to view a detailed comparison of WhatsUp Gold’s features, you can do so on the company website here. You can also download a 30-day free trial.
4. AdRem NetCrunch (FREE TRIAL)
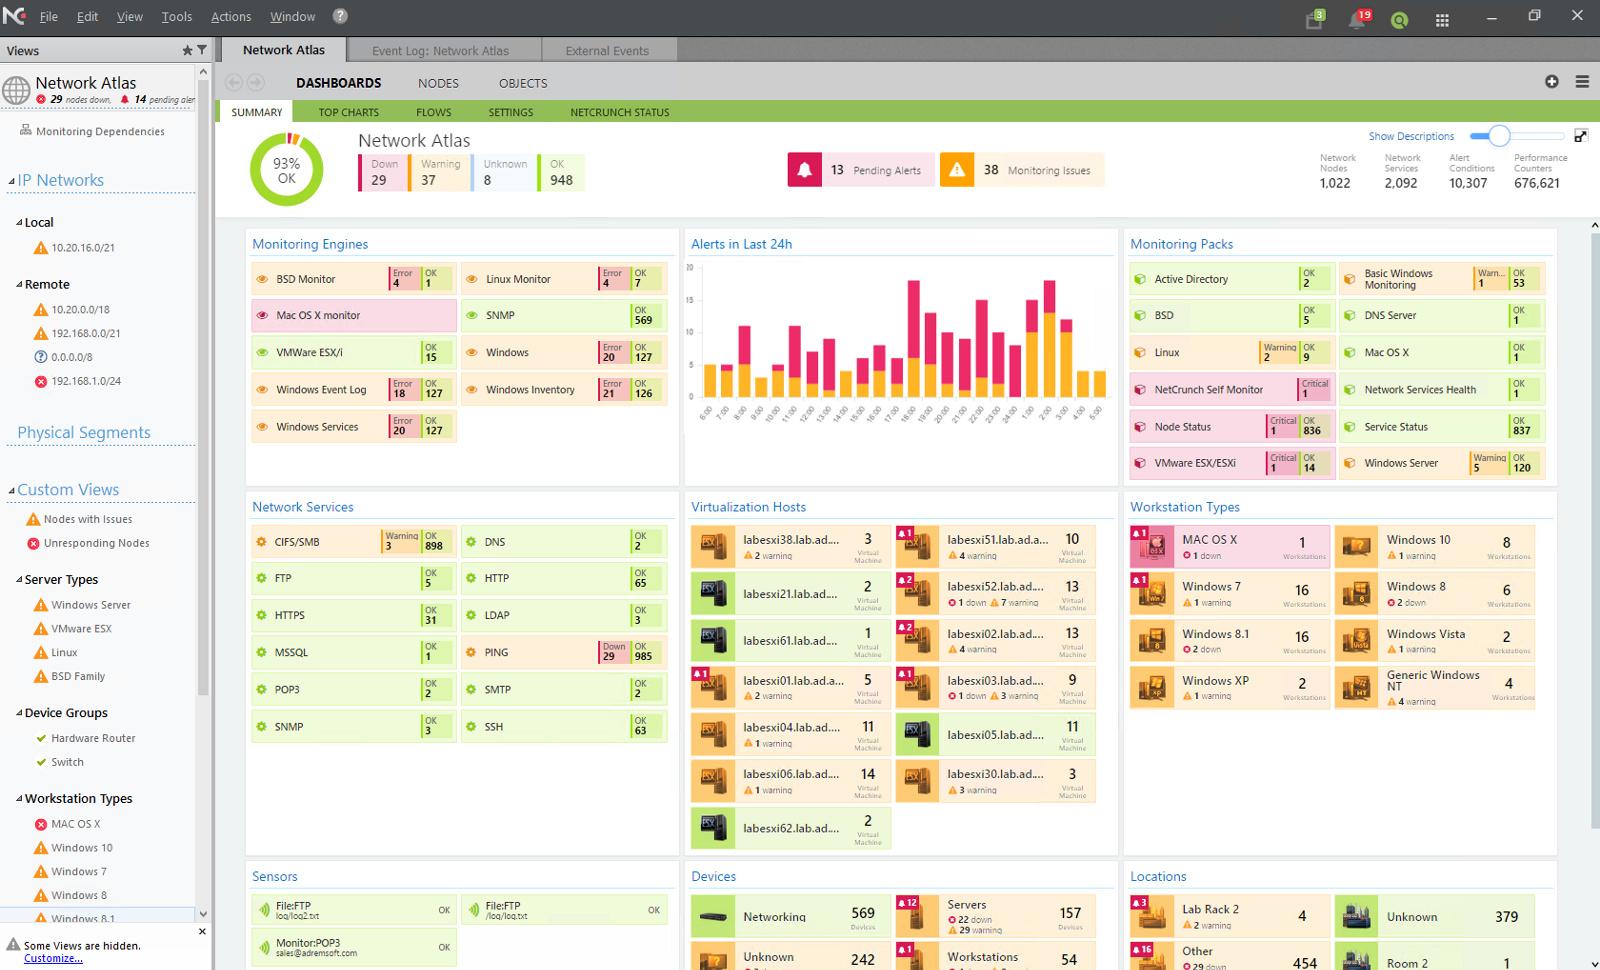
AdRem NetCrunch is an agentless monitoring tool that comes with 680 out-of-the-box monitoring templates to help you get started in minutes. Its extensive coverage, coupled with its intuitive data presentation, makes it a popular choice for mixed environments.
Key Features:
- Auto-discovery: Quickly auto-discovers your network and assigns monitoring packs to devices to start collecting data from them.
- Monitoring Templates: Comes with built-in templates for 680 targets, making it easy to get started within minutes.
- Deep Integrations: Integrates well with other applications in your network through REST APIs.
- Remote Actions: Correlates alerts and supports remote actions.
- Intuitive Presentation: Displays the analyzed data through intuitive dashboards, reports, and graphs.
Why do we recommend it?
NetCrunch is highly recommended for its ease of use and depth of coverage. Using this tool, you can monitor devices, protocols, events, applications, services, hardware components, and just about anything else in your network. This depth makes NetCrunch a handy tool in mixed IT/IoT environments and in industrial setups.
At the same time, NetCrunch is quick to set up and easy to use. It comes with out-of-the-box templates to monitor 680 unique targets, and you can start monitoring them with minimal changes. It automatically discovers network components and starts collecting data from them, without requiring explicit agents on each of these devices.
Who is it recommended for?
NetCrunch is a good choice for organizations that use different types of devices across operating systems. It works well for those who have a mix of IT, IoT, and industrial environments, as you can use NetCrunch to monitor anything from controllers to firewalls and routers.
Pros:
- Event Management: Monitors events and generates alerts accordingly.
- Data Presentation: Enables all users to understand the state of devices through customizable dashboards and reports.
- Integrations: Comes with many built-in integrations.
- Auto-discovery: Automatically discovers devices.
- Remote Actions: Enables you to take remote actions for escalations.
Cons:
- Complexity: May be too complex for small businesses.
NetCrunch offers three plans, which start at €2,625 for system monitoring, €2,325 for bandwidth and network monitoring, and €16,250 for large-scale mixed environments, respectively. You can watch a demo and start a 30-day free trial.
5. ManageEngine OpManager (FREE TRIAL)

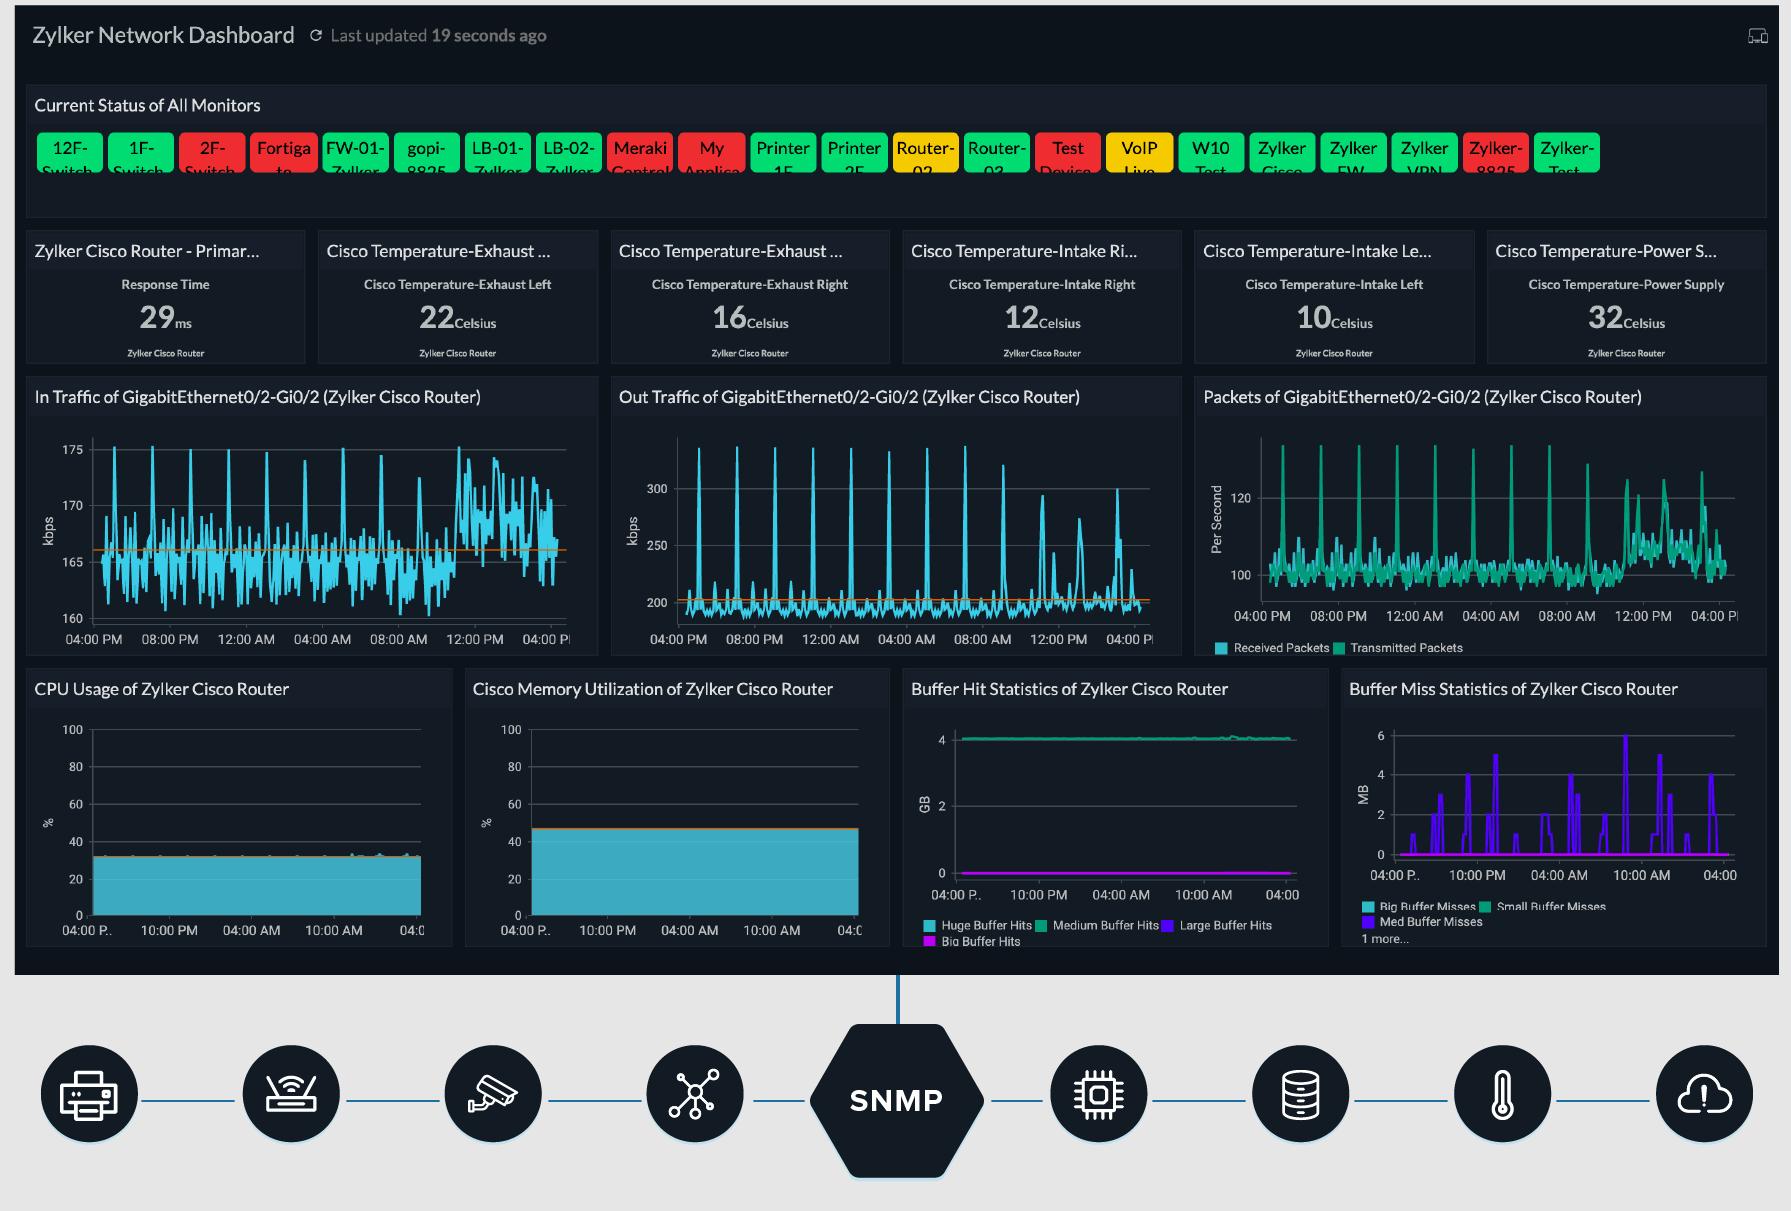
ManageEngine OpManager takes aim at those companies seeking a catch-all network monitoring solution. Like PRTG, this tool embodies all the key differentiators one would expect from a top-of-the-range product. Users can conduct real-time network monitoring and view their live network activity through a variety of dashboards and graphs. You can conduct physical and virtual server monitoring to monitor performance indicators like CPU, disk space and memory utilisation.
Key Features:
- Real-Time Monitoring: Conducts real-time network monitoring, providing instant visibility into network activity through intuitive dashboards and graphs.
- Server Monitoring: Monitors physical and virtual servers, tracking performance indicators such as CPU usage, disk space, and memory utilization.
- Automation: Streamlines setup and monitoring processes with automated network element discovery and threshold-based monitoring for alerts.
- Syslog and Trap Forwarding: Automates the forwarding of syslog and trap messages, facilitating proactive network monitoring and issue resolution.
- Customized Reporting: Generates customized reports to analyze network performance and trends, aiding in decision-making and optimization efforts.
Why do we recommend it?
ManageEngine OpManager earns our recommendation as an all-encompassing network monitoring solution designed to meet the diverse needs of modern enterprises. Our recommendation is founded on rigorous testing, affirming OpManager’s alignment with top-tier products in the market. With its real-time monitoring capabilities, intuitive dashboards, and extensive automation features, OpManager empowers users to efficiently manage and optimize their networks. Furthermore, its user-friendly setup process and minimalist interface enhance usability, ensuring seamless adoption and operation within organizations.
From the beginning, this program is extremely easy to set up. You can automate the discovery of your network elements by IP range, which helps reduce the amount of time spent setting things up. It doesn’t take much time to configure before you can start monitoring your network effectively. Once the program itself has been set up, it has one of the best user interfaces on this list. OpManager takes a minimalist approach that allows you to see just enough information to tell what’s going on, but not enough to confuse you (as can sometimes happen with PRTG!).
When it comes to monitoring servers, OpManager offers a large amount of automation. Threshold-based monitoring helps configure parameters to receive alerts. Adding on to this feature is reactive network monitoring, which automates the forwarding of syslog and trap messages. If you want to deliberate on your network performance a little more, you can generate customized reports.
Who is it recommended for?
This tool is recommended for companies seeking a comprehensive network monitoring solution that offers extensive automation and user-friendly features. ManageEngine OpManager caters to organizations of all sizes, providing scalable monitoring capabilities for both physical and virtual servers. It is particularly suitable for network administrators, IT managers, and system engineers tasked with overseeing network performance and reliability. Whether you require real-time monitoring, server performance analysis, or customized reporting, OpManager offers the functionalities needed to meet diverse network monitoring requirements effectively. Additionally, organizations prioritizing ease of setup, intuitive user interfaces, and proactive monitoring will find OpManager to be a valuable asset in their network management toolkit.
Pros:
- Comprehensive Monitoring: Offers comprehensive monitoring capabilities for various network elements, ensuring thorough network visibility.
- User-friendly Setup: Simplifies setup with automated network discovery and intuitive configuration options, minimizing setup time and effort.
- Minimalist Interface: Provides a minimalist interface design that balances information display with clarity, enhancing usability and user experience.
- Extensive Automation: Streamlines monitoring processes with automation features, such as threshold-based alerting and syslog forwarding.
- Customized Reporting: Allows for the generation of customized reports to analyze network performance and trends, facilitating informed decision-making.
Cons:
- Limited Free Trial Features: Some advanced features may be restricted in the free trial version, requiring users to upgrade for full functionality.
- Learning Curve for Advanced Features: Advanced configuration options may have a learning curve for users unfamiliar with network monitoring tools.
- Pricing Considerations: Pricing structure and scalability options may not be suitable for all organizations, especially those with budget constraints.
OpManager comes in one free version and two paid versions. The free version monitors up to 10 devices. The Essential version monitors up to 25 devices for $715 (£532). If that’s not enough, you can purchase the Enterprise version for $19,795 (£14,737), which monitors up to 500 devices. You can download a 30-day free trial.
6. Site24x7 Network Monitoring Tool (FREE TRIAL)
Site24x7 Network Monitoring Tool is a cloud-based system monitoring platform that offers a network monitoring module. The network monitor is not available as a standalone tool. It is an element of the Infrastructure package, which primarily monitors servers, and it also part of the All-in-one plan, which includes network, server, and application monitoring.
Key Features:
- Cloud-Based Monitoring: Offers cloud-based system monitoring platform, simplifying deployment and management for organizations.
- Comprehensive Monitoring: Integrates network monitoring within the Infrastructure package and All-in-One plan, providing holistic monitoring capabilities.
- Centralized Console: Hosts centralized console on cloud server, facilitating seamless access to monitoring data from anywhere.
- Network Performance Monitoring: Utilizes SNMP-based strategies for network performance monitoring, ensuring real-time visibility into network health.
- Traffic Analysis: Conducts bandwidth analysis using proprietary protocols like NetFlow, J-Flow, sFlow, Cflow, IPFIX, NetStream, and AppFlow for comprehensive traffic monitoring.
Why do we recommend it?
Site24x7 Network Monitoring Tool earns our recommendation as a comprehensive cloud-based system monitoring platform designed to meet the evolving needs of modern organizations. Our recommendation is based on its integration within the Infrastructure package and All-in-One plan, offering robust network monitoring functionalities alongside server and application monitoring. As a cloud-based service, Site24x7 simplifies deployment and management, while its centralized console provides seamless access to monitoring data. With its ability to merge network performance monitoring and traffic analysis, Site24x7 offers a holistic approach to network monitoring, ensuring comprehensive visibility and effective management.
As a cloud-based service, all of the processing for the network monitor is performed on the servers of Site24x7. The cloud server also hosts the console for the monitor. Although just about all of this monitoring system is hosted in the cloud, you do need one small program installed on a server connected to the network that is being monitored. This is a data collector and it uploads all of the statistics it collects to the Site24x7 server over an encrypted connection.
This network monitoring service merges the two types of monitors that usually supervise networks. This is the network performance category of monitor, which uses the strategies provided by the Simple Network Monitoring Protocol (SNMP). The other type of network monitoring that Site24x7 conducts is traffic analysis. This is a bandwidth monitor, which records data flow volumes through network devices, such as switches and routers.
The bandwidth analyzer can communicate following the different proprietary protocols used by each network device vendor. These are NetFlow, J-Flow, sFlow, Cflow, IPFIX, NetStream, and AppFlow.
Who is it recommended for?
This tool is recommended for organizations seeking a cloud-based solution for comprehensive system monitoring, including network, server, and application monitoring. Site24x7 caters to businesses of all sizes, offering scalable plans to meet diverse monitoring requirements. It is particularly suitable for IT professionals, network administrators, and system engineers tasked with maintaining network performance and reliability. Whether you require SNMP-based network performance monitoring or bandwidth analysis, Site24x7 provides the necessary functionalities to monitor and optimize network infrastructure effectively. Additionally, organizations prioritizing cloud-based solutions and centralized monitoring consoles will find Site24x7 to be a valuable asset in their toolkit.
Pros:
- Comprehensive Cloud-Based Solution: Offers comprehensive system monitoring, including network, server, and application monitoring, in a cloud-based platform.
- Scalable Plans: Provides scalable plans to meet the monitoring needs of businesses of all sizes, from small enterprises to large corporations.
- Centralized Management: Centralized console hosted on cloud server enables easy access to monitoring data, enhancing operational efficiency.
- Holistic Monitoring Approach: Merges network performance monitoring and traffic analysis for comprehensive network visibility and management.
- Support for Proprietary Protocols: Supports various proprietary protocols for bandwidth analysis, ensuring compatibility with different network devices.
Cons:
- Dependency on Cloud Infrastructure: Reliance on cloud infrastructure may raise concerns about data security and availability.
- Learning Curve for Advanced Features: Advanced configuration options may require some learning curve for users unfamiliar with network monitoring tools.
- Limited Free Trial Features: Some advanced features may be restricted in the free trial version, requiring users to upgrade for full functionality.
Site24x7 is a subscription service and you can get network monitoring in with the Infrastructure plan or with five editions of the All-in-One plan. Get started with a 30-day free trial .
7. Zabbix
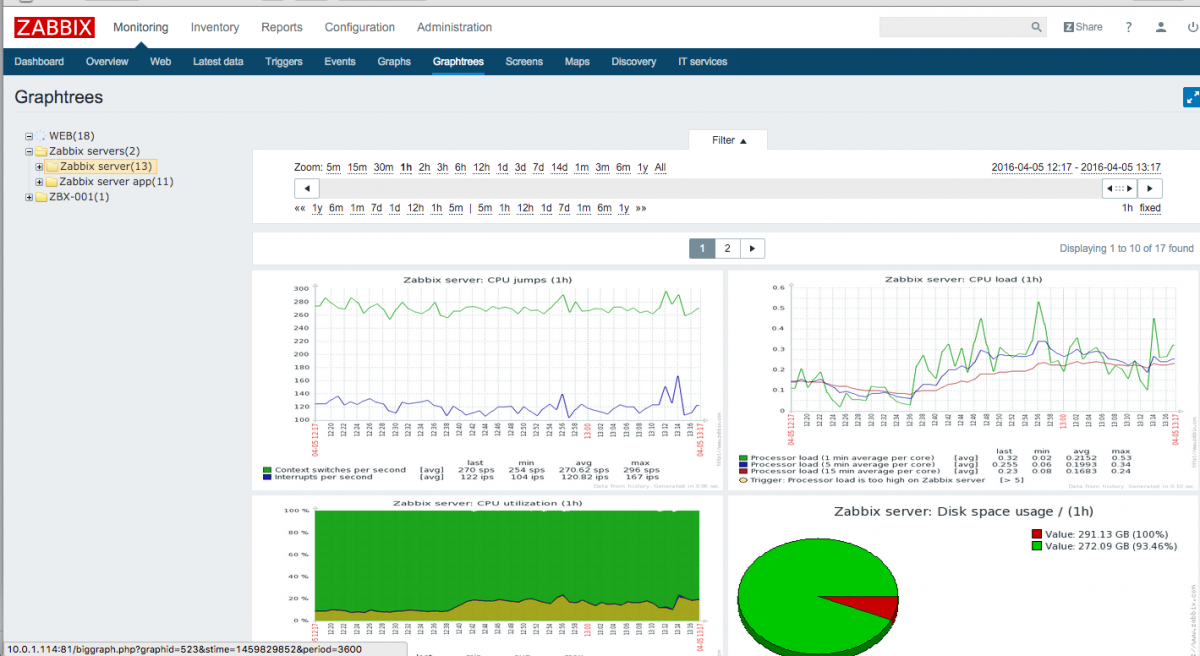
Organizations looking for an open source application would do well to considering deploying Zabbix. Zabbix is a network monitoring solution that combines infrastructure, cloud services, and KPI/SLA monitoring to provide a complete perspective of your network connectivity. Most consider this tool a network performance monitor, but it can serve a number of administrative functions as well.
Key Features:
- Comprehensive Monitoring: Offers infrastructure, cloud services, and KPI/SLA monitoring for a complete perspective of network connectivity.
- Network Performance Monitoring: Monitors crucial metrics like network bandwidth usage, CPU, and memory utilization to optimize network performance.
- Server Monitoring: Checks server availability and provides predefined warnings for critical issues, ensuring proactive issue resolution.
- Modern User Interface: Features a modern user interface for intuitive navigation and efficient monitoring operations.
- Open Source: Available as open-source software, providing flexibility and cost-effectiveness for organizations.
- Compatibility: Compatible with CentOS, Oracle Linux, Ubuntu, Red Hat Enterprise Linux, and Debian, ensuring compatibility with various Linux distributions.
Why do we recommend it?
Zabbix is a highly recommended open-source network monitoring solution that offers comprehensive infrastructure, cloud services, and KPI/SLA monitoring capabilities. Our recommendation for Zabbix is based on its ability to provide a complete perspective of network connectivity, coupled with its robust administrative functions. With features for network performance monitoring, server monitoring, and essential infrastructure checks, Zabbix ensures optimal network optimization and reliability. Despite being open source, Zabbix offers a modern user interface and reliable performance, making it an excellent choice for organizations prioritizing flexibility and cost-effectiveness in their network monitoring solutions.
Zabbix can view crucial information like network bandwidth usage, CPU, and memory utilization. These are essential to ensure the network is correctly optimized. You can view network health to see if any key services are experiencing difficulties and to help you to act quickly when a device fails.
With regards to server monitoring, you can check server availability and receive a number of predefined warnings. For example, if a device gets dangerously hot, then the system will flag the problem. This cuts down on the number of things you need to worry about.
Who is it recommended for?
Zabbix is recommended for organizations seeking an open-source network monitoring solution with extensive monitoring capabilities. It caters to a wide range of businesses and industries, offering flexibility and scalability to meet diverse monitoring needs. Zabbix is particularly suitable for network administrators, IT managers, and system engineers looking for a reliable and cost-effective solution for network monitoring. Whether you require network performance monitoring, server availability checks, or proactive issue detection, Zabbix provides the necessary functionalities to ensure network reliability and performance optimization. Additionally, organizations preferring open-source software and compatibility with various Linux distributions will find Zabbix to be a valuable addition to their network management toolkit.
Pros:
- Extensive Monitoring Capabilities: Offers comprehensive monitoring for network infrastructure, cloud services, and key performance indicators.
- Reliable Performance: Provides reliable performance despite being an open-source platform, ensuring network reliability and uptime.
- User-Friendly Interface: Features a modern and intuitive user interface, facilitating efficient navigation and monitoring operations.
- Cost-Effectiveness: As an open-source solution, Zabbix offers cost-effective network monitoring without compromising on features or performance.
- Compatibility: Compatible with various Linux distributions, providing flexibility and ease of deployment for organizations.
Cons:
- Learning Curve for Setup: Initial setup and configuration may require some learning for users unfamiliar with open-source monitoring tools.
- Limited Official Support: Being open source, official support may be limited compared to commercial solutions, requiring reliance on community support and resources.
- Customization Complexity: Advanced customization and configuration options may be complex for users without technical expertise in network monitoring.
Even though Zabbix is an open-source platform, its user interface looks very up-to-date. While it is a little more clunky than SolarWinds Network Performance Monitor, it still functions as a reliable network monitoring tool. Zabbix is available for CentOS, Oracle Linux, Ubuntu, Red Hat Enterprise Linux, and Debian. As an open source tool, Zabbix is available for free and can be downloaded from this link here.
8. Icinga
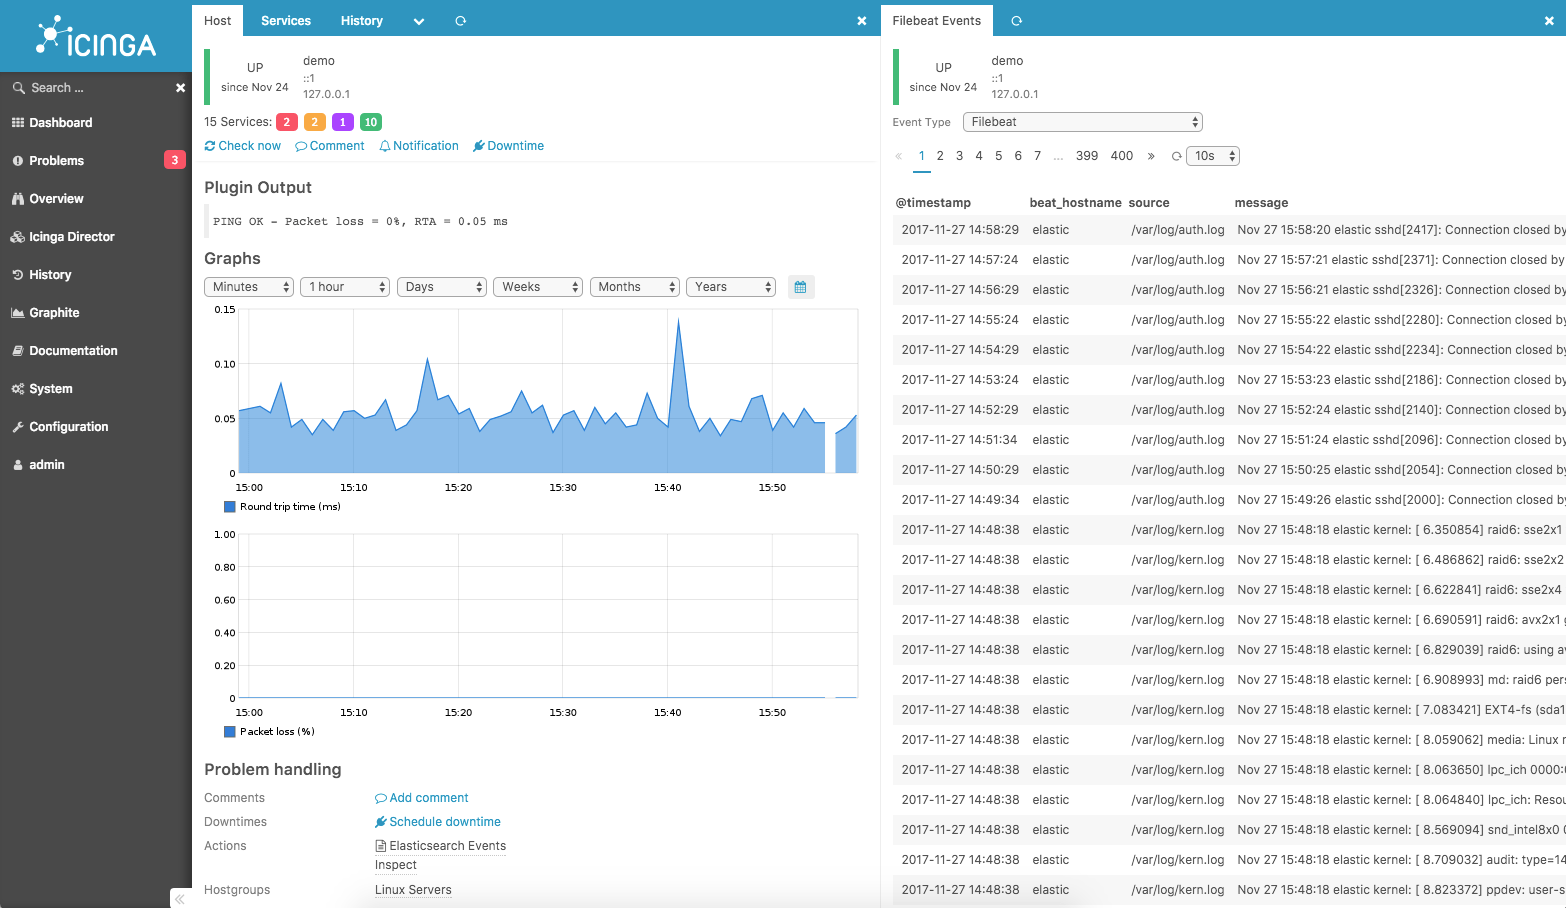
Next up on our list we have the exceedingly lightweight, open-source application Icinga 2. Icinga has become quite a popular network monitoring tool on account of its speed. The multithreaded design allows it to run thousands of checks each second without adversely affecting the performance of your computer.
Key Features:
- Remarkable Speed: Conducts thousands of checks per second without compromising system performance, thanks to its multithreaded design.
- REST API Integration: Interacts with users primarily through the REST API, allowing for manual configuration and viewing of monitoring information securely via SSL.
- Extensive Plugin Support: Supports third-party plugins like Graphite and InfluxDB for enhanced data gathering and visualization capabilities.
- Robust Alerting: Offers comprehensive alerting capabilities, notifying users via email or SMS about network issues promptly.
- Open Source: Available as open-source software, providing flexibility and cost-effectiveness for organizations.
Why do we recommend it?
Icinga 2 is highly recommended as an exceedingly lightweight and efficient open-source network monitoring tool. Our recommendation for Icinga 2 is based on its remarkable speed and multithreaded design, allowing it to conduct thousands of checks per second without compromising system performance. Despite its lightweight nature, Icinga 2 offers robust monitoring capabilities, making it an ideal choice for organizations prioritizing speed and efficiency in their network monitoring solutions.
Most of the user’s interaction with Icinga 2 is conducted with the REST API. The REST API is where you manually enter configurations and view information about issues raised by existing dashboards. The Rest API is secured via SSL so it cannot be viewed by unauthorized users. The only drawback to the REST API is that it’s not particularly friendly to users not experienced with command line interfaces.
When gathering information on your network, third-party plugins are necessary to get the clearest perspective of what’s going on. Plugins like Graphite and InfluxDB are supported by default on Icinga 2, but you might need to use additional services as well. While this isn’t as convenient as having everything one place, you can still view your data with complete clarity.
In terms of alerts, Icinga has plenty to offer. If any issues are spotted on your network, will be sent a notification via email or SMS. You can designate additional users to receive certain alerts if you need to come up with a segmented network event response.
Who is it recommended for?
Icinga 2 is recommended for organizations seeking a lightweight and efficient open-source network monitoring solution. It caters to businesses of all sizes, offering scalability and flexibility to meet diverse monitoring needs. Icinga 2 is particularly suitable for network administrators, system engineers, and IT professionals looking for a fast and reliable monitoring tool capable of handling high check loads. Whether you require real-time monitoring, REST API-based configuration, or extensive alerting capabilities, Icinga 2 provides the necessary functionalities to ensure optimal network performance and reliability. Additionally, organizations preferring open-source software and prioritizing speed and efficiency in their network monitoring solutions will find Icinga 2 to be a valuable asset in their toolkit.
Pros:
- Efficiency and Speed: Offers remarkable speed and efficiency, making it suitable for handling high check loads without compromising performance.
- Secure REST API: Provides secure interaction with users through the REST API, ensuring confidentiality and integrity of monitoring data.
- Extensive Plugin Support: Supports various third-party plugins for enhanced data gathering and visualization capabilities, allowing for a comprehensive perspective of network status.
- Comprehensive Alerting: Offers robust alerting capabilities, enabling prompt notification of network issues via email or SMS for timely response and resolution.
- Open Source: As an open-source solution, Icinga 2 provides flexibility and cost-effectiveness without compromising on features or performance.
Cons:
- Command Line Interface Dependency: Interaction primarily relies on the command-line interface, which may not be user-friendly for inexperienced users.
- Third-Party Plugin Dependencies: Dependency on third-party plugins for data gathering may require additional setup and configuration efforts.
Overall Icinga 2 offers a competitive platform despite its open source status. That being said, the REST API makes it unsuitable for users in need of a low-maintenance monitoring solution. Icinga 2 is available for free and can be downloaded here.
9. Atera

Atera is a SaaS platform that offers all of the software systems that a managed service provider (MSP) needs in order to operate. Among the technician’s tools in the remote monitoring and management (RMM) services of Atera is a remote network monitoring system.
Key Features:
- Automated Network Scanning: Conducts automated network scanning via SNMP, gathering device agent reports (MIBs) for interpretation.
- Live Activity Statistics: Provides real-time activity statistics on the network monitoring dashboard, ensuring visibility into network performance.
- Alerting Mechanism: Notifies technicians of issues requiring attention via alerts, enabling proactive issue resolution without constant monitoring.
- Remote Accessibility: Accesses the dashboard through any standard web browser, facilitating remote management for home-based technicians.
- Subscription Model: Offers flexible subscription plans charged per technician, with options for monthly or annual payment cycles.
Why do we recommend it?
Atera stands out as a comprehensive SaaS platform tailored for managed service providers (MSPs), offering essential software systems necessary for seamless operation. Our recommendation for Atera stems from its integrated remote monitoring and management (RMM) services, providing technicians with robust tools for network monitoring and maintenance. Through automated network scanning via SNMP, Atera simplifies network monitoring processes, ensuring timely detection and resolution of issues. Additionally, its intuitive dashboard and alerting mechanisms enhance operational efficiency, allowing technicians to focus on critical tasks without unnecessary interruptions.
The network monitoring system in the Atera package provides automated network scanning through the SNMP system. A sensor installed on the client’s network acts as the SNMP Manager. It gathers device agent reports (MIBs) and uploads them to the Atera cloud server for interpretation.
The network monitoring dashboard shows live activity statistics. However, busy technicians don’t need to waste time watching t because they will be notified by alerts if any problems need their attention. The alerting mechanism is a great cost saver because it means that multiple networks can be monitored simultaneously without any human involvement. The dashboard is accessed through any standard Web browser, so it is possible to manage a team of home-based technicians using this system.
Who is it recommended for?
This tool is recommended for managed service providers (MSPs) seeking an all-in-one solution for remote monitoring and management (RMM) services. Atera caters to the needs of MSPs of all sizes, offering scalable subscription plans based on the number of technicians. It is particularly suitable for IT professionals, network administrators, and MSP owners looking to streamline network monitoring processes and enhance service delivery. Whether you operate as a solo technician or manage a team of technicians, Atera provides the necessary functionalities to effectively monitor and manage client networks. Additionally, organizations prioritizing cost-effective subscription models and remote management capabilities will find Atera to be a valuable asset in their toolkit.
Pros:
- Comprehensive MSP Solution: Provides essential software systems for managed service providers, offering integrated RMM services.
- Automated Network Scanning: Simplifies network monitoring with automated scanning via SNMP, ensuring timely issue detection.
- Real-Time Activity Statistics: Offers live activity statistics on the dashboard, providing instant insights into network performance.
- Cost-Effective Alerting Mechanism: Saves costs by notifying technicians of issues, enabling simultaneous monitoring of multiple networks without human involvement.
- Remote Accessibility: Facilitates remote management through any standard web browser, enhancing flexibility for home-based technicians.
Cons:
- Subscription-Based Pricing: Subscription model based on the number of technicians may lead to increased costs for organizations with larger teams.
- Learning Curve for Setup: Initial setup and configuration may require some learning curve for users unfamiliar with RMM tools.
- Limited Free Trial Features: Some advanced features may be restricted in the free trial version, requiring users to upgrade for full functionality.
The Atera package is charged for by subscription with a rate per technician. Customers can choose to pay on a monthly or an annual cycle, with the yearly payment plan working out cheaper per month. The yearly prices for the three plans of Atera, when calculated monthly are:
- Pro – $129
- Growth – $179
- Power – $209
You can assess the Atera platform with a 30-day free trial.
10. Obkio
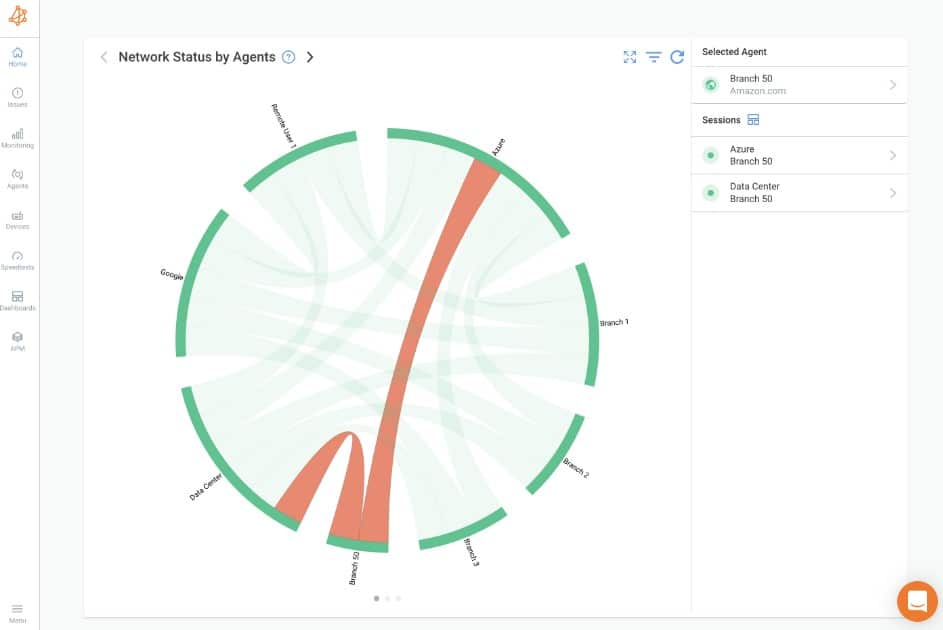
If you’re looking for a powerful tool that is simple to use, Obkio is your choice. It supports proactive monitoring by collecting and analyzing metrics across different components in your network. It puts together all these metrics to provide a unified view for better understanding of your network’s state and the issues impacting it.
Key Features:
- Software and Hardware Monitoring: Uses agents to monitor the hardware and software components in your network for a comprehensive view of your network.
- Distributed Monitoring Strategy: Monitors multiple networks, regardless of their location.
- Configuration Templates: Offers configuration templates to define the monitoring sessions.
- Performance Metrics: Supports a wide range of performance metrics to measure every aspect of your network.
- Network Path and Analysis: Monitors the network path to identify the exact location.
Why do we recommend it?
We recommend Obkio as it combines powerful features through a simple and intuitive user interface. Specifically, we love the way it correlates information across the entire network to provide detailed insights that help with making informed decisions. More importantly, these insights can be highly valuable for network administrators to troubleshoot issues.
Another feature we love is its Smart Alerts. This features groups notifications and events to prevent fatigue overload. It also provides the option to receive alerts through email or webhooks. These alerts can be integrated with third-party solutions as well.
Who is it recommended for?
It is recommended for network administrators who want detailed insights to resolve issues. It is also a good choice for executives who want to make decisions based on real-time data and insights. This detailed information can help MSPs to proactively troubleshoot issues and meet SLAs.
Pros:
- Intuitive Interface: Its interface is simple to use and understand for everyone.
- Quick Setup: Quick to setup, even for those with limited expertise.
- Comprehensive: Covers all aspects of your network device.
- Reporting: Generates extensive reports for different stakeholders.
Cons:
- Fewer Integrations: Offers fewer integrations when compared to competitors.
The Starter Plan begins at $224 per month when paid annually. You can also choose from the Basic, Premium, and Custom Enterprise plans. Start a 14-day free trial.
11. Nagios XI
Nagios XI is another very well-known network monitoring tool built with ease of use in mind. It can monitor network infrastructure and conduct long-term capacity planning. The GUI can be customized to accommodate a range of different views, making it relatively simple to use.
Key Features:
- Ease of Use: Built with ease of use in mind, Nagios XI offers a user-friendly interface and customizable GUI for efficient network monitoring.
- Customizable Views: Provides customizable views across the dashboard, enabling users to tailor monitoring displays to their specific requirements.
- Comprehensive Monitoring: Offers comprehensive monitoring capabilities for network infrastructure, event logs, notifications, bandwidth usage, and network queries.
- Multi-Tenant Access: Supports multi-tenant access, allowing administrators to control user access to specific IT elements, enhancing privacy and security.
- Advanced Reporting: Includes advanced reporting features such as scheduled reports, capacity planning reports, and audit logging for comprehensive network analysis.
- Scalable Pricing: Offers scalable pricing options with Standard and Enterprise editions, providing flexibility to choose features based on organizational needs.
Why do we recommend it?
Nagios XI comes highly recommended as a well-known and user-friendly network monitoring tool designed to simplify network infrastructure monitoring and long-term capacity planning. Our recommendation for Nagios XI is based on its ease of use, customizable GUI, and minimalist dashboard design, making it accessible to users of all levels of expertise. With comprehensive monitoring capabilities and customizable views, Nagios XI ensures efficient network monitoring and management, empowering organizations to proactively address network issues and optimize performance.
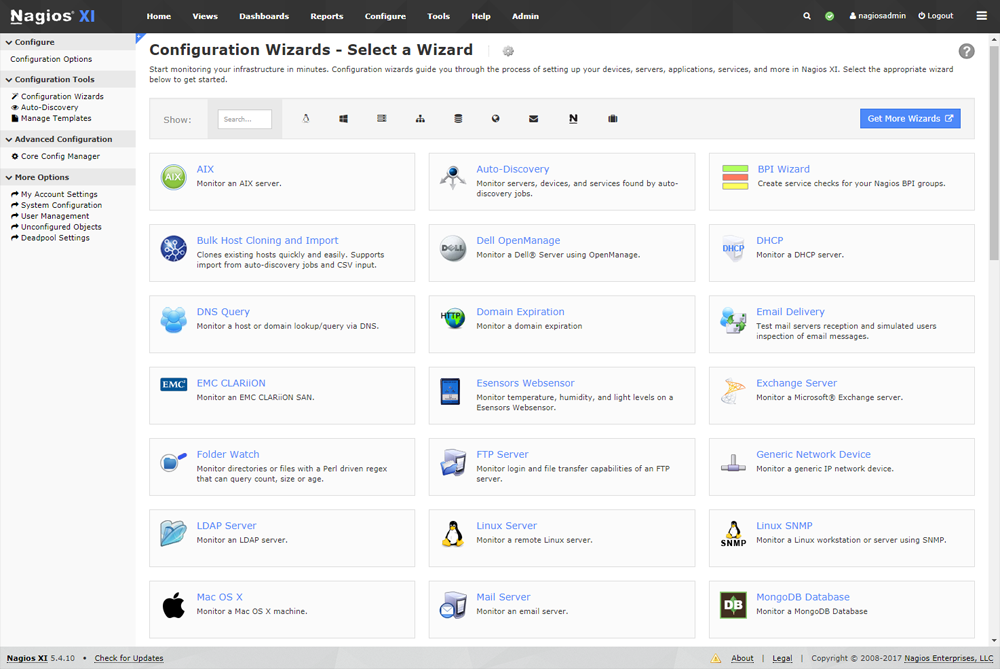
As you can see from the image above, Nagios XI takes a minimalistic approach across the dashboard. The navigation tree on the left-hand side provides you with everything you need to monitor your network. For example, if you click on Reports on the menu at the top left of the screen, you will be able to click through to event logs, notifications, bandwidth usage, and network queries immediately. This is important because you don’t have to sift through a lot of information to find what you want.
One unique feature offered by Nagios XI is multi-tenant access. Multi-tenant access allows an administrator to control what IT elements certain users see. This is particularly useful for organizations looking to show clients specific internal systems without compromising the privacy of their entire network.
Who is it recommended for?
Nagios XI is recommended for organizations seeking a user-friendly and customizable network monitoring solution with comprehensive monitoring capabilities. It caters to businesses of all sizes, offering scalability and flexibility to meet diverse monitoring needs. Nagios XI is particularly suitable for network administrators, IT managers, and system engineers looking for an intuitive and feature-rich monitoring tool capable of accommodating long-term capacity planning requirements. Whether you require advanced reporting, custom dashboards, or multi-tenant access, Nagios XI provides the necessary functionalities to ensure optimal network performance and reliability. Additionally, organizations prioritizing ease of use, customizable views, and multi-tenant access will find Nagios XI to be a valuable asset in their network management toolkit.
Pros:
- User-Friendly Interface: Customizable views and minimalistic dashboard design for intuitive navigation and monitoring.
- Customizable Dashboards: Allows users to customize dashboards to display relevant monitoring information, enhancing visibility and efficiency.
- Multi-Tenant Access: Supports multi-tenant access for controlled user access to specific IT elements, ensuring privacy and security.
- Comprehensive Monitoring: Offers comprehensive monitoring capabilities for network infrastructure, event logs, notifications, and bandwidth usage, providing insights into network performance.
- Scalable Pricing Options: Provides scalable pricing options with Standard and Enterprise editions, allowing organizations to choose features based on their monitoring requirements and budget.
Cons:
- Dependency on GUI: Dependency on the GUI for configuration and monitoring may limit flexibility for advanced users accustomed to command-line interfaces.
- Price Considerations: Pricing may be a barrier for smaller organizations or those with limited budgets, especially for advanced features available in the Enterprise edition.
Price-wise, a couple of options are available. The first is the Standard Edition, which can be purchased for $1,995 (£1,486) and offers a GUI, advanced reporting, custom dashboards, visualisations, and notifications. The second is the Enterprise Edition, available from $3,495 (£2,603), which includes a number of features such as scheduled reports, capacity planning reports, and audit logging. Nagios XI can be downloaded from here.
12. SolarWinds Network Performance Monitor

When searching for the ultimate network monitoring tool, you need look no further than SolarWinds Network Performance Monitor. This platform has been designed from the ground up to make the process of monitoring your network as painless as possible. Enterprises seeking a performance monitor with extensive automation are supported by a number of features.
Key Features:
- Auto-Discovery: Quickly and accurately discovers devices on the network, simplifying the setup process and eliminating manual intervention.
- Customizable Dashboards: Tailor the dashboard to display relevant network information, such as application health and connectivity status, providing a comprehensive overview of network performance.
- Automated Alerts: Set customizable alert parameters to receive timely notifications via email or SMS, ensuring proactive identification and resolution of network issues.
- Heatmaps: Visualize network connectivity and topology through heatmaps, offering insights into areas of strong and weak connectivity for effective diagnostics.
- User-Friendly Interface: Intuitive interface design facilitates easy navigation and configuration, enhancing user experience and productivity.
Why do we recommend it?
SolarWinds Network Performance Monitor earns our recommendation as a network monitoring tool due to its seamless automation, comprehensive feature set, and user-friendly interface. Having extensively tested the product ourselves, we found its ability to streamline network monitoring processes to be unparalleled. With its robust auto-discovery function, customizable dashboards, and automated alerts, this platform significantly enhances network management efficiency. Moreover, its intuitive design fosters a user-centric experience, empowering organizations to monitor and optimize their networks with ease.
Chief among these features is Network Performance Monitor’s auto-discovery function. SolarWinds automatically discovers devices on your network and adds them to the platform. This process can be completed in less than an hour and means you don’t have to spend time manually locating devices throughout the network. The simplicity of this feature is something that is carried over into the user interface as a whole.
You can customize the dashboard and choose what information you’d like to see about your network. For example, you may wish to view a pie chart that outlines application health or a map of your connectivity. You can also choose to look at activity for a particular IP address. There are many different dashboards and views to choose from show how your network runs. The inherent flexibility of the dashboard makes this a solution that can be tailored to meet an individual organization’s needs.
Network Performance Monitor also has an inbuilt alerts system. The user can set parameters for alerts, and the program will send notifications via email or SMS once the alert criteria has been met. You don’t need to manually monitor your network 24/7 in order to stay up to date with new events. The notifications feature automates this process and flags up events where there is an issue.
If you want a clearer perspective of your network connectivity and topology, Network Performance Monitor can produce heatmaps as well. A heatmap of IT infrastructure shows where connectivity is good and where it is poor, an invaluable diagnostics tool. The NPM focuses on the statuses of network devices. If you want a deeper perspective on network traffic, you will also need the SolarWinds NetFlow Traffic Analyzer.
Who is it recommended for?
This tool is recommended for a wide range of enterprises seeking a comprehensive solution for network monitoring and management. From small businesses to large corporations, SolarWinds Network Performance Monitor caters to organizations of varying sizes and complexities. Specifically, it is ideal for IT professionals, network administrators, and system engineers tasked with overseeing network infrastructures. Whether you’re aiming to streamline operations, improve network performance, or enhance overall reliability, this tool provides the necessary functionalities to meet diverse organizational needs. Additionally, businesses looking to minimize downtime, proactively identify network issues, and optimize resource allocation will find immense value in adopting this solution.
Pros:
- Effortless Auto-Discovery: Automatically locates devices on the network, reducing setup time and manual effort.
- Customizable Dashboards: Tailor dashboards to display preferred network metrics, providing a personalized monitoring experience.
- Automated Alerts: Receive timely notifications about network events, enabling proactive problem resolution and minimizing downtime.
- Comprehensive Connectivity Insights: Generate heatmaps to visualize network connectivity status, aiding in troubleshooting and optimization.
- Intuitive Interface: User-friendly interface promotes ease of use and navigation, facilitating efficient network management.
Cons:
- Additional Tool Required for Detailed Traffic Analysis: For in-depth network traffic analysis, users may need to integrate SolarWinds NetFlow Traffic Analyzer, adding complexity to the monitoring setup.
Overall this is a great product for SMEs and larger enterprises alike. SolarWinds Performance Monitor comes with a price tag of $2,895 (£2,156). You can also download the free trial.
Network performance monitoring considerations
As you can see from our list, there are a lot of very good network performance monitoring tools on the market today. It is very difficult to choose between them. You first selection criteria should be the operating systems that each of these tools will run on. For example, if all of your servers have Linux operating systems, you just won’t be able to install those tools on our list that only operate on Windows.
Another major consideration that you will face is your budget. Some of these tools are very expensive. Although they are worth the money, if you just can’t get the funds allocated to your department for monitoring tools, you won’t be able to include them as candidates.
Take advantage of the free trials that the tools in our list offer to put your favorite three through their paces and check out which works best for your network.
The Ultimate Network Monitors
All of the tools mentioned in this list can function as complete network monitoring tools. If you’re running an enterprise-grade network, then network monitoring is essential to ensure your key services stay up in the long term. Without a network monitoring tool to guide your hand, running any form of troubleshooting or network optimization is extremely difficult.
Products like Auvik and Paessler PRTG are our top picks for network monitoring. Both of these programs allow you to hit the ground running thanks to auto-discovery and monitor your network through a clean and customizable user interface.
In an active business environment that’s centred on online activity, network monitoring has become ever more important in keeping enterprises operational year-round. A network monitoring platform should be one of the first purchases you consider to keep your downtime to a minimum and improve core services.