
Virtualization has unlocked new capabilities and enable enterprises to run multiple OS’s and applications on one computer. The change has brought many perks but has raised significant challenges in terms of visibility. Monitoring virtual resources isn’t a simple task – you need a virtualization monitoring tool to manage performance effectively. In this article, we’re going to look at the 10 best VM monitoring tools.
Here is our list of the best VM monitoring tools:
- NinjaOne (EDITOR’S CHOICE) A remote monitoring and management package that is delivered from the cloud and includes Hyper-V and VMware virtualization monitoring. Start a 14-day free trial.
- Paessler PRTG Network Monitor (FREE TRIAL) Network monitoring tool that can monitor virtualized services. You can monitor the CPU, memory load, and available disk space of virtual machines. Start a 30-day free trial.
- ManageEngine OpManager (FREE TRIAL) A network and server monitor that can track VMWare, Hyper-V, Nutanix, and Citrix hypervisors. Available for Windows Server and Linux. Start a 30-day free trial.
- ManageEngine Applications Manager (FREE TRIAL) Application monitoring solution that can monitor Microsoft Hyper-V and VMware resources. There is a root-cause analysis engine to help troubleshoot performance issues. Start a 30-day free trial.
- Site24x7 VMware Monitoring (FREE TRIAL) A server monitoring system that includes the supervision of services, such as virtualizations. This is a cloud-based platform. Start a 30-day free trial.
- LogicMonitor An infrastructure monitoring tool with application and container monitoring. The software has an anomaly detection feature that can detect abnormal performance.
- SolarWinds VM Monitor A free virtualization monitoring tool that can monitor the performance, CPU, memory usage, and network usage of Microsoft Hyper-V and VMware hosts, and virtual machines.
- Veeam One A network monitoring tool that can monitor physical and virtual services. It comes with support for VMware v-Sphere and Microsoft Hyper-V.
- eG Enterprise An infrastructure and application monitoring tool with root cause analysis. You can monitor how a hypervisor’s physical resources are used and the applications/users that contributed to the resource usage.
The Best VM Monitoring Tools
1. NinjaOne (FREE TRIAL)
NinjaOne provides remote monitoring and management (RMM) tools from a cloud platform with modules that watch over infrastructure systems, such as virtualizations. The package monitors Hyper-V and VMware as part of that remit.
The platform also provides network, server, and application monitoring. You also get application management features, such as patching, which takes care of the virtualization software itself.
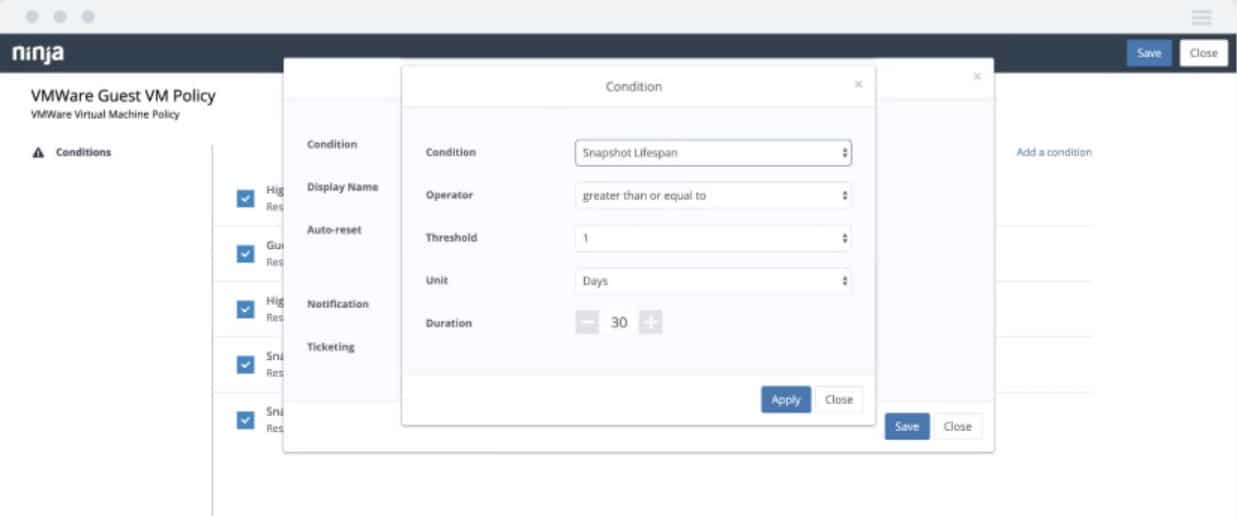
The NinjaOne system populates the technician dashboard with both hardware and software inventories and it also automatically discovers and maps virtualizations. The VM monitoring service enables certain management functions to be performed through the interface. The tool includes performance tracking, which is based on a number of expectation thresholds and they will trip alerts if they are not met. The tool watches over the physical resource usage of each virtual system and examines the allocation of VMs to virtual servers.
The NinjaOne package is a cloud-based system and it has an optional multi-tenant structure that managed service providers will use to keep the data of their clients separate. IT departments would use the package for in house monitoring without activating the subaccount feature. Assess the NinjaOne package with a 14-day free trial.
EDITOR'S CHOICE
NinjaOne is our top pick for a VM monitoring tool because this cloud platform provides a full remote monitoring and management (RMM) package that includes the tracking of virtualization performance. Thus, you aren’t limited to just monitoring VMs; you get automated monitoring for all of the applications that you run in them and the servers that they run on as well. The platform will monitor Hyper-V and VMware implementations – these are the two most widely used virtualization brands. It watches over the relationship between VMs and hosts, checking on internal resource availability as well as the physical server resources that support the entire hypervisor system. The package includes a series of performance thresholds and each will trigger an alert when crossed. You can create your own triggers or adjust the levels of existing thresholds. These buy you time to fix any capacity issues that are dragging down your VM performance. The console can be set up to forward alerts to technicians by email or SMS, so that don’t have to watch the dashboard all the time. NinjaOne has a multi-tenant architecture that allows managed service providers to keep the data of their clients separated in secure subaccounts. IT departments can also use the package without setting up the subaccount structure.
Download: Get a 14-day free trial
Official Site: https://www.ninjaone.com/freetrialform/
OS: Cloud based
2. Paessler PRTG Network Monitor (FREE TRIAL)

Paessler PRTG Network Monitor is a free network monitoring tool that can monitor virtual machines. It monitors the CPU load, disk speed, and memory usage of virtual machines. There are a number of sensors designed for virtual machines including VMware Host Hardware Sensor, VMware Virtual Machine Sensor, VMware Host Hardware Status Sensor, VMWare Datastore Sensor, and more.
Each sensor monitors different information. For example, the VMWare Virtual Machine Sensor monitors the CPU load, memory usage, disk read and write speed of individual virtual machines. In contrast, the VMware Host Hardware Status Sensor monitors the health of host systems.
You can set alerts for each sensor to determine when you receive notifications. It creates notifications for sensor status changes, sensor value threshold breaches, speed threshold breaches, volume threshold breaches, and sensor value changes. Alerts can be sent through email, SMS, Slack message, SNMP traps, push notifications, and more.
Paessler PRTG Network Monitor is a low-cost tool that’s ideal for SME’s because the first 100 sensors are completely free. Paid versions of start at $1,600 (£1,237) for 500 sensors. You can download a 30-day free trial.
3. ManageEngine OpManager (FREE TRIAL)

ManageEngine OpManager is a monitoring system for networks and servers. It has the ability to monitor VMWare vShpere and ESXi, Microsoft Hyper-V, Citrix XenServer, and Nutanix HCI.
OpManager has an integrated system discovery module. This tracks all physical and virtual systems. When it finds a virtualization, you will need to enter access credentials into the monitor and then it will trace all of the servers within the hypervisor and its dependent virtual machines.
The discovery and system mapping services are constant, so it provides live coverage of your virtualizations. It tracks resource utilization by each virtual instance and also looks at the server resources of the underlying host. These monitors all have performance thresholds active on them and they will trigger alerts if activity goes outside the normal pattern or if system resources run low. The thresholds trip alerts if they are crossed. This system automates all monitoring activities because it is only necessary to pay attention to the system on the rare occasions that problems arise.
OpManager is an on-premises software package that installs on Windows Server or Linux. ManageEngine offers OpManager on a 30-day free trial.
4. ManageEngine Applications Manager (FREE TRIAL)

ManageEngine Applications Manager is a server and application monitoring tool with virtualization monitoring. With this tool you can monitor virtual machines VMware ESX/Esxi, VMware venter, VMware Horizon View, Citrix Xen App, Citrix XenServer, and Microsoft Hyper-V.
To monitor virtual machines, ManageEngine Applications Manager collects data on availability, health, and CPU usage. No less important is the platform’s ability to monitor the hardware that supports the virtual machines – so you can make sure that resource usage or memory utilization isn’t causing poor performance. You can also view an overview of the Top Virtual Machines in your network to see those that are consuming the most resources.
ManageEngine Applications Manager has a threshold-based alarms system. Alarms can be categorized as Critical, Warning, Clear, and Unknown. When an alert is created it is sent via email or SMS. These alarms ensure that you don’t miss the signs of performance degradation.
Midsize enterprises looking to manage a range of virtual resources would be well advised to check out ManageEngine Applications Manager. You can request a quote from the company directly. There is a 30-day free trial.
5. Site24x7 VMware Monitoring (FREE TRIAL)
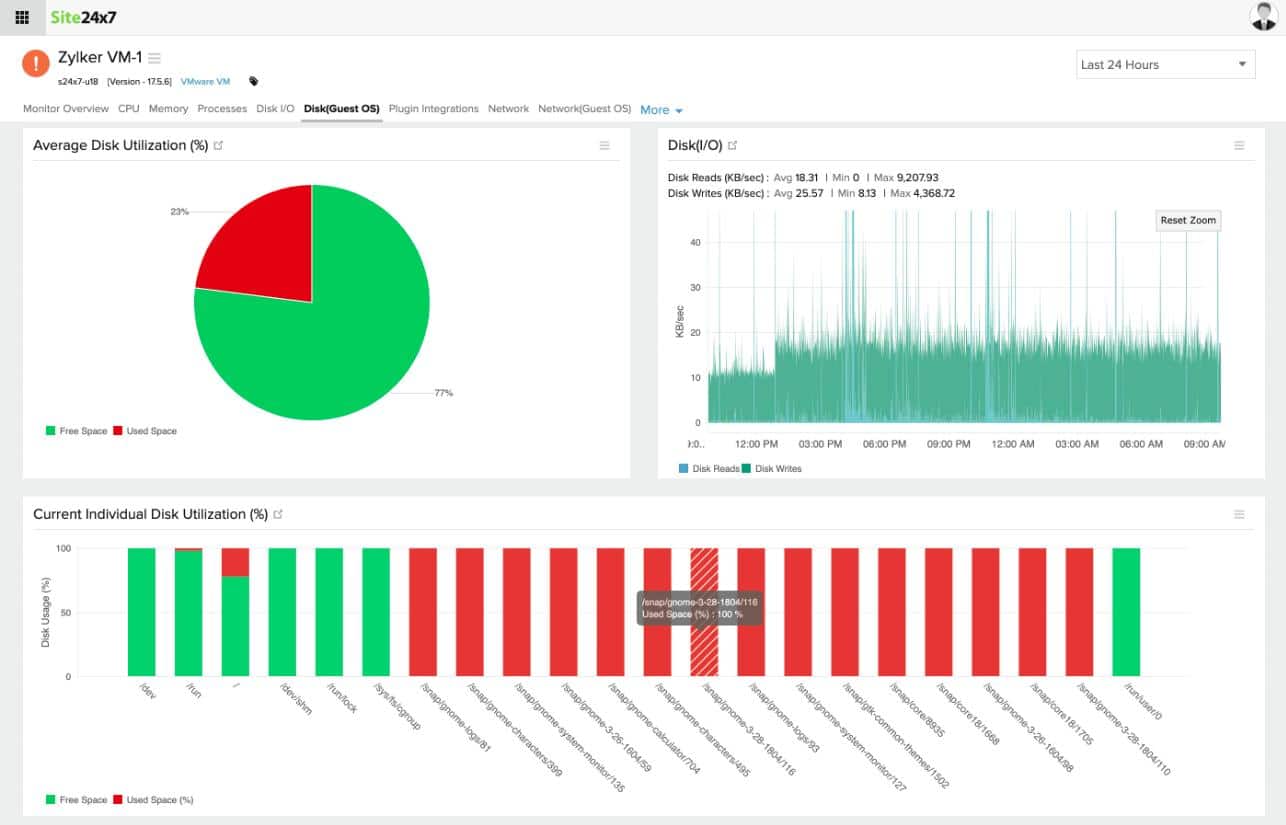
Site24x7 VMware Monitoring is a monitoring system for all of the services that support user interfaces and the servers that they all run on. Site24x7 is a cloud-based monitoring platform that includes a range of tools, of which Infrastructure is one. It is possible to expand the Infrastructure package with add-on services, such as network monitoring and it is also possible to get the Infrastructure module together with all of the other systems administration services of Site24x7 in the All-in-one package.
The services covered by Site24x7 Infrastructure include virtualizations. The system includes special screens for the monitoring of VMWare and Hyper-V virtualizations. It can also monitor Docker activity and the Nutanix hyper-converged infrastructure system.
Virtualization management can be complicated. The issue of mapping virtual machines to virtual servers and then the hosting of virtual servers on physical servers creates a cascading dependency on resources that can be difficult to track. You can reserve a large amount of space on the server both in terms of disk, memory, and processors for the exclusive use of the virtualization, but that leaves you with wasted resources if the hypervisor never grows to its allocated size. On the other hand, size the allocation too tightly and your hypervisors could soon be running out of space.
The only solution to the difficulties of optimizing resources is to implement automated monitoring and that’s what Site24x7 provides. This service includes threshold monitors on all of the key resources needed within the hypervisor and on the supporting host. If one of these levels gets crossed, the Site24x7 system raises an alert, which can be sent on as SMS or email notifications to key staff. Get started with a 30-day free trial.
6. LogicMonitor
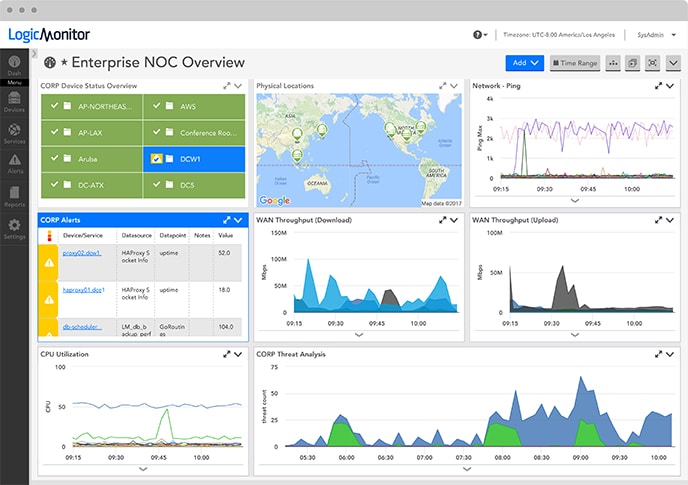
LogicMonitor is a SaaS-based network and application monitoring tool. It’sagentless so you can be up and monitoring virtual machines promptly. Virtual machines that the tool monitors include VMware venter, VMware ESX/I, Microsoft Hyper-V, and Citrix XenServer. The platform automatically discovers physical and virtual infrastructure and adds it to a network map.
The platform has its own alert system and issues them by SMS and email. For even more control you can create escalation chains to ensure a timely response if a member of your team is unavailable.
There are three versions of LogicMonitor available to purchase: Starter, Pro, and Enterprise. The Starter version starts at 50 devices, the Pro version at 100 devices, and the Enterprise version at 200 devices. You can request a quote from the company directly. Sign up for the 14-day free trial.
7. SolarWinds VM Monitor

SolarWinds VM Monitor is a free virtual machine monitoring tool that monitors virtual machines in real-time. With SolarWinds VM Monitor you can monitor VMware vSphere and Microsoft Hyper-V hosts/machines. Metrics that you can view include CPU, memory, number of VMs, and more.
You can also view other details about virtual machines including VM name, guest OS, and state. The information provided helps you to watch out for the signs of performance degradation.
If you’re looking for a basic, low-cost virtual machine monitoring tool then SolarWinds VM Monitor is a good choice. The software is completely free. You can download the software for free.
8. Veeam One
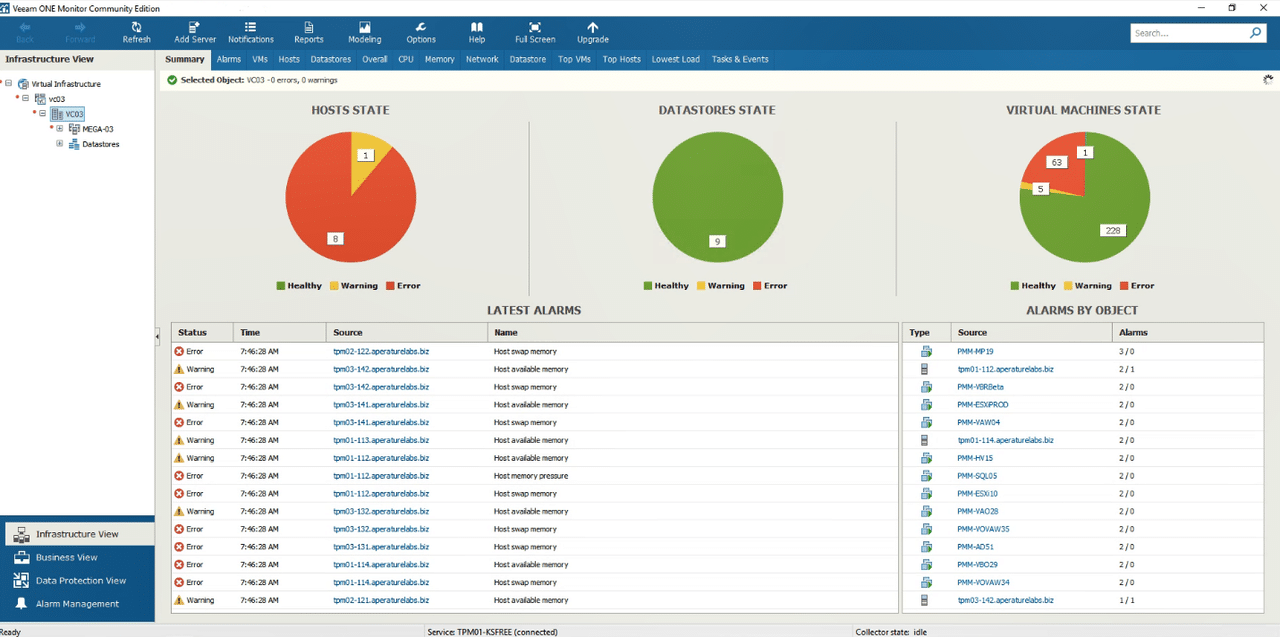
Veeam One is a network monitoring tool that monitors the performance of virtual machines in real-time. With Team One you can monitor VMware vSphere and Microsoft Hyper-V virtual machines through a range of dashboards. Dashboards come with views like heat maps, which show you how resource utilization is used.
The tool comes with over 200 alarms, which notify you when a virtual machine’s performance is failing. In addition, you can use Remediation Actions to automatically follow up with a response after an alarm. There are also intelligent diagnostics to help you discover and resolve issues like misconfigurations, which could affect performance.
There are four versions of the Universal License available to purchase: Veaam Backup Starter, Veeam Backup Essentials, Veeam Backup & Replication, and Veeam Availability Suite. Veeam Backup Starter costs $449 (£348) per year for 10-20 licenses. Veeam Backup Essentials starts at $899 (£696) per year for 10 licenses-50 licenses and additional features like analytics.
Veeam Backup & Replication costs $1,349 (£1,044) for 10-unlimited licenses. Veeam Availability Suite costs $1,687 (£1,305) for 10-unlimited licenses. You can download a free trial of Veeam One.
9. eG Enterprise
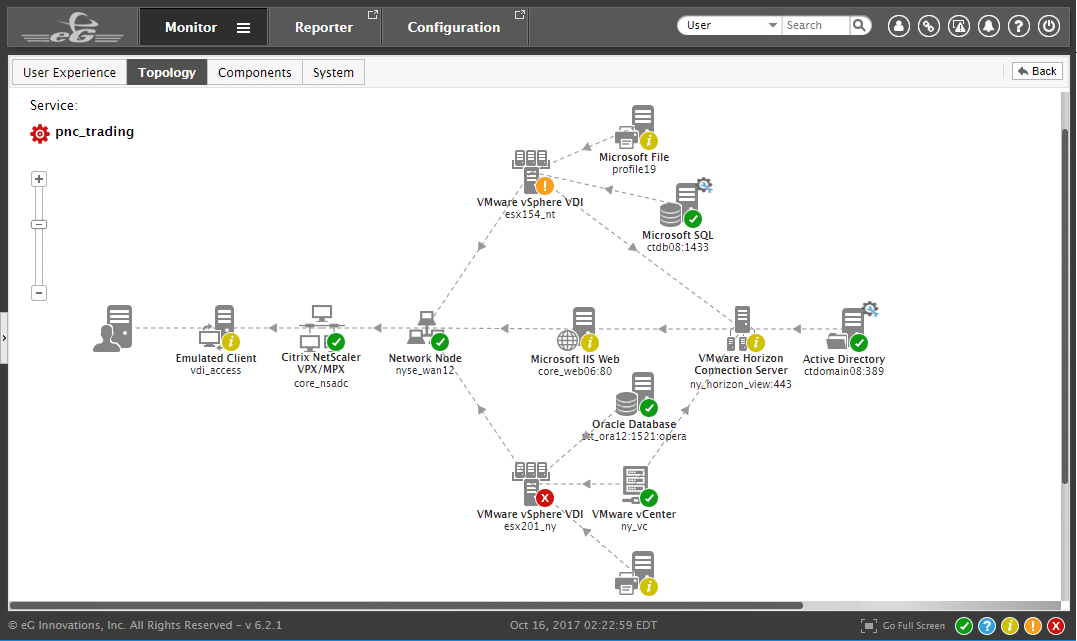
eG Enterprise is an infrastructure monitoring tool that enables the user to monitor the performance of virtual machines. With eG Enterprise the user can not only monitor the virtual machines but also the server as well.
The tool supports a range of top virtualization service providers including VMware vSphere, Microsoft Hyper-V, Citrix XenServer, Oracle VM Server, Red Hat Enterprise Virtualization, and more.
You can monitor virtual machines through the dashboard. eG Enterprise automatically discovers and maps VM dependencies. Mapping your physical and virtual environment makes it easier to diagnose the root cause of service disruptions and helps to find a solution.
eG Enterprise is ideal for SME’s who want an easy to use virtualization management tool. The software is available as a perpetual license, subscription, or SaaS version. There is a free version called Easy Evaluation, which comes at no charge for those monitoring up to five servers. You need to contact the company directly for a quote. You can download the free trial.
Use VM Monitoring Tools to Monitor Your Virtual Resources!
In organizations where virtual machines are used every day, VM monitoring tools are a necessity for maintaining your virtual infrastructure. VM monitoring software will help you to increase the visibility of performance degradation and improve the experience of your users.
For the smoothest experience, we recommend adopting tools that have an automated mapping feature. Automating mapping will show you how your physical and virtual resources connect together and help you when it comes to troubleshooting.


