Web analytic data can only go so far when it comes to seeing exactly how a user interacts with your site or application. These limitations can leave blind spots in your application management and overall site growth. In this article, we’ll look at a few different ways you can deploy real user monitoring, and review a few tools that help simplify the entire process.
What exactly is real user monitoring?
Real User Monitoring (RUM) is a method of performance monitoring that measures metrics such as load time, transaction path, and behavior automatically on a per user basis. This form of performance monitoring goes beyond what you can see in traditional tools such as Google Analytics or event logs and helps give you immediate feedback on issues that impact users.
Unlike feedback surveys, Real User Monitoring, or RUM, is a passive system that runs in the background. Rather than have developers or administrators comb through log files, RUM continuously monitors the application or site for problems, anomalous user behavior, and more. Additionally, you can configure your user monitoring alert when specific conditions are met, or thresholds are reached.
When you deploy real user monitoring you’re measuring real sessions with real humans behind them. This is in direct contrast to a similar form of performance monitoring called synthetic monitoring. Synthetic monitoring relies on scripts that mimic user behavior, but this is often ineffective as real users continuously find new and creative ways to get lost, stuck, or simplify find existing bugs.
In addition to finding bugs, real user monitoring can be used to collect data on exactly how your visitors interact with the site, what features they use the most, and what platforms they use to connect. This is useful not just for troubleshooting, but UX design as well. Neglected features from a site or app can be trimmed while places, where users are getting stuck, can be simplified and improved.
Why is real user monitoring important?
By using real user monitoring vs synthetic monitoring you’re leveraging real data generated from your actual users to identify issues and make improvements. By highlighting issues your users are facing in real-time you can quickly resolve issues and make changes that help avoid downtime and website bounces.
Looking through the lens of a webmaster, real user monitoring helps shine a light on not just visitor behavior, but also how search intent is met. As the main ranking factor, ensuring your site is meeting search intent is critical to ranking for keywords and topics.
Having the ability to see beyond just basic metrics gives you the upper hand in resolving issues faster, and creating a better user experience for your visitors than your competitors. Over time this can ultimately result in better ranking for the site, and even more sales when applied to landing pages.
If you’re responsible for meeting specific SLAs for your app or site, enabling a form of real user monitoring can help keep you ahead of the curve and give you the ability to avoid unexpected downtime by seeing problematic patterns before they cause bigger issues.
How does real user monitoring work?
A small lightweight script is embedded in each page of the site, or backend of the application. This script tracks and records behavior and metrics as the user moves through the site. As this data is collected it is reported back to the server for further analysis where this data can either automatically trigger an alert, be grouped together, or visualized across other data points.
As information pours in from each new user, the backend dashboard of the system will usually give at-a-glance insights into critical metrics such as page speeds, bounce rate, number of requests, and number of error codes generated. This data can come in waves, and the size of the information captured is closely related to the number of visitors your site receives, and how many metrics you currently track.
To better understand and act on real user monitoring data, information is often consolidated and put into charts, graphs, and other visualizations. This is key to understanding patterns like correlating specific traffic cycles and tracking issues across certain times of the day. Regardless if you spend time analyzing these patterns most real user monitoring tools have some form of automated alerts that will keep you informed of serious issues.
Some RUM tools offer in-depth data capture and replay, meaning you can recreate the session exactly as the user experienced it. This helps you go beyond just the data and actually experience the problems firsthand.
Challenges with real user monitoring
RUM isn’t an end-all solution for site management but is a great option to have in conjunction with your overall application management strategy. With that said, there are some limitations with real user monitoring you should be aware of, so you know exactly what it does, and doesn’t do.
- Real user monitoring is more effective with established sites. The more traffic it can analyze the larger of a set of data you have to work with. New websites that aren’t getting much traffic will likely not see the real benefits of RUM until a steady flow of visitors starts coming in. In this case, using synthetic monitoring in the early stages of your site would be a good idea. Alternatively, you could use paid advertising to drive traffic early while your RUM is in place to get a more accurate dataset early on.
- RUM does not give you insights into your competitors. Real user monitoring is strictly a reflective look at your site and its performance. There is no way to run these tests on competitors’ sites because they rely on tracking user behavior through scripts that are installed on the webpage themselves. SEMRush and Ahrefs have options where you can crawl a competitor’s site and view information such as error rate, page speed, and site structure.
- Real user monitoring requires large amounts of data. RUM is constantly pulling in site information every time a visitor visits a page or takes an action. While this amount of this information is necessary, it can overwhelm organizations that aren’t ready to store it and visualize it properly. For most RUM tools you’ll need to utilize flexible cloud storage to house the data or have a server on-premises with adequate drive space.
Using the right real user monitoring tools can make a huge difference. Since there are so much data collection and interpretation involved in a RUM tool, picking the right one is key for quick and painless deployment. Let’s review a few of the best real user monitoring tools on the market today.
Real user monitoring solutions
1. Site24x7 (FREE TRIAL)

Site24x7’s Real User Monitoring (RUM) shows businesses how websites and web applications perform for actual visitors rather than simulated ones. By collecting live interaction data, the platform reveals page load times, transaction behavior, and levels of engagement from the user side, giving teams a clearer basis for improving speed, stability, and overall satisfaction. That end-user perspective makes it easier to uncover issues that directly affect the experience delivered in production.
Key Features:
- Real-time user experience visibility
- Page load performance tracking
- Measurement of key performance indicators
- User path analysis
- Session replay
Why do we recommend it?
Site24x7 examines user experience across different device types and geographic regions, reporting performance at each stage of the journey. It shows how long pages take to become available, how quickly users can interact with elements, and where delays are introduced along the way. By expressing this data through standard performance measures, the platform helps administrators determine whether poor responsiveness comes from backend slowdowns, content delivery delays, or weaknesses in frontend design. That makes prioritization more practical when deciding where optimization work should begin.
It also breaks performance down by browser, operating system, and device, allowing teams to compare how different groups of users experience the same application. This is especially useful for organizations that need reliable cross-platform consistency. Metrics such as rendering time, session length, and browser-specific error rates, including data for browsers such as Chrome and Firefox, provide a clearer view of where performance differs between user environments.
The Real User Monitoring service operates alongside the rest of the Site24x7 platform, so website and application data can be viewed together with other monitoring results. It works in conjunction with synthetic monitoring, which measures performance under controlled test conditions. When those insights are combined with server and network monitoring, administrators are in a better position to troubleshoot effectively. The platform also makes it possible to relate backend performance indicators to what users are actually experiencing, which supports a broader optimization strategy.
Alerting is handled in real time, and the platform also includes a library of report templates to support analysis. Administrators can define thresholds for key indicators such as page load time and error rate, then route alerts through email, SMS, or other communication channels. That allows teams to intervene quickly before performance problems affect a larger portion of users.
Who is it recommended for?
Site24x7’s Real User Monitoring (RUM) is suited to businesses that need to improve web application performance and the quality of the user experience. It is relevant to ecommerce teams, digital marketers, user experience and interface specialists, IT administrators, and DevOps teams because it exposes user behavior, highlights performance constraints, and helps maintain responsive operation across browsers and devices.
Pros:
- Measures the real experience of live users
- Applies artificial intelligence to anomaly detection and early warning
- Connects easily with other tools
- Shows performance differences by geographic region
- Covers single-page application monitoring
Cons:
- Available only as part of the wider Site24x7 platform rather than as a standalone RUM product
The wider Site24x7 platform delivers monitoring across the full system estate. Pricing is structured to accommodate very small businesses as well as larger organizations, with the Infrastructure Monitoring edition starting at $9 per month. Higher-capacity plans cost more for larger environments. Businesses can review the package through a 30-day free trial.
EDITOR'S CHOICE
Site24x7 is our top pick for real user monitoring because it gives businesses a direct view of how people actually experience their websites and applications, while also providing the performance context needed to act on that information. The platform records live measurements such as page load times, session duration, error rates, and user interactions, making it easier to detect bottlenecks and identify where performance work will have the greatest effect. Because those measurements can be examined across browsers, devices, and locations, teams get a more precise understanding of how performance varies across their audience. A major strength of the service is that it works from real user activity rather than relying only on simulated tests, which produces a more grounded picture of what users encounter. Reports cover rendering speed, interaction behavior, and other aspects of page experience, helping teams see where friction is introduced. By organizing the results according to device type, browser, and location, the platform helps businesses direct optimization toward the user groups that matter most. The service also fits into the broader Site24x7 monitoring environment, where synthetic checks, server monitoring, and infrastructure data can be reviewed together. That makes it easier to connect user-facing symptoms with backend causes and improves both troubleshooting and root cause analysis. When thresholds are breached, configurable alerts notify teams immediately so corrective work can begin before the issue spreads more widely.
Download: Access a 30-day FREE Trial
Official Site: https://www.site24x7.com/signup.html?pack=44&l=en&lp=1
OS: Cloud-based
2. ManageEngine Applications Manager (FREE TRIAL)

ManageEngine Applications Manager is a robust solution that provides deeper insights into website performance and real user journey. It provides all details about your real users without compromising on the important technical details. One of the best features of this tool is that it provides complete visibility into the user’s journey and helps find issues before they impact end user performance.
Key Features
- Performance analysis and insights
- Comprehensive monitoring and visualization
- Script error detection
Why do we recommend it?
Applications Manager’s real user monitoring is recommended because it provides actionable and data-driven insights to businesses that help track issues faster and make informed decisions. Further, the tool provides complete visibility into web applications from a real user perspective, i.e., web core vitals status, response time, page views, etc.
Another big advantage that comes with this powerful tool is that it helps visualize how the website is performing across different countries and what areas need improvement or troubleshooting. You can even gain deeper insights into user sessions and identify the root cause of slowdowns. You can track the duration and quality of each session in real-time using this tool.
Who is it recommended for?
Small to large organizations that demand detailed insights into user sessions, user behavior, and other metrics must invest in this tool.
Pros:
- Provides real-time insights into website response time, user sessions, and other metrics.
- Detects web issues and troubleshoots them faster.
- Helps identify sluggish transactions immediately
Cons:
- Teams with less technical knowledge might find it a bit challenging or difficult to explore all the features in the beginning.
You can start by downloading the 30-day free trial.
3. ManageEngine ADManager Plus (FREE TRIAL)
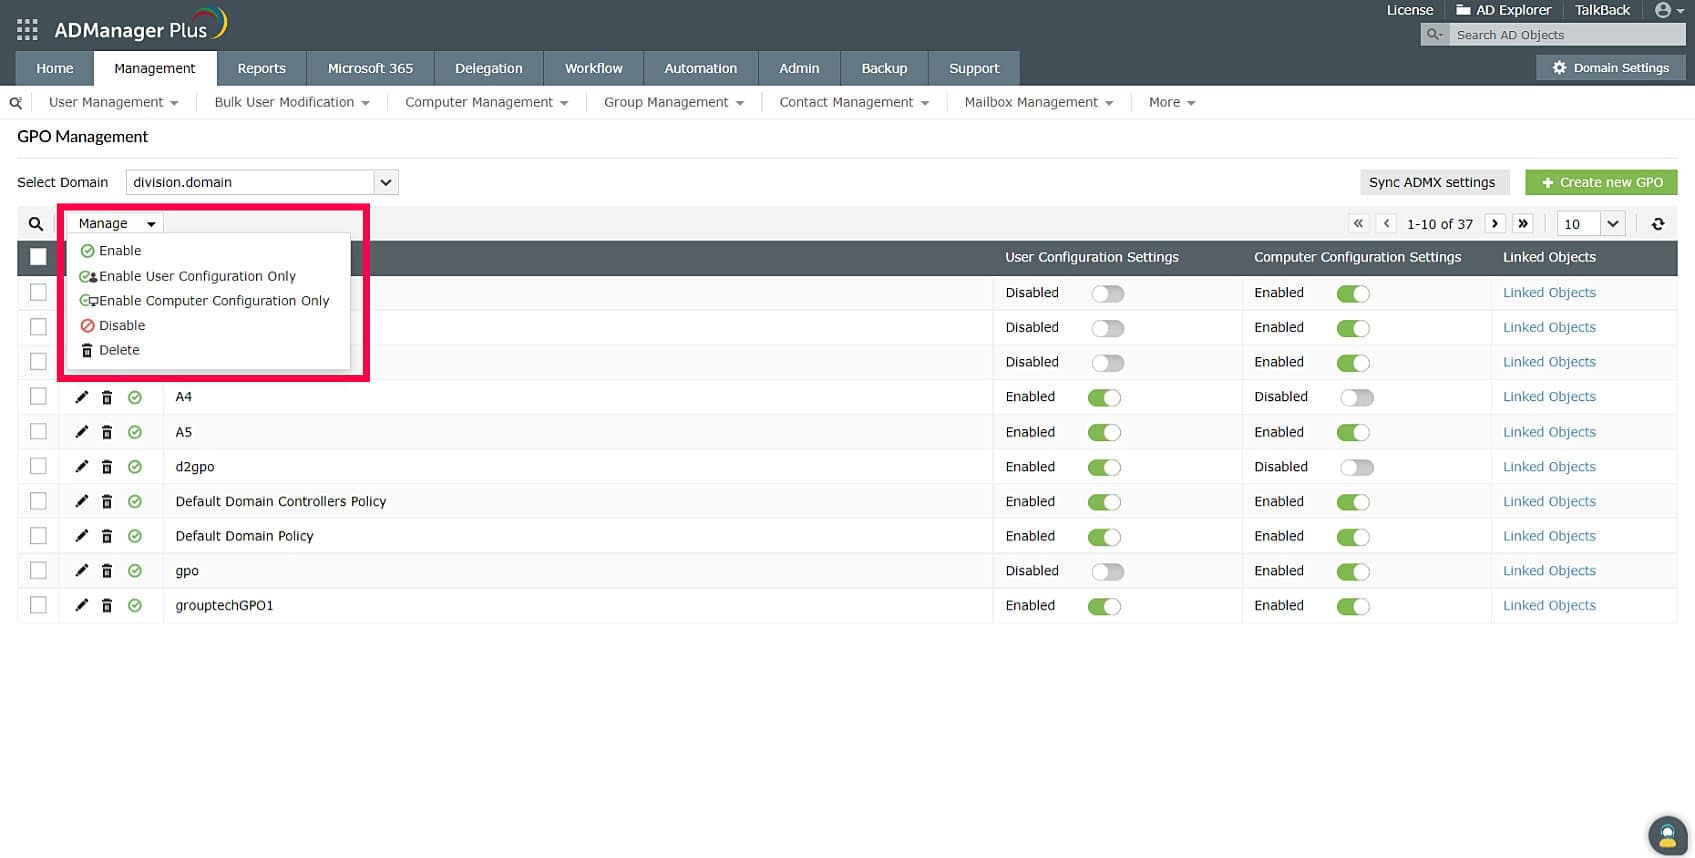
ManageEngine ADManager Plus is an identity management tool that streamlines the way users access resources on a system, eventually leading to a better user experience. At the same time, it also provides administrators with visibility and control over who accesses what within the organization and can ease the management of identities to improve security and compliance.
Key Features:
- Makes it easy to manage users, groups, and devices in an organization.
- Allows you to set, manage, and revoke permissions across files and folders to balance security with user experience.
Streamlines password management. - Generates extensive reports.
Why do we recommend it?
We recommend ManageEngine ADManager Plus because it provides clear control and visibility into permissions, resource usage, and more. As a result, users can have instant access to the resources they need, leading to improved user experience. Moreover, it streamlines authentication, enabling users to quickly complete their actions.
One aspect that we love about ADManager Plus is its extensive reporting capabilities. It comes with prebuilt templates that provide information about access control lists, NTFS permissions, logon details, password reports, and more. All these reports can provide detailed information about real user monitoring and their experience.
Who is it recommended for?
This tool is a good choice for organizations of all sizes that need detailed insights into what users are doing and how they are using the resources, and their experience.
Pros:
- Provides real-time data on user provisioning and access.
- Ensures that only authorized users can access a resource.
- Generates reports to help understand real user experience.
- Supports automation and workflows.
Cons:
- Some advanced features may have a learning curve.
Download a 30-day free trial to get started.
4. AppDynamics Browser RUM

AppDynamics Browser RUM provides a simplified way to visualize visitor information without stripping away any of the deep technical detail that is important to administrators. The software service uses a combination of visual charts and chronological logs to get a split view of visitor insights as they happen.
Key Features:
- Dynamic baselining
- Transaction correlation
- Backend and frontend monitoring
Why do we recommend it?
AppDynamics Browser RUM is recommended for its detailed real-time user insights, and its ability to correlate front-end user experiences with back-end processes.
Sessions can easily be displayed with a corresponding historical graph that shows the ebb and flow of site traffic along with the correlating browsers, operating systems, and regions. AppDynamics does one of the best jobs at providing a single pane of glass to track the customer journey throughout its time on your site.
When combined with AppDynamics APM, development teams will be able to automatically view transactions and tie them directly to back-end scripts and code. This process helps reduce the time spent on bug hunting by identifying exactly which line of code triggers a specific delay or event.
Alert templates play a huge role in the success of your RUM deployment, and AppDynamics knows this. Alerting is highly customizable and features dynamic baselines that use percentiles to keep your notifications consistent, even as traffic fluctuates. Lastly, to combat alert fatigue and false positives AppDynamics Browser RUM have built-in anomaly direction and intelligent alerting.
Who is it recommended for?
It’s best suited for organizations that require in-depth monitoring of user sessions, and for teams that need to tie user experience directly to backend scripts and code.
Pros:
- Customizable alerting with dynamic baselines.
- Deep technical detail coupled with visual representations.
- Integration with AppDynamics APM for complete monitoring.
Cons:
- Pricing is only available upon request, which may not suit all budgets.
- The level of detail may be overwhelming for smaller or less technical teams.
AppDynamics features two versions of real user monitoring products, RUM Pro and RUM Peak. With RUM Peak you’ll gain access to AppDynamics Query Language (ADQL) for quicker data analysis, better visualizations, and deeper business performance correlation.
Currently, pricing is only available upon request. A free 15-day trial of AppDynamics Browser RUM is available before purchase.
5. Dynatrace RUM
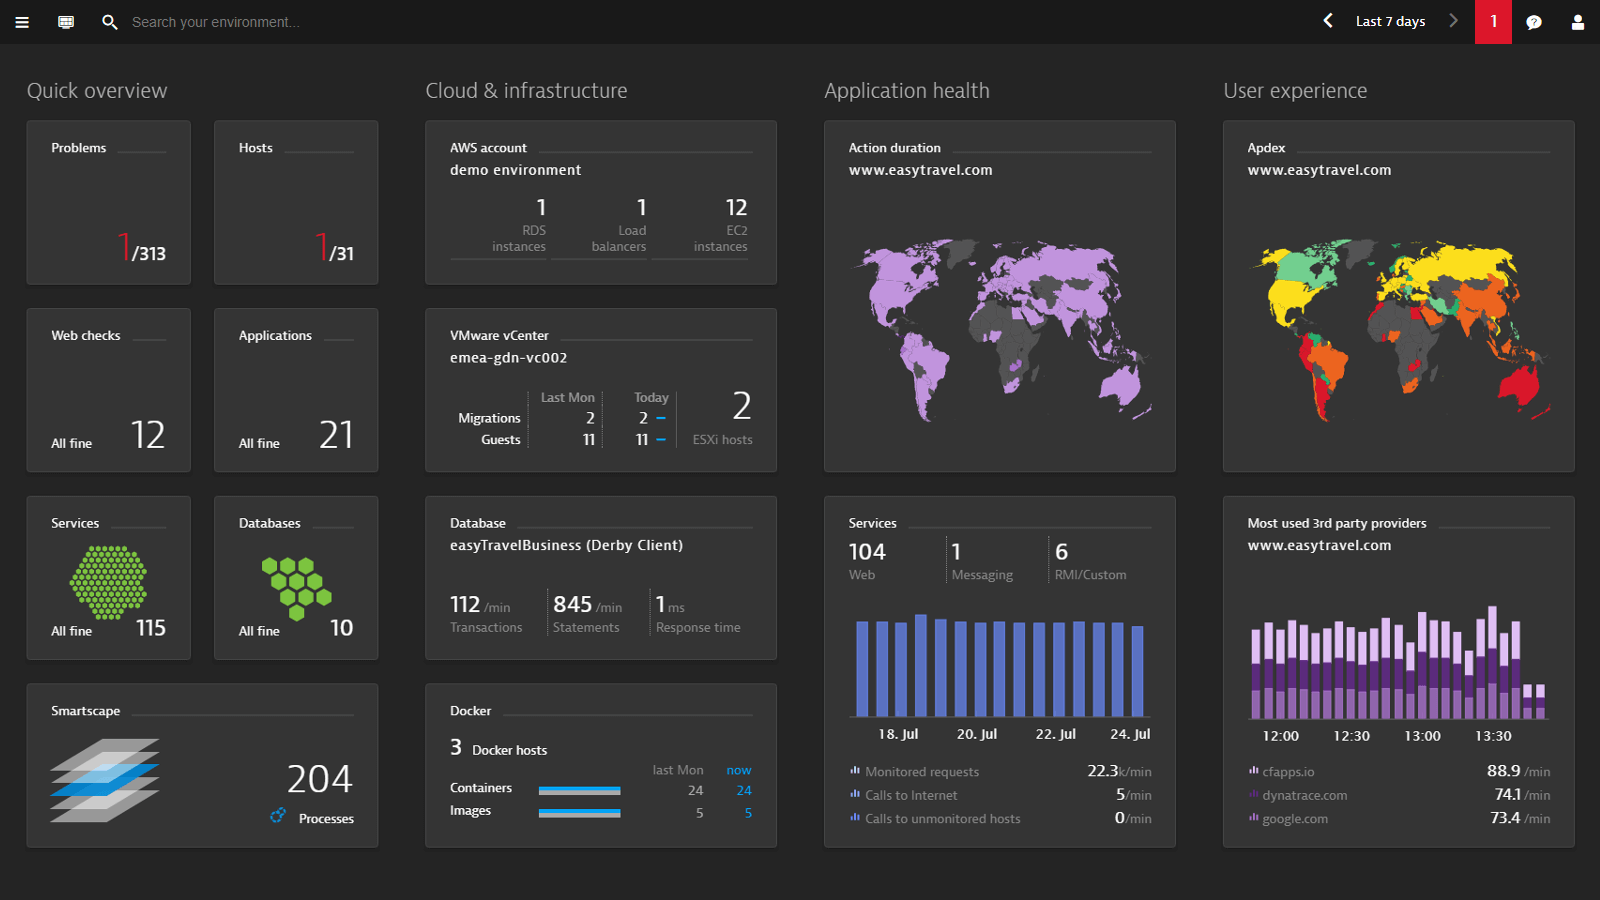
Dynatrace Real User Monitoring provides a comprehensive look at the visitor’s experience on both the front and back end. Using a minimalistic design, Dynatrace brings key performance indicators and alerts directly to you or your team’s attention without distraction or noise. Much of the platform is positioned to tie performance metrics and relate them to business outcomes and IT objectives, making this a solid tool for well-established companies.
Key Features:
- Root cause analysis
- Intelligent alerting
- Proactive outreach
Why do we recommend it?
Dynatrace RUM is recommended for its AI-driven root cause analysis and proactive outreach capabilities, making it a robust tool for managing user experience and business outcomes.
One of the standout features in Dynatrace is its root cause analysis. Leveraging artificial intelligence, the platform is able to analyze problems and identify exactly where devs should start looking to solve an issue. This, in turn, generates fewer alerts and gives technicians a clear picture as to what the impact was, and where to start looking for a resolution.
Another excellent feature is the ability to turn on proactive outreach. If your service or site begins to experience issues, you can have Dynatrace proactively contact customers and let them know there are issues that are being worked on. This helps keep communication transparent and helps eliminate poor reviews.
Outside of top-level insights, Dynatrace has an in-depth waterfall analysis report that breaks downtime on page, time to first byte, session time, and other vital information that helps paint the picture of how your site is performing. This is done primarily through a visually complete timeline that shows exactly when a visitor initiated a session when elements loaded, and every action that was taken along the way. This helps not only solve technical issues but can help influence UX design decisions for future changes.
Who is it recommended for?
Ideal for well-established companies looking to tie performance metrics closely with business outcomes and IT objectives.
Pros:
- Minimalistic design focusing on key performance indicators.
- Proactive outreach feature for customer communication.
- In-depth waterfall analysis for detailed performance insights.
Cons:
- Pricing model based on monitoring units may be complex to understand.
- Might be more than needed for simple user monitoring needs.
Pricing starts at $11.00 a month when billed annually and gives you 10,000 Digital Experience Monitoring Units. These units are essentially credits that get used as you track KPIs across your traffic. You can get started with Dynatrace through a free 15-day trial.
6. Pingdom
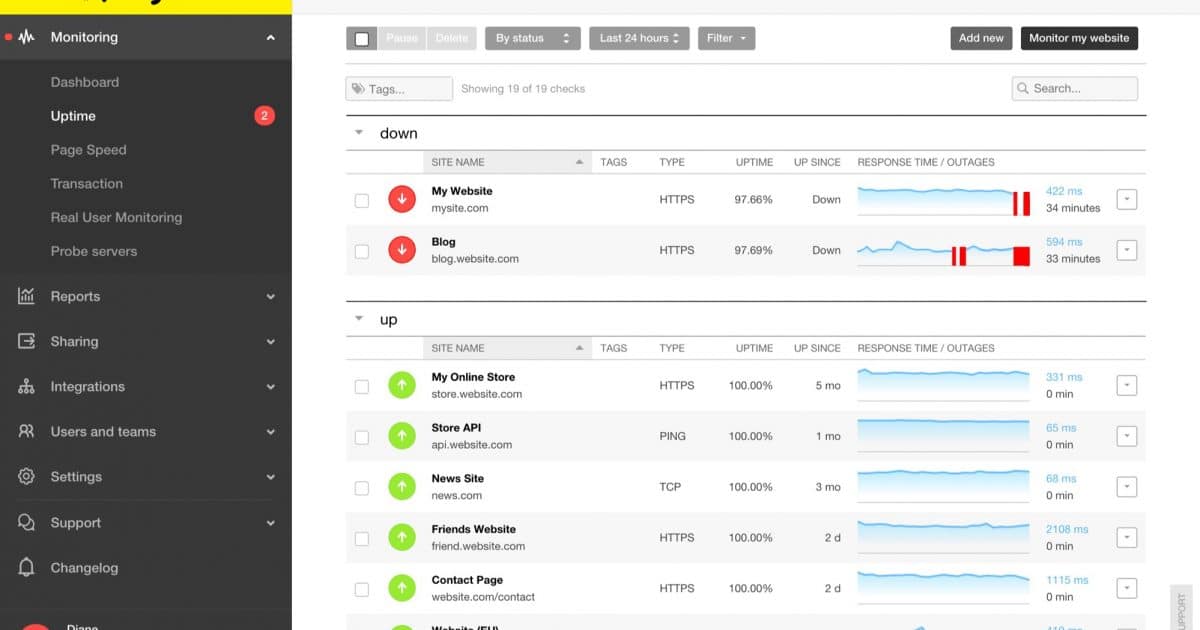
Pingdom uses a combination of real user monitoring and synthetic transaction monitoring to give you a holistic view of your site performance both through insights and visual heatmaps. To aid with clients’ side problems Pingdom uses a simple yet intuitive centralized dashboard to give administrators an at-a-glance view of the health of their website based on real user metrics.
Key Features:
- Flexible pricing
- RUM and synthetic monitoring
- SLA monitoring
Why do we recommend it?
Pingdom is highly recommended for its comprehensive monitoring capabilities, combining real user and synthetic transaction monitoring, providing detailed insights into website performance.
Active sessions, load times, bounce rates, and apdex score changes all populations live through customizable widgets that allow you to cycle through and view whatever metrics are important to you. For websites with a wide global audience, Pingdom maps out each country and can easily show which regions are struggling to load pages, view content, or perform specific actions.
Deployment of Pingdom is simple and starts with adding a small snippet of code to the header of your website. Within just a few minutes data will begin populating into your dashboard for instant feedback. As more data populates, Pingdom advanced filtering can take you from a top-level perspective to a drilled-down detailed report of exactly what elements impacting performance.
On top of built-in troubleshooting tools, Pingdom allows its users to create SLAs for specific metrics across your site. You can set targets as broad as page load times or as detailed as measuring the time it takes for the first element to load. This range in flexibility makes Pingdom a great option for both those who run smaller sites, as well as established sites with teams of developers.
You can easily track the long-term performance of your assets on a monthly or yearly basis through the Experience Monitoring tab. This helps give you both visual and quantitative feedback on how your page speed, traffic, and bounce rates have improved over time. You can also start to identify emerging trends such as traffic sources from different geographical areas, and trends in which browsers are being used the most.
Whether you use Pingdom to provide a managed service, or just use it internally, the software features a host of different reports that can benefit everyone from C-level and down. Reports can be customized much like the central console, and feature nested menus that can help shed light on the performance of multiple websites as a whole.
Who is it recommended for?
It’s ideal for administrators who need a holistic view of their site’s health, from page load times to global user experience, and is suitable for both small and larger websites.
Pros:
- Intuitive dashboard with customizable widgets.
- Easy deployment with a simple code snippet.
- SLA monitoring for specific site metrics.
- Long-term performance tracking and trend analysis.
Cons:
- Takes time to explore all platform features.
Pingdom offers their RUM service and Synthetic Monitoring as two separate packages both starting at $10.00 (£7.31) per month. Pingdom offers a 30-day trial before purchase.
7. Retrace RUM

Retrace offers a suite of monitoring technologies, including a real user monitoring tool that enables developers to capture behavior on both the front and back ends of the transaction. The platform is designed to offer a more complete Application Performance Monitoring (APM) package of tools, with real user monitoring being a newer part of that.
Key Features:
- Combined RUM and APM
- Breakdown of each request
- Front and back end visibility
Why do we recommend it?
Retrace RUM is recommended for its comprehensive approach to Application Performance Monitoring (APM), including detailed real user monitoring.
Enabling RUM in Retrace is simple, and requires a single snippet of JavaScript code to be placed in the headers of each page you wish to track. After the code is in place, and the Retrace Profiler is installed, your dashboard will begin populating new user insights and metrics.
The dashboard favors a more technical perspective as it uses fewer visualizations and more direct statistics. This is good news for developers who would prefer more detail over a cleaner-looking interface. Every transaction that is captured shows both the front and back ends of the visitor’s journey.
The traffic capture sections make it easy to cycle through and review metrics like server requests, tracked functions, and view every individual GET request and server response along the way. Metrics captured can be quickly segmented based on locations, device type, and browser, to help plan out avenues for optimization and even map out ideal places for new CDN hosts.
The platform really looks to combine the RUM and APM toolsets under one roof with Retrace, which makes this an easy winner if you’re already in the market for additional APM tools. Even with this being a hybrid tool you’ll still have full control with customizable dashboards, detailed alerting, and flexible error logs and reporting.
Who is it recommended for?
It’s suitable for developers and teams looking for an in-depth technical perspective on user behavior, both front-end and back-end.
Pros:
- Combines RUM with APM for a holistic view.
- Detailed breakdown of each request and response.
- Customizable dashboards and alerting options.
Cons:
- The interface may be too technical for non-developer users.
- Pricing tiers may be expensive for smaller businesses.
Retrace comes in three pricing tiers, starting with Essentials at $99.00 (£72.86) per month. Each additional tier offers a higher amount of traces, logs, servers, and a deeper level of data retention. You can save 20% through annual billing and a full 14-day trial of Retrace is available prior to purchase.
Which Real User Monitoring tool is right for you?
We’ve narrowed it down to seven tools, and the right choice depends on your environment. Site24x7, ManageEngine Applications Manager, and ManageEngine ADManager Plus cover a range of needs from general availability and performance monitoring through to application-level visibility and Active Directory management, so these are sensible places to start your evaluation.
AppDynamics Browser RUM combines real user monitoring with useful troubleshooting capabilities, helping teams trace slowdowns from the browser back through the application stack.
Pingdom remains a lightweight option with straightforward pricing, while Dynatrace RUM and Retrace RUM focus more on advanced analytics and closer integration with broader observability platforms.