With limited resources and increasing demands from users, managing a MySQL environment can feel like an endless to-do list. Luckily with the right MySQL monitoring tools, you can proactively stop problems before they start.
Here’s our list of the best MySQL Monitoring Tools:
- Paessler PRTG MySQL Monitor EDITOR’S CHOICE In-depth MySQL monitoring with the ability to expand your monitors into other servers. Get a 30-day free trial.
- ManageEngine Application Manager (FREE TRIAL) A monitoring and management system that supervises databases, web applications, and other services. Installs on Windows Server and Linux. Access a 30-day free trial.
- Site24x7 Infrastructure (FREE TRIAL) This server and services monitor is based in the cloud and includes MySQL monitoring. Get a 30-day free trial.
- Datadog SQL Monitoring Uses autodetection and automation to help identify MySQL problems before they create alerts.
- AppDynamics MySQL Performance Monitoring A holistic application monitor that features sensors for MySQL as well as over a dozen other services.
- Idera SQL Diagnostic Manager for MySQL A diagnostic tool for MySQL that can also be used to monitor databases. Available for Windows, Windows Server and Linux.
- SolarWinds Database Performance Monitor Best all-around SQL monitoring tool for medium-sized dev teams and IT departments.
- Red-Gate SQL Monitor Creates a ‘single pane’ environment where all data can be monitored from one screen.
- SpiceWorks SQL Server Monitoring Free bare-bones MySQL monitor ideal for home networks.
- Navicat SQL Monitor Uses a clean UI that is best for businesses with multiple databases.
- Nagios MySQL Monitoring A straightforward MySQL monitor with basic features and no-frills.
The Best MySQL Monitoring Tools
1. Paessler PRTG MySQL Monitor (FREE TRIAL)
The MySQL monitoring function with PRTG is part of a larger product called PRTG Network Monitor. The Paessler PRTG Network Monitor aims to monitor and manage everything from MySQL databases to Windows virtual servers.
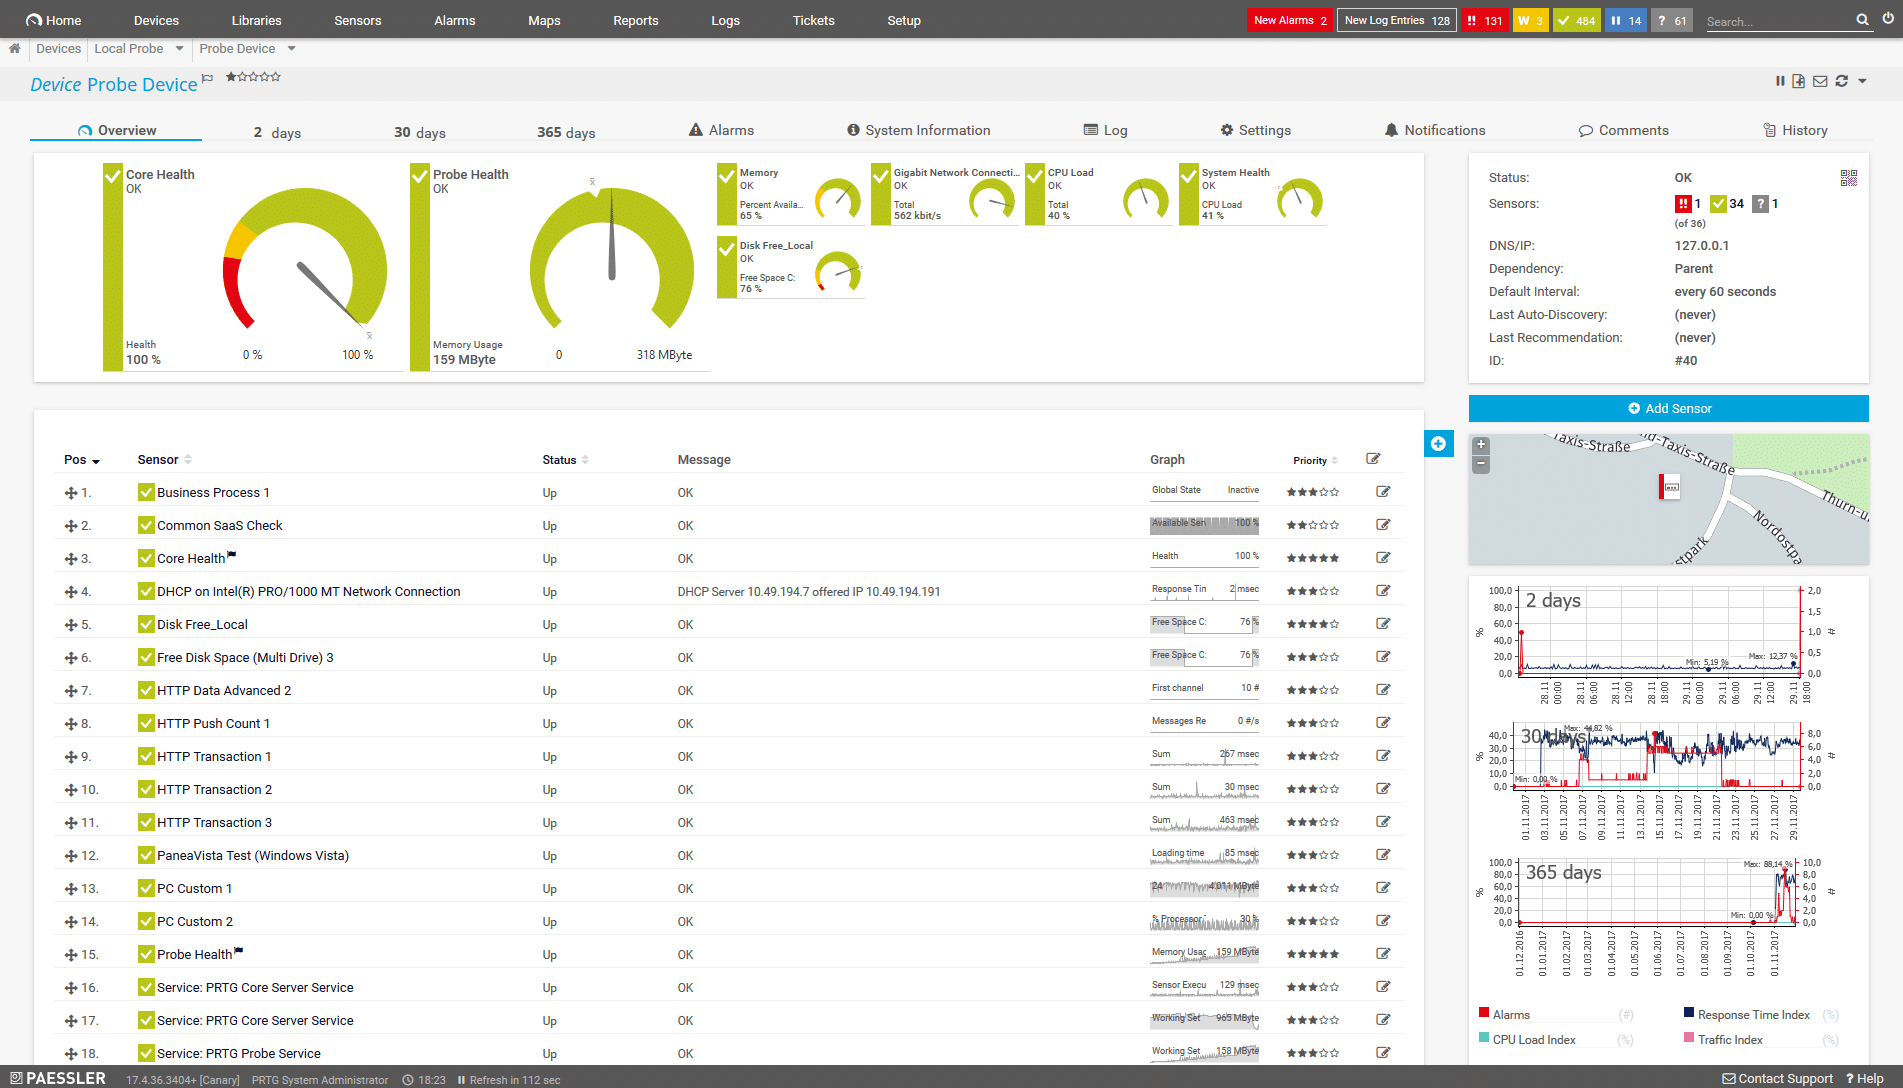
While PRTG has much coverage, it can effectively monitor MySQL via its updated MySQL v2 sensor. This sensor comes in the form of a lightweight software agent that relies on .NET to function on the target system. This data can then be queried and interpreted via the PRTG dashboard. While the setup process isn’t as streamlined as DPM, the MySQL Monitor is still a strong candidate for the best MySQL monitoring tool.
PRTG’s dashboard is simple and customizable. Through module dashboards, you can prioritize metrics that are more important to your dev team, like response time and the number of connections. Different dashboards can be set and even cycled through to monitor the overall health of multiple applications or sites. Customizing a view is as easy as entering a query and selecting to monitor their output values.
When things do go wrong, you can configure alerts to be triggered based on specific conditions, return values, or thresholds. PRTG offers a wide variety of alerting options including SMS, email or push notification to your phone. If you have a SIEM or other system your organization uses alerts can be ported over the PRTG API for further customization.
If a repeat issue arises you can opt to have a script executed to correct an alert rather than create a ticket or alert with your helpdesk. Through testing, it was nice to see that PRTG alerts can be tuned in a way that avoids false positives and repeat alerts relatively easily.
Outside of live dashboards reporting can also be configured through a few simple steps. PRTG really focuses on automating the report feature so you can get back to administrating your MySQL environment. In the reporting dashboard templates can be built that include custom insights. This ensures the marketing department gets the data that’s relevant to them, and your team gets the stats that are relevant to their work.
Paessler PRTG pricing is tied to the number of sensors you have deployed. Currently, all pricing tiers offer perpetual licensing, with their lowest tier allowing for 500 sensors active for $1750 (£1353.97). You can test out the PRTG MySQL sensor for free through a 30-day trial.
2. ManageEngine Application Manager (FREE TRIAL)
ManageEngine Applications Manager monitors a range of applications and services that support user-facing software. Among those services covered by this monitoring tool are database management systems. The Applications Manager has specialized routines and screen for monitoring MySQL databases and it also has the capability to monitor other DBMSs, including SQL Server, Oracle, Informix, DB2, PostgreSQL, and Sybase.
The monitoring services of Applications Manager track all of the supporting infrastructure for a database, such as the CPU, memory, and disk capacity and availability of the host. It also records the effects of the DBMS on these resources, looking at whether services will run out of space given the DBMSs trend of needs. The operations of each MySQL database instance are also tracked, including memory utilization, processes, disk interactions, and response times.
The system console for Applications Manager includes a database performance summary screen for all MySQL instances. This summary gives access through a drill-down mechanism to statuses of individual instances. Each screen displays live performance statistics on the operations of all MySQL databases and the supporting infrastructure. It also supervises administrative tasks, such as replication and backup processes.
Performance analysis features in the Applications Manager MySQL screens highlight problems with the implementation of database structures and queries. Inefficient joins and coding errors are highlighted and regular queries are monitored to assess better supporting structure. For example, the system can recommend better indexing and reorganized joins that will hit them. Other changes to the database’s object will be indicated by the database analyzer. Usage analysis includes capacity requirements planning for trend growth rates in tablespace and processing needs.
Any metric that the Applications Manager monitors has a performance threshold available. These levels can be tweaked by the administrator and they give operations staff a warning if resources run short or if queries take a long time to run. These alerts are shown in the system dashboard as alerts. They can also be forwarded to key team members through email or SMS.
ManageEngine Applications Manager installs on Windows Server and Linux. This package is available in three editions: Free, Professional, and Enterprise. The Free edition is limited to monitoring five applications. The full paid system is available for a 30-day free trial. If you choose not to buy at the end of that trial, your software will switch to the free edition.
3. Site24x7 Infrastructure (FREE TRIAL)

Site24x7 Infrastructure is a server monitoring system that can be tailored by the activation of integrations that add on specialist monitoring capabilities for a list of 100 products and MySQL is one of those.
Site24x7 is a cloud-based platform of systems monitoring and management tools. The Infrastructure module can work as a standalone tool or in concert with other modules to create a wider monitoring service. The MySQL monitoring integration is also available in the Site24x7 All-in-one plan, which covers networks, servers, and applications.
The Site24x7 stable includes an application performance monitor. While MySQL is an application, the MySQL integration is available for the Infrastructure plan. A paid add-on to Infrastructure is the Site24x7 network monitoring tool, With the full complement of add-ons, the Infrastructure plan becomes very similar to the All-in-one plan. The Infrastructure module with the MySQL integration examines the functions of all MySQL instances enrolled in the monitoring system all the way down to the operating system of the servers. The tool can track databases resident on Windows Server, Linux, and cloud systems, such as AWS and Azure.
The MySQL monitor tracks performance within the database in two ways. It measures the performance of each transaction executed in the instance and it also examines the efficiency of SQL in exploiting the services of the database system, such as join efficiency and whether indexes are hit.
Query inefficiency is a contained problem. However, poor transaction performance can be caused by one of many different factors or even combinations of factors. The visibility of the Infrastructure system with the MySQL integration is able to examine the activation of services, such as cache usage, paging, and I/O actions.
Carrying on down the stack, the Infrastructure module can look beneath the DBMS to identify the server resources that support those database transactions. Servers have a finite capacity of memory, processors, and disk space. The MySQL instances have to share those resources and if one of those services is running out of room.
Site24x7 uses an alerting system to draw the attention of technicians to evolving problems. It also offers visualizations of the chain of dependency that leads from MySQL databases down to the operating system.
The Site24x7 system is charged for by subscription. The IT manager looking for a MySQL monitor should examine the opportunities of the Infrastructure module or consider the larger All-in-one package. You can try Site24x7 Infrastructure with a 30-day free trial.
4. Datadog SQL Monitoring

Datadog certainly isn’t a mutt among this list of best SQL monitoring tools. While the Datadog brand may be newer to the application monitoring scene, that doesn’t hinder its ability to provide quick insights and automated fixes to MySQL devs.
Like PRTG, Datadog can monitor a multitude of servers and applications but has a specifically configured agent to monitor SQL servers. At this time, the SQL monitoring agent is only available for Windows operating systems. After being installed on the SQL host through a few short commands, the agent will instantly begin pulling data back into the Datadog dashboard.
While you can fully customize Datadog’s dashboards, there are two out-of-the-box views you can use right away to start tracking performance. With the ease of drag and drop modular displays, you can stack and compare metrics like batch requests and SQL complications side by side to compare these numbers at a glance.
When it comes to proactive alerting, Datadog goes above and beyond most modern MySQL monitoring tools. Leveraging anomaly detection, forecasting, composite alerting, and outlier detection to ensure the right people are notified at the right time. These features are all rolled together into a system called Watchdog.
This auto-detection engine constantly monitors your databases and servers for tough to spot problems like latency creep in your microservices, and data drift. One of the best parts of Watchdog is that it works without any additional configuration needed.
All of this information is made available through real-time alerts, or can also be reviewed through what Datadog dubs as ‘stories.’ Stories are streams of chartered information that combine real-time and past events into an easy to navigate module.
Watchdog reads between the lines for you and can let you know if latency has been on the uptrend this week, or if a specific query has been returning data slower than usual. These at-a-glance insights summaries help you or your team make decisions quickly and with confidence.
Pricing for Datadog will vary depending on what service you wish to use. APM and distributed tracing start at $31.00 per host, per month when billed annually with volume discounts available for 500+ hosts.
If you want to test out Datadog for yourself, you can take advantage of its free 14-day trial.
5. AppDynamics MySQL Performance Monitoring

AppDynamics is a Cisco company that offers application management as well as MySQL performance monitoring. Through agentless monitoring architecture, AppDynamics can measure the performance of your MySQL environment without risking the deployment of agents and software directly on your database servers.
Data can be displayed and organized by application, database, or query, and arranged on a customized dashboard for monitoring. Metrics can be tracked and charted across five-minute intervals with built-in features to measure custom KPIs and display delta graphics of any MySQL server across your environment.
The AppDynamics dashboard does an exceptional job at transitioning from top-level insights to more granular details. In one click you can quickly view SQL statements as well as the SQL execution plan. MySQL objects can also be categorized with full visibility into the objects’ configuration values and properties.
While AppDynamics automated features aren’t as intuitive as DataDog, they’re still a competitive option and deserve a spot amongst the best MySQL monitoring tools. While publicly available pricing isn’t available, recent estimates put the yearly cost for 1-10 units at about $3300.00 (£2554.87) per unit, per year. For the most accurate pricing, you can contact the AppDynamics sales team. You can also try out AppDynamics SQL Monitoring for yourself for free through a 15-day free trial.
6. Idera SQL Diagnostic Manager for MySQL
Idera SQL Diagnostic Manager for MySQL is a monitoring and database management tool for a range of DBMSs. As the name suggests, the main purpose of the diagnostic system is to assist in the optimization of queries and database structures for MySQL databases. However, it is also able to manage MariaDB, Aurora, Azure Database for MySQL, Amazon RDS, Google Cloud SQL for MySQL and Oracle Cloud MySQL Cloud Service databases.
The Idera package is a system that needs to be installed on one of your servers – there isn’t a cloud SaaS version. You can monitor databases with this system, even though it is named as a diagnostic tool. The system allows for automated monitoring by including an alerting system. This mans that you can leave the package to monitor databases and get on with other tasks. You will be drawn back to the system console if you receive an alert notification.
This tool is particularly useful for tracking events during system maintenance tasks, such as backup, resizing, or replication. These types of tasks need to be conducted out of business hours when the database is not serving users. The system collects and stores database logs. It also records error conditions and system failures. So, a DBA, arriving into work in the morning, can use the tool to check for the success or failure of overnight jobs.
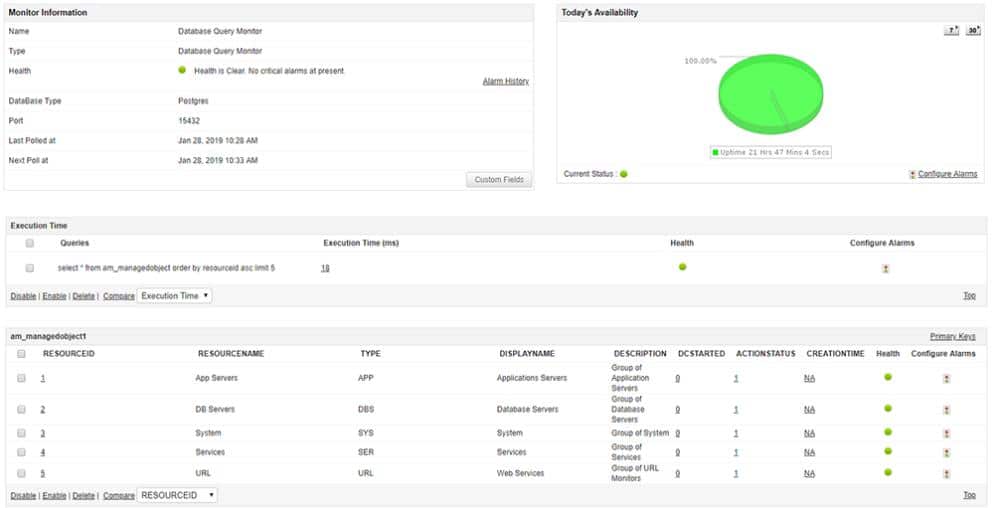
When an administrator is alerted to gathering problems, live data shown in the dashboard helps with problem identification and the creation of solutions. Performance data is aggregated on the Home screen of the dashboard and the user can then drill down to examine data for individual instances. The screens for instance performance also leads through to the diagnostics tools in the Idera package.
Diagnostic features in this system allows an administrator or a developer to run a query in a database and see what database objects it touches. The dashboard also shows the levels of system resources while the query executes. This allows an SQL query to be analyzed for optimization. The investigation might lead to the addition or adjustment of database objects, such as indexes.
offers real-time monitoring of MySQL databases as a basis for its analysis tools. These offer an opportunity to step through each transaction and look at how it hits database objects and system resources.
Idera SQL Diagnostic Manager for MySQL runs on Windows, Windows Server and Linux. Get access to a 14-day free trial.
7. SolarWinds Database Performance Monitor
SolarWinds Database Performance Monitor (DPM) is a dedicated platform built specifically to monitor database performance, detect and alert to SQL issues, and proactively perform database maintenance tasks.
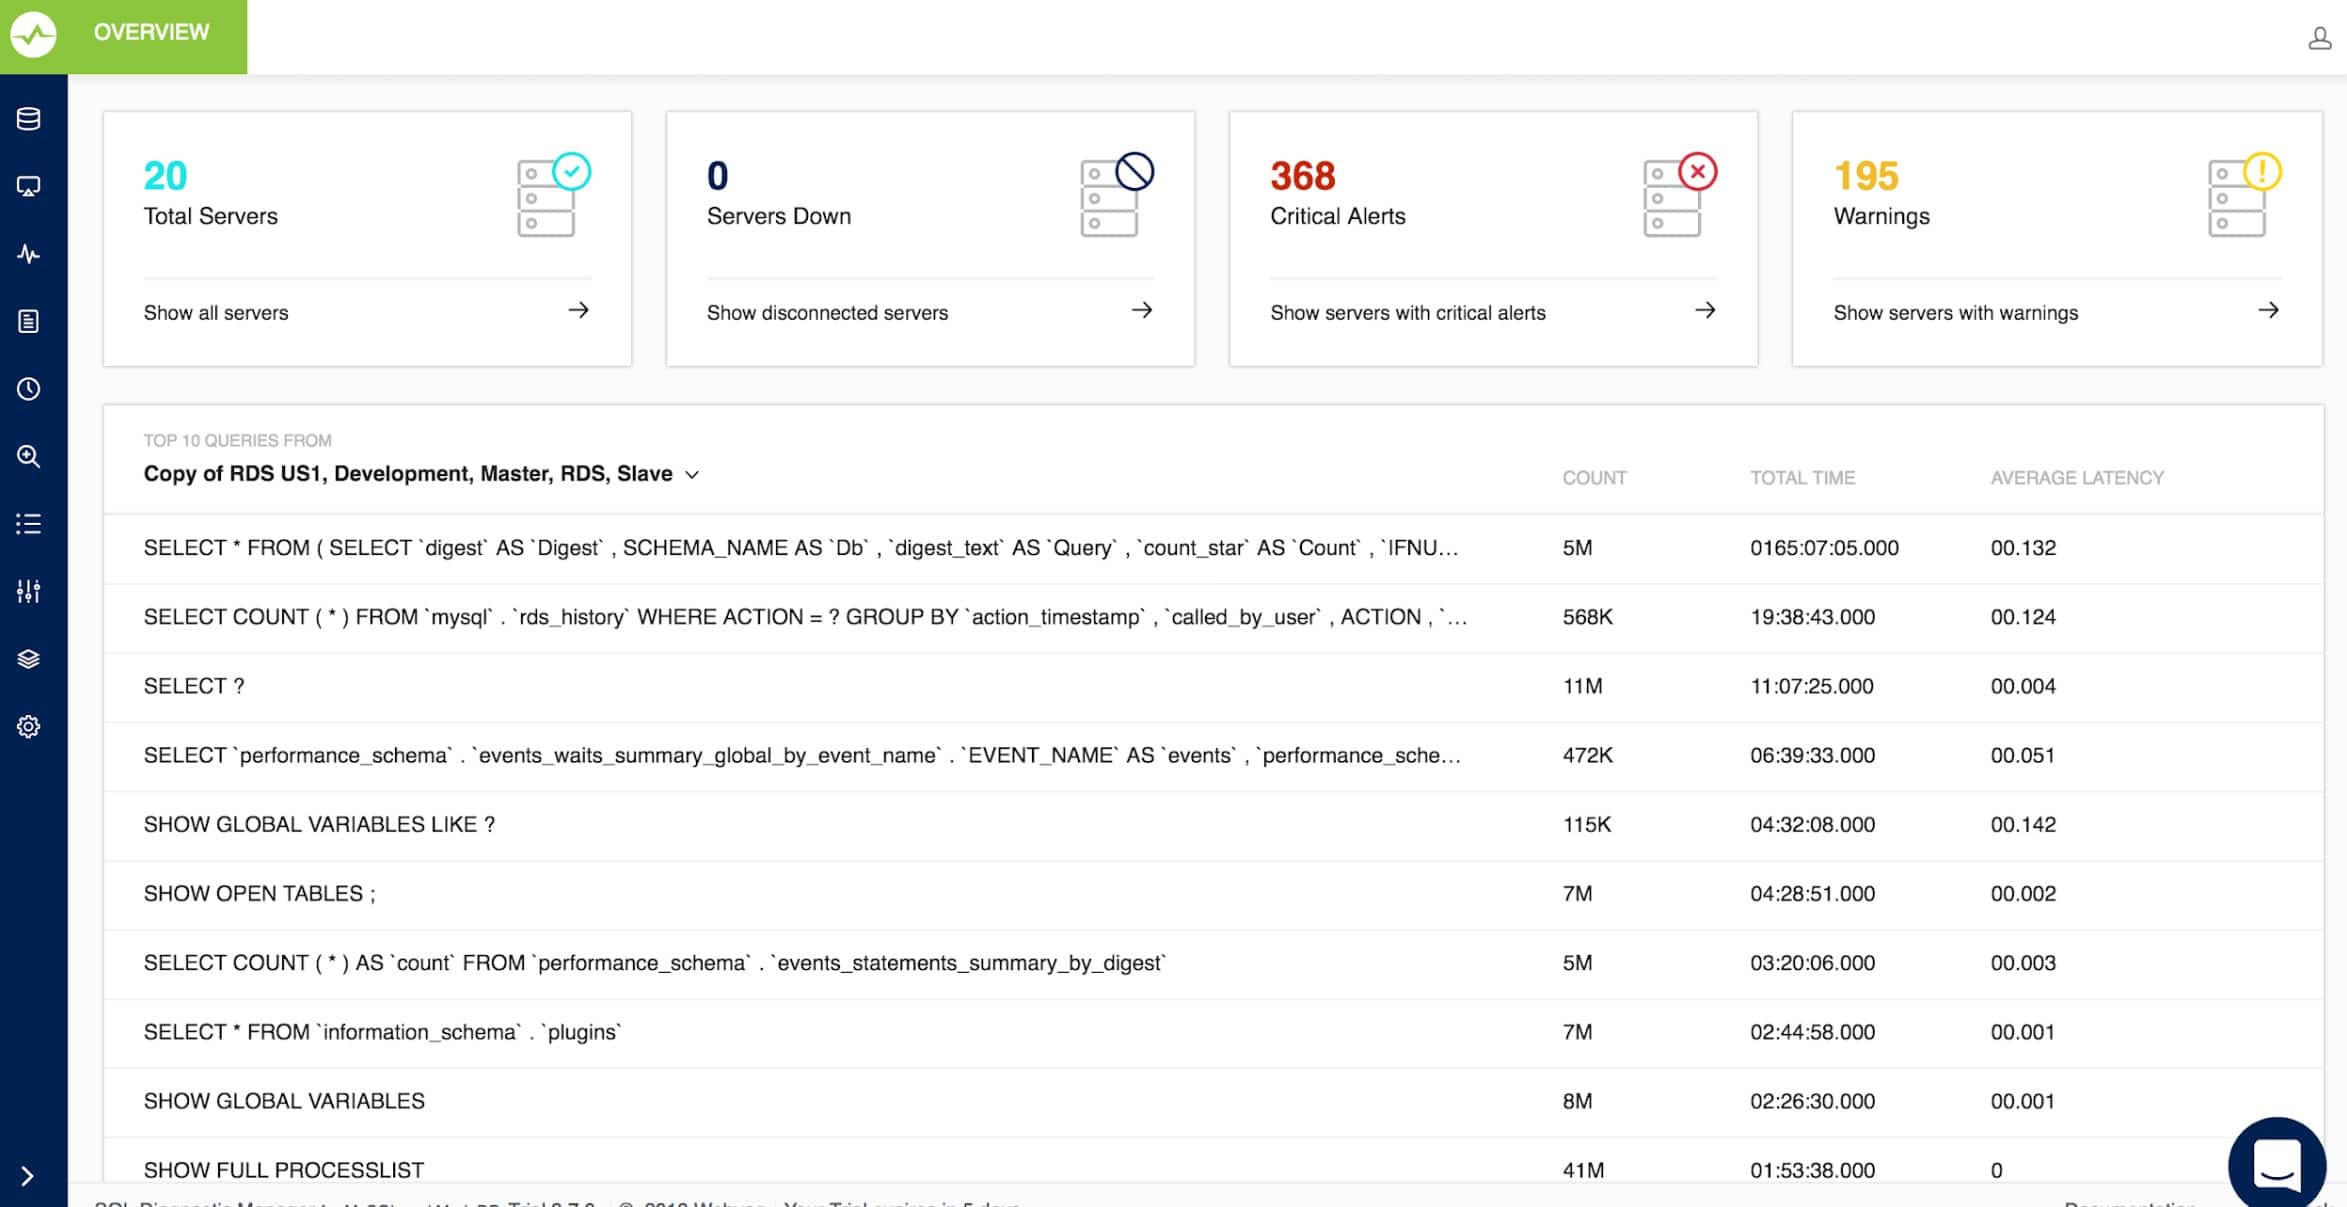
Rather than having to dig through logs, DPM provides out of the box health reports and charts that bring the most critical issues to the forefront. A simple health report summary breaks down error rate, concurrency, throughput, and latency into swim-lanes that give you a balanced look at your recent and real-time metrics. DPM uses a lightweight agent to monitor each database and can pull insights from MySQL environments that are in the cloud, on-premises, or in a hybrid configuration.
The Top Queries section provides a top-down level view of all current processes and allows you to drill down into specific metrics like wait times, or hung queries. This quick view dashboard helps immediately give context to issues your helpdesk is likely already receiving tickets for.
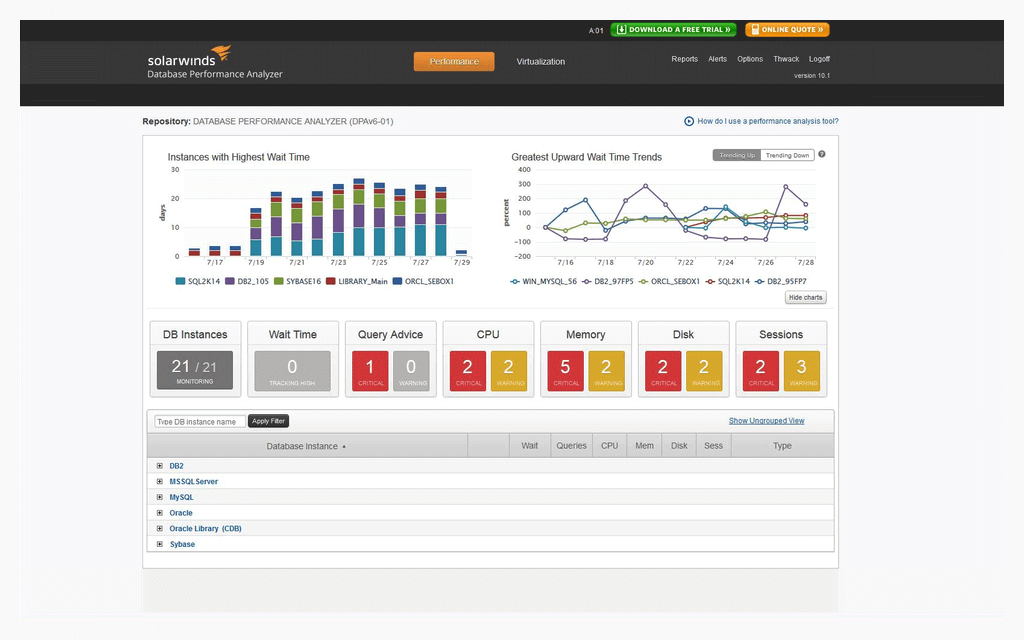
On the proactive side, DPM can be used by admins or DevOps teams to see problems in the making, before they impact performance. This is done through both automated and manual behavior analysis tools, which identifies not just errors, but anomalies from your historic baseline. Snippets of past data can even be compared against new timelines to measure performance before and after a change was made.
Impressively, Database Performance Monitor takes this a step further by creating a mock test environment based on metrics from your live network. This lets engineers test their changes in a safe and realistic setting so they can be confident when publishing code.
The DPM tool was built with team collaboration in mind and features multiple ways to share information across your environment. Live dashboards can be shared and key focus areas can be highlighted for others to view. This highly visual method of sharing information makes spotting trends and events in performance analytics and SQL parsing much simpler, and more efficient.
Since DPM lives in the cloud, you won’t have to worry about costly hardware expenses, server maintenance, or equipment depreciation. While some companies might prefer on-premises solutions, having DPM in the cloud helps decrease deployment time and allows you for a quick onboarding process.
You can test out SolarWinds Database Performance Manager free through a 14-day trial.
8. Redgate SQL Monitor

Redgate is our first tool that is solely dedicated to monitoring SQL services as well as aiding in the deployment of SQL databases through automation. What makes Redgate so powerful is its simplicity. Through a single window, you can view your entire MySQL database and all of your SQL assets. Customizable views and modules can be arranged to ensure you and your team are viewing only the metrics you truly care about.
By default, statistics like the top 10 queries, CPU, Memory, Wait, and Disk I/O are visibly tracked over the course of the last two hours. These individual charts can be toggled on, off, or removed completely and replaced if needed. Under the main resource graph towards the top is a timeline that shows alerts when they occur as small color-coded dots.
Clicking these dots reveals the details of the error such as the object or query it relates to, and where it originated from. I personally enjoy this feature as it eliminates the need to sort through a list of alerts and allows you to see the direct correlation between resource usage and that specific incident.
If you’re troubleshooting a single problem or event in your MySQL environment, you can click the Baseline button to quickly get an idea if this alert is anomalous, or happens at regular intervals. The baseline feature alone will save you countless hours of searching and manually correlating events to performance issues.
Pricing for Redgate is transparent and easy to understand. A single SQL server license will cost $1565.00 per year. This allows you to have multiple databases and server instances without increasing your yearly cost. At this time there is no free trial available, however, demos can be scheduled upon request.
9. Spiceworks SQL Server Monitoring
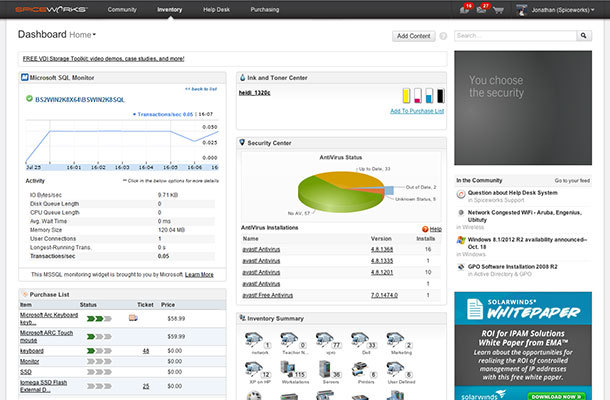
If you’re in the market for a barebones MySQL monitor, SpiceWorks SQL Server Monitoring might be for you. Like many Spiceworks products, this MySQL monitoring tool is completely free to install and operate. Once the agent is installed, there is very little configuration needed.
Through an agent installation, the monitor works by analyzing the SQL servers log files for errors as well as reporting back the server’s resource usage and activity. While the dashboard isn’t the best, it does allow you to configure custom widgets to customize the metrics you wish to monitor. Multiple instances of servers can be tracked on the same dashboard, but don’t expect any advanced view settings like baseline averaging or scalable timelines.
On a very basic level, health checks can be set up to query the server every 60 seconds to check to see if certain thresholds are being breached. You can create thresholds around events such as CPU queue length, I/O speed, disk queue lengths, average wait time, or physical hardware utilization.
If you’re running a home lab, Spiceworks SQL Monitor makes for a great free tool that provides the most basic monitoring features. Due to the lack of features, software support, and the ability to effectively scale, I would not recommend this tool in a business setting.
10. Navicat SQL Monitor
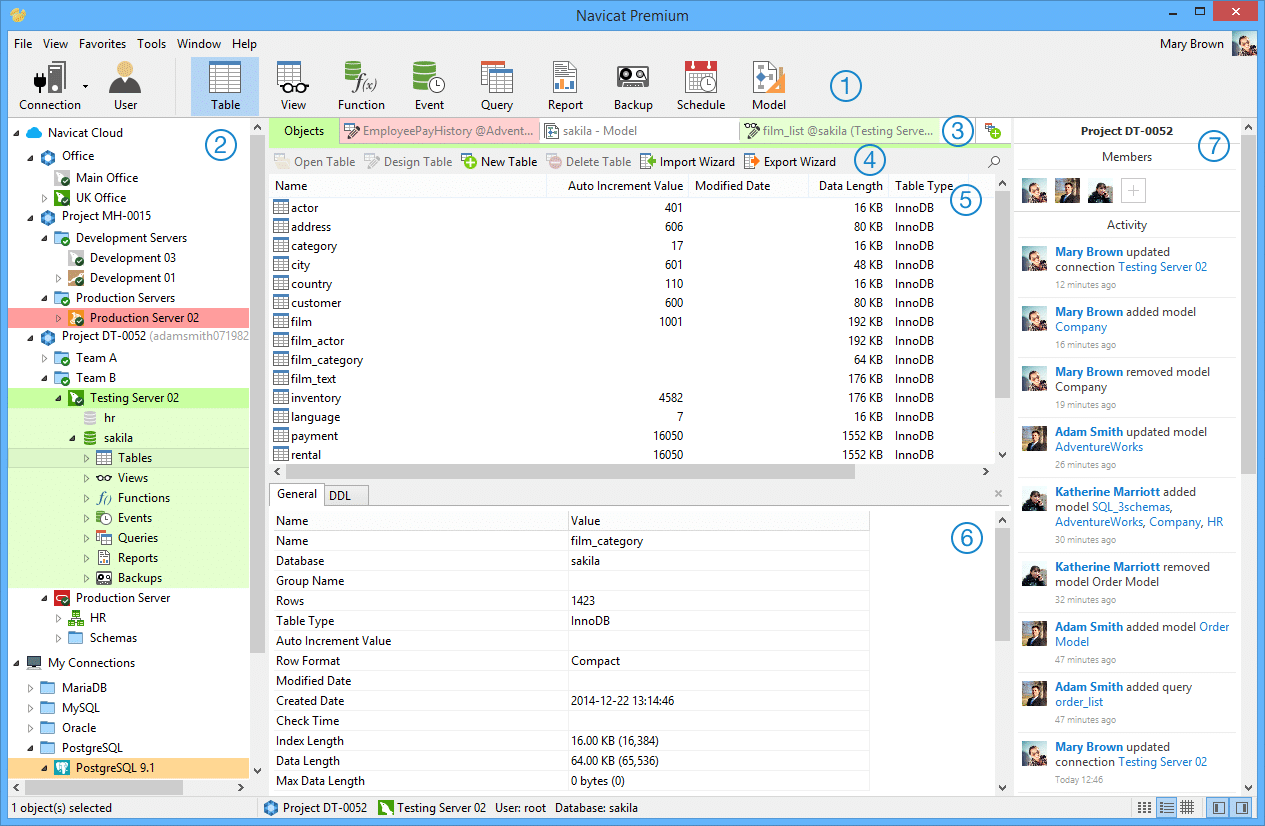
Navicat can monitor MySQL, MariaDB, and SQL server through agentless monitoring across both cloud and on-premises environments. Metrics like CPU load and RAM are shared over SSH/SNMP and accessible via a web browser.
This makes Navicat a viable monitoring solution for those using Windows, iOS, or Linux. While the monitoring tool does use agentless architecture, it still needs a repository for metrics, alerts, and historical analysis. This repository database can be placed in an existing MySQL server for convenience.
The modern interface uses tabs to toggle between alerts, configurations, and the main dashboard. You can create modules for each database or server you want to monitor. Each server instance can be arranged in tiles across your board.
Depending on the current status of that server, the top will change from green, yellow, or red, reflecting its current alert status. Navicat does an excellent job of displaying data across all your servers in a way that can be understood at a glance. As an added bonus the entire interface can toggle into a dark mode, which night owls are sure to appreciate.
Configuring alerts in Navicat are straightforward and based on the thresholds you define. You can combine thresholds with a set duration. For example, you can set Navicat to only alert when memory usage is at 90% for more than 15 minutes. Notifications for your alerts can be received via SMS, email, or applications like Slack.
Navicat’s pricing puts it well within reach for smaller development teams and comes tailored for both commercial and non-commercial usage. Standard licensing starts at $32.99 (£25.74) per month for one server or four Azure Databases. Perpetual licenses are also available for $499.00 (£389.29)per server.
11. Nagios MySQL Monitoring

The Nagios MySQL tool is last, but certainly not least in our quest to find the best MySQL monitoring tools. The Nagios platform offers a suite of monitoring solutions that span across multiple servers and operating systems, but for now, we’ll focus solely on their MySQL monitoring capabilities
All of the metrics you’d expect are covered and displayed through a simple uncluttered interface. Track connection time, open connections, table cache hit rate, and slow queries across multiple servers from a single window.
Alerts are set by threshold or condition and can be delivered by SMS, email notification, or custom script. On the reporting side, Nagios has several prebuilt reports that highlight specific outages, events, and can be configured to track your own SLAs.
Nagios MySQL monitoring can be tested for free through a 30-day trial.
Choosing a MySQL Monitoring Tool
In this article, we’ve narrowed down eight of the very best MySQL monitoring tools, but which one is right for you?
For most medium-sized development teams and IT departments, Idera SQL Diagnostic Manager for MySQL will be your best bet. DPM provides the best mix of MySQL monitoring, proactive alerting, and automated database management.
The DPM tool also features a host of manual tools that developers can use to troubleshoot database problems quickly and effectively.
Hobbyists running a home network will get all of the basic MySQL monitoring features using Spiceworks SQL Server Monitor for free but will have limited support and updates.
How do you currently monitor your MySQL environment? Is your monitoring proactive enough for your databases? Let us know in the comments below.