Google Cloud Platform or GCP is a collection of public cloud services that are offered by Google. The services include data storage, site hosting, computing, and application development – all of which are critical for businesses that use cloud technology.
In fact, the platform’s popularity has continued to grow steadily in the small-to-medium (SMB) and larger business sectors. Meanwhile, Google Cloud is also one of the top three players in the cloud market.
Here’s our list of the eight best Google cloud monitoring tools:
- ManageEngine Applications Manager (FREE TRIAL) Another product from a major technology company that helps in identifying causes of issues. It can gauge various metrics like CPU and memory usage as well as network connectivity issues for an all-around root-cause analysis. Download a free 30-day trial.
- Site24x7 GCP Monitoring (FREE TRIAL) A versatile tool that quickly detects assets, and immediately starts monitoring them once the installation is over. Features like the ability to create custom reports and use various mediums for sending alerts make this a handy tool. Start a 30-day free trial.
- Datadog Google Cloud Platform A monitoring and administration tool for complex cloud platforms and which is also able to integrate well with Google Cloud services. An ideal tool for collaboration among a business’ teams.
- Opsview Google Cloud Platform Monitoring A Google Cloud Platform monitoring tool to track the performance of Compute Engine Instances, Storage Buckets, and databases. It comes with detailed installation notes to help get things off the ground with ease.
- Grafana Google Cloud Monitoring This Google Cloud Platform monitoring tool presents the data it gathers in aesthetic, comprehensible dashboards that make it a pleasure to work with. More importantly, it helps in facilitating quick resolutions to any issues as they will be clearly reported via the dashboards.
- SolarWinds Server & Application Monitor A professional, all-inclusive server monitoring and administration tool that works in the cloud as well as in hybrid environments.
- Dynatrace Google Cloud monitoring An AI-backed cloud monitoring tool with the ability to integrate into hybrid architectures and requires no manual configuration to start being useful to administrators.
- AppDynamics for Google Cloud Platform A Google Cloud Platform monitoring tool from a Cisco company that delivers intelligence in real-time. It is a tool that integrates well the tools that are on this list and can also be used to cross over into other cloud platforms.
Google Cloud Platform – What is it?
The Google Cloud Platform is a container of over 90 services that include computing, storage, databases, networking, bare metal, development tools, API management, migration, as well as identity, access, and security management to name a few.
Google Cloud Platform also provides infrastructure as a service (IaaS), platform as a service (PaaS), and serverless computing environments.
The Google Cloud platform can also refer to Google’s public cloud infrastructure, the G Suite, and other cloud utilities published by Google.
It’s an intuitive, easy way for companies to jumpstart their cloud development, and gain access to some of the most advanced technology in the world.
Google Cloud‘s major competitors are AWS and Microsoft Azure.
Our methodology for selecting the best Google cloud monitoring tools:
We’ve broken down our analysis for you based on these key criteria:
- The tool’s ability to monitor various aspects of the Google Cloud Platform, including IaaS, PaaS, and serverless environments.
- Customizability of monitoring, including support for various scripts and templates.
- Depth and clarity of insights into application performance, system behavior, and security aspects.
- Integration capabilities with other cloud services and third-party products.
- User-friendliness of the interface, especially for managing complex cloud environments.
The best Google Cloud monitoring tools?
1. ManageEngine Applications Manager (FREE TRIAL)

From ManageEngine we have its Applications Manager which supports monitoring of GCE. This tool helps administrators track resource utilization by monitoring critical metrics. It also offers complete visibility into the full cloud computing stack of its Google Cloud Platform which allows for the care and optimization of mission-critical services.
Key Features:
- Detailed resource utilization monitoring.
- Root cause analysis capabilities.
- Monitoring of CPU usage, disk performance, memory use, network statuses.
- Benchmark setting for resource allocation.
Why do we recommend it?
ManageEngine Applications Manager is recommended for its comprehensive visibility into Google Cloud Platform’s full cloud stack and its effective resource monitoring.
Some more Applications Manager features include:
- Root cause analysis capabilities allow for identifying the causes of issues and then resolving them once and for all.
- Metrics that are monitored include CPU usage, disk read/write performance, memory use, and network statuses for a fuller picture of the platform’s health.
- Monitoring the resources that are available to each virtual machine instance – or a group of them – to spot any bottlenecks and correct them by allocating the required quotas; benchmarks can be set to help with the monitoring.
- Applications Manager can also keep an eye on the network throughput to make sure applications aren’t being starved of bandwidth; in case there is a drop in throughput, it can be configured to send out alerts.
- It can also be used to track data from firewalls and, then, allow or deny specific data packets; on the other hand, it can also monitor dropped packets to help with finding out why they are not getting through.
- Since GCE has set limits on the number of resources a project has available to it, administrators can make sure they are well within their quotas, and even prevent issues before they occur by planning for unforeseen spikes.
Who is it recommended for?
Best suited for administrators seeking to optimize mission-critical services and ensure efficient resource allocation in GCE environments.
Pros:
- In-depth monitoring of critical metrics.
- Effective for identifying and resolving issues.
- Useful in managing quotas and preventing resource overutilization.
Cons:
- Can be complex for smaller setups.
- Might require technical expertise for full utilization.
Download ManageEngine Applications Manager for a 30-day FREE trial.
2. Site24x7 GCP Monitoring (FREE TRIAL)

Armed with Site24x7’s GCP Monitoring, administrators can monitor an entire Google Cloud Platform installation practically in real-time. They can gain actionable insights into multiple public clouds or a hybrid cloud environment with its AI-powered availability and performance monitoring tool.
Key Features:
- AI-powered performance monitoring.
- Custom dashboards for tailored data focus.
- Comprehensive monitoring of Google Cloud services.
- SMS alerts and mobile app for remote management.
- Detailed reporting features for performance monitoring.
Why do we recommend it?
Site24x7 GCP Monitoring is recommended for its real-time monitoring and AI-powered insights, providing actionable intelligence for managing public or hybrid cloud environments.
Further looking into this monitoring tool’s features, we have:
- A versatile tool that auto-discovers and monitors Google Compute Engine (GCE) – Google’s IaaS virtual machine service, Google App Engine (GAE), Google Kubernetes Engine, VPC, Cloud IAM, Cloud Audit Logging, Cloud SQL, BigQuery, and more.
- AI-powered Performance Monitoring detects and identifies the root causes of problems to better understand anomalies, dependencies, and events thus enabling administrators to resolve issues before their end-users are affected.
- GCP Monitoring has custom dashboards for smarter operations – administrators can focus on the data they need which helps them address their own custom requirements and queries into their whole cloud stack without distraction.
- They can also add their own charts, based on all of the other various metrics that GCP Monitoring collects, and build business-wide dashboards to view any of their data across various GCP services.
- Administrators can access various reports that are available for Google Cloud Performance monitoring and include “Availability Summary”, “Performance”, and “Top N Reports by Attribute” – and if that’s not enough, they can create custom reports.
A feature administrators will find useful is the fact that Site24x7 GCP Monitoring makes sure they are aware of any issues by alerting them using SMS – they can then use a mobile app to stop or start services as needed. This ensures they keep an eye on their cloud stack even when they are off-site.
Who is it recommended for?
Ideal for administrators who need real-time insights into their GCP environments, especially those managing multiple cloud services.
Pros:
- Real-time monitoring with AI-powered insights.
- Customizable dashboards for focused monitoring.
- Comprehensive coverage of Google Cloud services.
Cons:
- The learning curve for mastering advanced features.
- May be overkill for smaller or simpler cloud setups.
Download a 30-day FREE trial of the Site24x7 GCP Monitoring tool or simply use the FOREVER FREE version.
3. Datadog Google Platform

Datadog can be used to collect and monitor the data streaming from complex environments and even offers extensive support for Google Cloud Platforms. It is an easy-to-install tool that also integrates well with the platform’s numerous services.
Key Features:
- Real-time data collection and scalable monitoring.
- Service Map to display dependencies.
- Collaborative networking capabilities.
- Integration with productivity tools like Slack and JIRA.
- Out-of-the-box integration dashboards.
Why do we recommend it?
Datadog is recommended for its ability to collect and analyze real-time data across complex environments, offering extensive support for Google Cloud Platforms.
Administrators simply deploy the Datadog Agent directly on their hosts and it starts to collect metrics that are then displayed on out-of-the-box integration dashboards which offer high-level insights into all services running on the platform.
But, there’s more:
- The tool offers a Service Map that displays dependencies between databases, APIs, containers, and much more; this allows administrators to have an insight into data movement wherever it may be – on-premises, in the Google Cloud Platform, or even beyond, in case of a multi-cloud architecture.
- It collects data in real-time – as soon as it is created – and works with the platform’s infrastructure to automatically scale making it easy to prevent disasters before they occur.
- Datadog can be used in collaborative networking environments which allow users to use, share, and review information among themselves; it can even integrate with productivity applications like Slack, JIRA, and PagerDuty.
This tool would be a good choice for organizations that require data to be shared in real-time among administrators or users who need to keep an eye on their connections, application services, and overall performance to make sure collaboration doesn’t suffer.
Who is it recommended for?
It’s particularly suitable for organizations requiring collaborative networking environments and those needing comprehensive insights into their cloud services.
Pros:
- Effective real-time data collection and scalability.
- Useful Service Map for understanding dependencies.
- Strong integration with other productivity tools.
- User-friendly and collaborative interface.
Cons:
- May require some technical knowledge for setup and optimization.
- Potentially overwhelming for small-scale users due to its extensive features.
Try Datadog FREE for 14 days.
4. Opsview Google Cloud Platform Monitoring

Opsview’s Google Cloud Platform Monitoring is a tool that offers an easy way to track performance metrics for Compute Engine Instances, Cloud Storage Buckets, and Cloud SQL Database Instances.
Key features:
- Monitoring of Compute Engine Instances, Cloud Storage Buckets, and Cloud SQL Database Instances.
- Performance metrics for CPU, disk, memory, network, and firewalls.
- Detailed installation notes for easy setup.
- Integration with various infrastructures, VMs, and services.
Why do we recommend it?
Opsview is recommended for its ease of tracking performance metrics and the detailed insights it provides for key Google Cloud services.
Opsview Monitor’s GCP Opspack – which includes a collection of host monitoring templates – provides an easy way to monitor performance metrics:
- Checking the availability and usage of resources like CPU, disk, memory, network, and firewalls of instances.
- When it comes to Storage Buckets, it monitors and checks API requests, object counts, bytes, and other relevant statistics.
- It also monitors database instances and reports on the performance of connections, transactions, queries – both sent and received – as well as memory, CPU, and disk usage of SQL and PostgreSQL instances.
Note: In order to monitor Google Cloud Platform, it needs to be installed with its dedicated Opsview Cloud or Opsview Monitor packs.
Users shouldn’t be put off by the fact that various components need to be added to monitor their Google Clouds because there are detailed installation notes. And once installed, this tool can go on and integrate with a large number of infrastructures, VMs, services, containers, databases, and much more. This makes it worth the pain.
Who is it recommended for?
Best suited for users who require detailed performance metrics monitoring, especially for Compute Engine Instances, Cloud Storage, and SQL Databases.
Pros:
- Comprehensive monitoring of key Google Cloud services.
- Detailed performance metrics for efficient resource management.
- Supports a wide range of infrastructures and services.
Cons:
- Setup might require additional components and technical understanding.
- Could be more complex than necessary for very basic monitoring needs.
Schedule a FREE live demo Opsview’s Google Cloud Monitoring Opsack.
5. Grafana Labs Google Cloud Monitoring
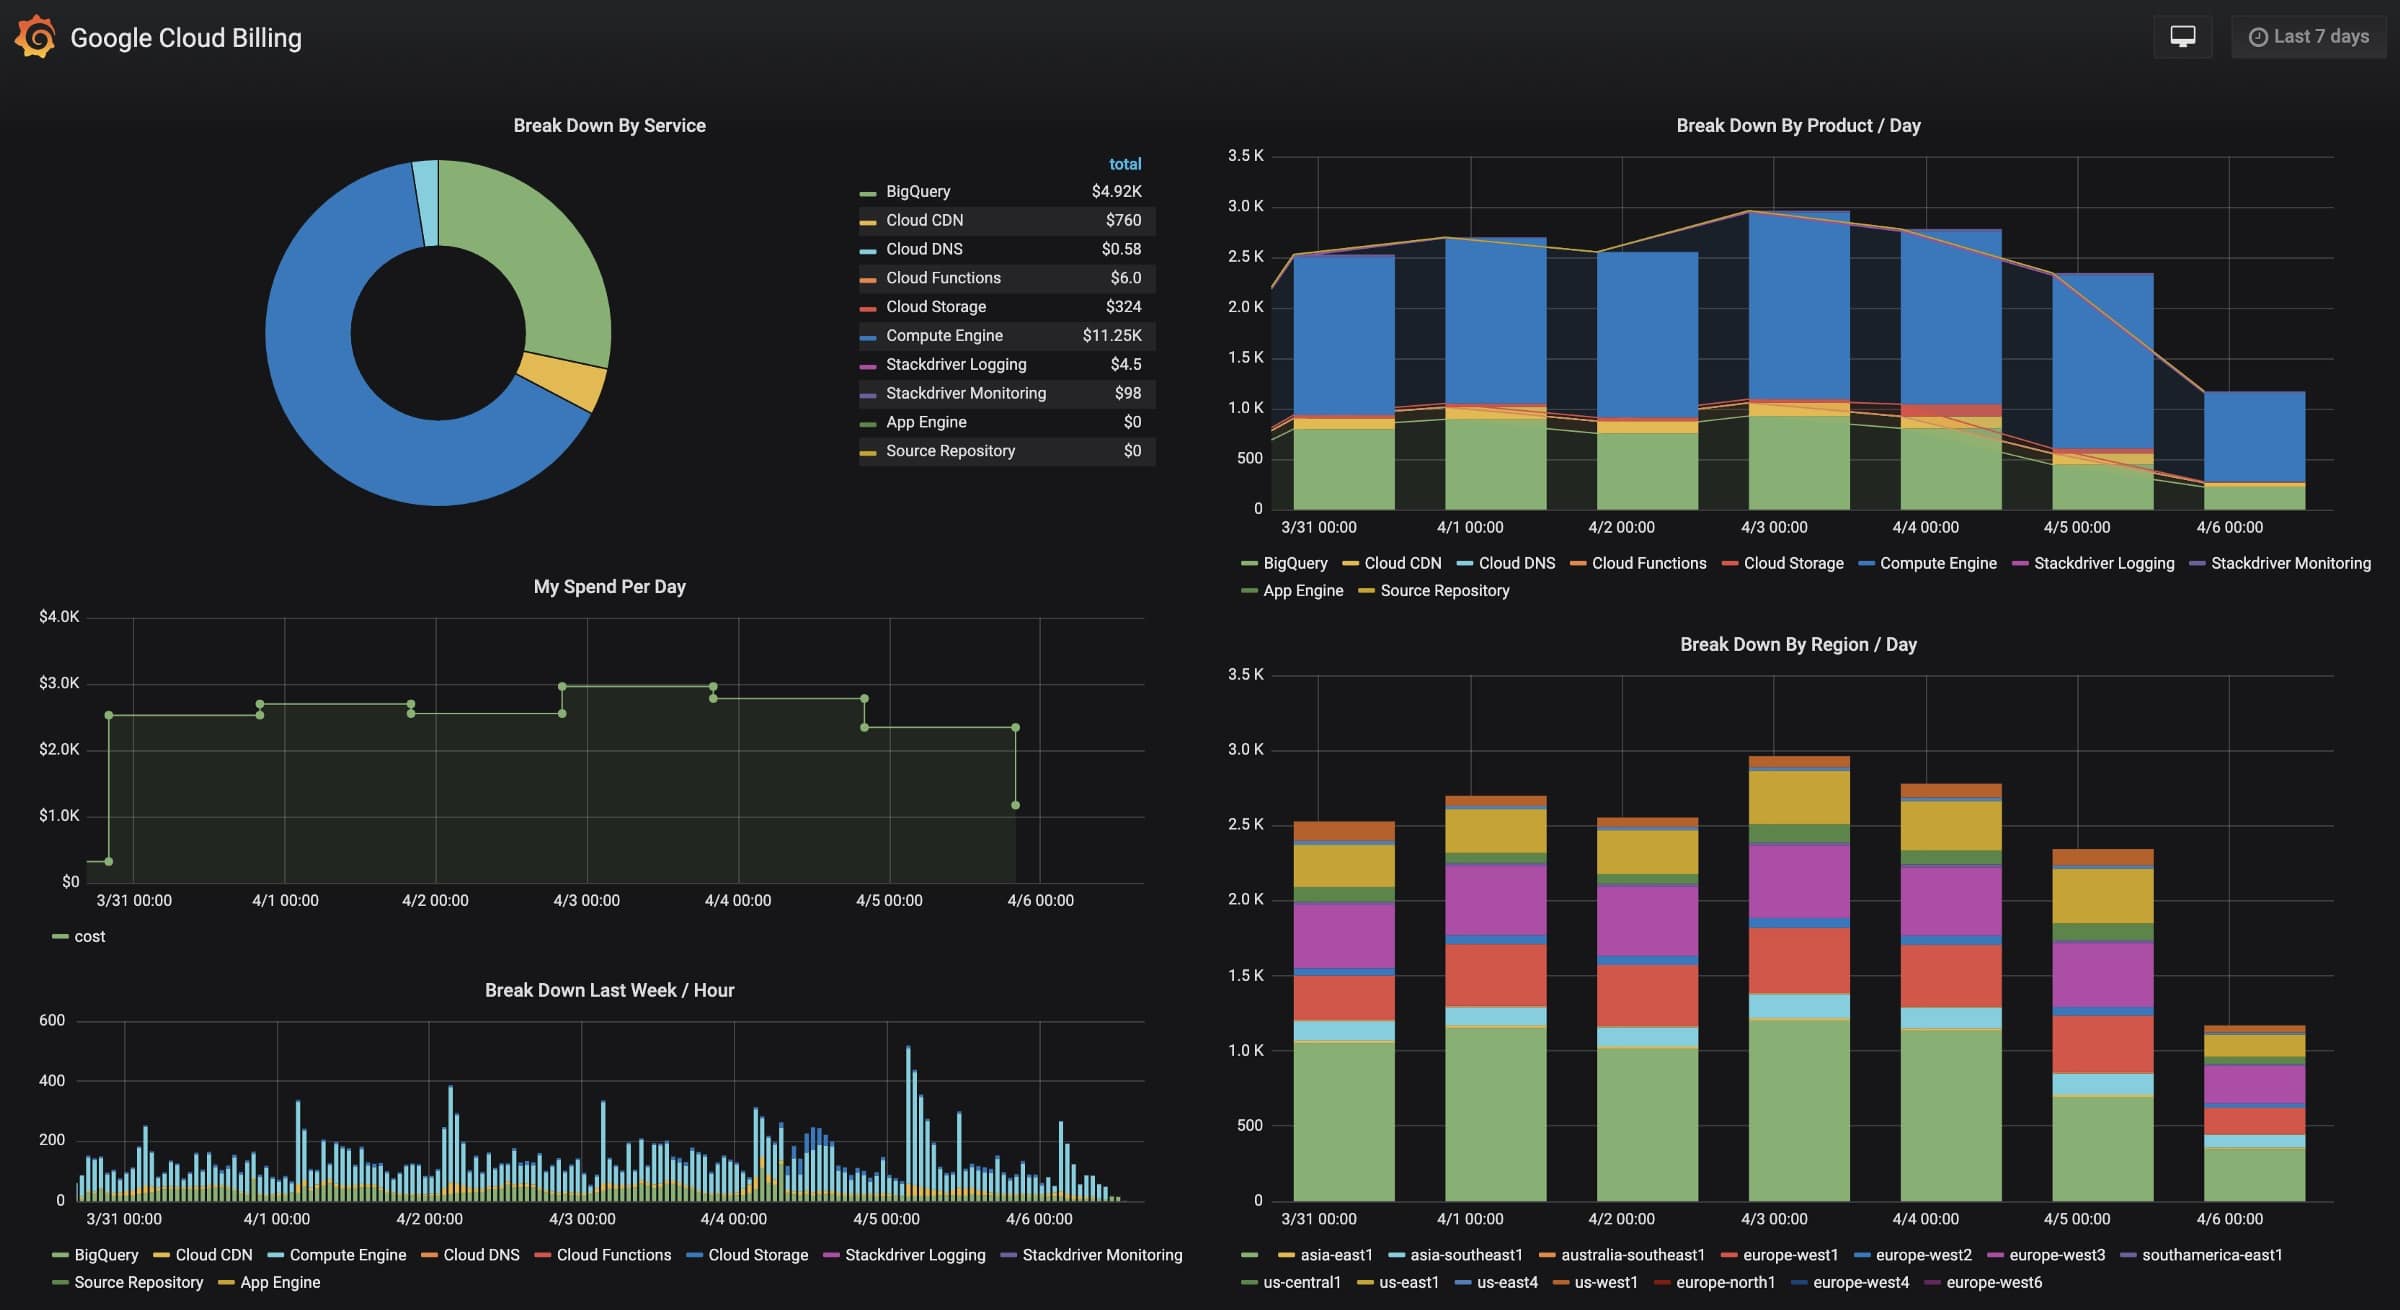
Grafana is an open-source platform for data visualization and monitoring of a wide range of data sources. This, in turn, makes it a universal visualization tool for many popular open source data collection systems – including Prometheus, InfluxDB, Elasticsearch, MySQL, PostgreSQL, as well as Google Cloud Platform.
Key Features:
- Versatile data source plugin support.
- Pre-configured dashboards for popular GCP services.
- Ability to switch seamlessly between metrics, logs, and traces.
- Complex alert criteria building with Query Editor.
Why do we recommend it?
Grafana is recommended for its open-source flexibility and the ease with which it visualizes data from a wide range of sources, including the Google Cloud Platform.
All administrators need to do is install an agent and Grafana is ready to start monitoring Google Cloud Platform data sources via its pre-configured dashboards and alerts.
Looking at some of this tool’s features we have:
- Administrators can add data source plugins to immediately start communicating with data sources like Google BigQuery and Grafana immediately starts to display metrics on its dashboards – it’s as simple as that.
- This data is easily comprehensible as the tool has pre-configured dashboards for most of the popular Google Cloud Platform services – making it easy for administrators to immediately start monitoring their assets without confusion.
- Administrators can seamlessly switch between metrics, logs, and traces; this means they can correlate data and get to the root causes easily and quickly thus reducing the meantime to recovery (MTTR) and de-risk feature launches.
What is truly nice about the Grafana Google Cloud Monitoring tool is that it lets administrators design intricate alert criteria using a Query Editor. Once administrators master the language, they can build any criteria they want – no matter how complex the conditions may be.
Who is it recommended for?
Ideal for administrators who value customizable data visualization and need to monitor a variety of data sources across the Google Cloud Platform.
Pros:
- Flexible and customizable data visualization.
- Easy setup and immediate dashboard availability.
- Supports intricate alert criteria for complex monitoring needs.
Cons:
- Might require more effort to fully master and utilize all features.
- Open-source nature means less direct support compared to commercial tools.
There are FREE and TRIAL versions of Grafana to use and test the Google Cloud Monitoring tool.
6. SolarWinds Server & Application Monitor

All SolarWinds monitoring tools for cloud network environments are famous for being easy to understand, use, and support. In fact, the company is the leading maker of application, network, server, and platform monitoring tools. Among these tools, we find its Server & Application Monitor (SAM) – a highly effective administration tool that is at home in both cloud and hybrid computing environments.
Key Features:
- Custom monitoring with REST API, WMI, SNMP, PowerShell scripts.
- Over 1,200 pre-built and 1,000+ community monitoring templates.
- In-depth application performance monitoring and system behavior analysis.
- Infrastructure mapping and dependency visualization.
- Advanced log analysis with interactive dashboards.
Why do we recommend it?
SolarWinds SAM is recommended for its comprehensive and customizable monitoring capabilities, making it highly effective for both cloud and hybrid environments.
And among the many features that make it stand out:
- The tool offers custom monitoring with REST API, WMI, SNMP, and PowerShell scripts which are backed by over 1,200 out-of-the-box monitoring templates – not counting the over 1,000 community templates – to help with setting up the perfect monitoring environment.
- This customizable monitoring also extends to accessing logs – with no setup required and comes with an easy-to-use search.
- Administrators can monitor, trace, and visualize application performance, spot bottlenecks, analyze system behavior, and deter suspicious activity across the whole cloud computing stack that can consist of Software as a Service (SaaS), Platform as a Service (PaaS), and Infrastructure as a Service (IaaS).
- They can even map their infrastructure and dependencies for a clearer vision of their whole networking environment with insights into the performance of custom applications and services.
- They can monitor these applications and services by modifying a template, creating one from scratch, simply defining what they need monitored, or importing in-house scripts to monitor any custom apps.
- SAM helps to analyze data streams, manage events, and get alerts from saved searches; administrators can analyze and visualize log data with interactive dashboards that are easy to understand, advanced log correlation, and anomaly detection; it further helps speed up troubleshooting with its full-text search capabilities into logs.
Probably the best feature is that SolarWinds Server & Application Manager helps administrators master their digital assets – both hardware and software – because it integrates with numerous other products, including those made by other, third-party companies.
Who is it recommended for?
Ideal for administrators needing detailed insights into application performance, system behavior, and suspicious activities across a full cloud stack.
Pros:
- Extensive customization and flexibility in monitoring.
- Detailed visualization of infrastructure and dependencies.
- Advanced capabilities in log analysis and troubleshooting.
Cons:
- Complexity may be overwhelming for beginners.
- Could be more expensive than other solutions.
You can try SolarWinds Server & Application Monitor through a free 30-day trial.
7. Dynatrace Google Cloud Monitoring

Dynatrace Google Cloud Monitoring offers fully automated and AI-assisted in-depth monitoring of Google Cloud Platform. Administrators can use Google Cloud Service metrics to understand the health and performance of their platforms. This tool offers observability across pure Google Cloud Platform or hybrid environments and is purpose-built for the cloud.
Key Features:
- AI-assisted in-depth monitoring.
- Automatic discovery and monitoring of GCE, GKE, Anthos, and hybrid environments.
- Single view across the entire Google Cloud Platform.
- Democratization of data across business units.
Why do we recommend it?
Dynatrace is recommended for its automated, AI-assisted monitoring capabilities, providing a comprehensive view of Google Cloud Platform environments.
A further look into the many Dynatrace features:
- Automatically discovers, baselines, and intelligently monitors GCE, Google Kubernetes Engine (GKE), Anthos, and other hybrid or multi-cloud environments – all in a single view for the whole architecture.
- Easy to use straight out of the box with auto deployment, configuration, and intelligence; it uses a single agent – aptly called OneAgent – that scales effortlessly regardless of the size of the platform with zero manual configuration required.
- Assesses the whole technology stack and discover the entire collection of hosts, processes, services, and technologies.
- Administrators can plan their tasks with the help of in-depth analysis offered by the tool for better architectural decisions and even effectively plan future migrations.
- They have a single view across the entire Google Cloud Platform – from users and edge devices to apps and other cloud platforms; for a better understanding of the performance of every single user session or device which can then be prioritized based on business requirements.
This tool also offers democratization of data by allowing for the breakdown of data silos whenever collaboration across business units is required while protecting their individual data.
Who is it recommended for?
Suitable for large-scale enterprises that require in-depth, AI-driven insights and a unified view across complex, multi-cloud or hybrid environments.
Pros:
- Automated and intelligent monitoring for efficiency.
- Comprehensive view of entire cloud infrastructure.
- Useful for large-scale and complex cloud environments.
Cons:
- Might be too complex for smaller organizations or simpler cloud setups.
Try Dynatrace Google Cloud Monitoring FREE for 15 days.
8. AppDynamics for Google Cloud Platform
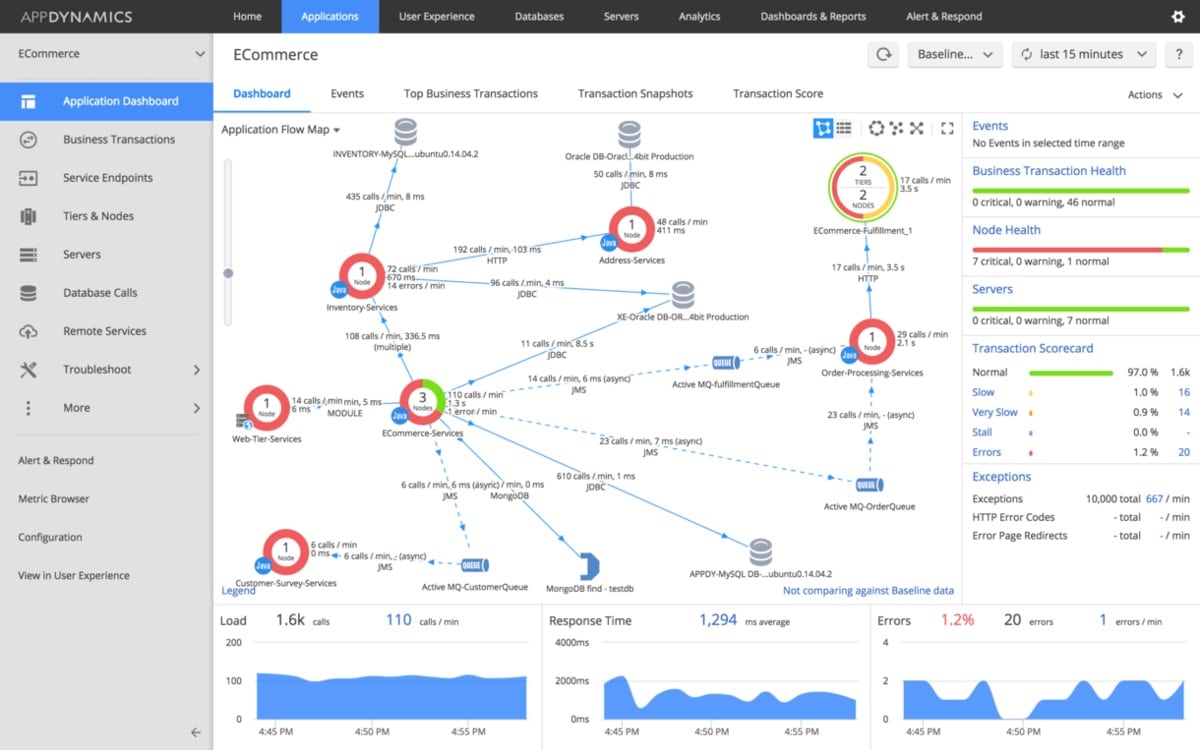
AppDynamics, a Cisco company since early 2017, offers Google Cloud Platform monitoring. Its platform delivers powerful, real-time intelligence and insights into the performance, user experience (UX), objectives, and business process outcomes of a Google Cloud installation.
Key Features:
- Unified Monitoring for comprehensive performance tracking.
- Supports diverse architectures and devices.
- Cross-platform functionality with other major cloud services.
- Real-time insights into application performance and business transactions.
Why do we recommend it?
AppDynamics is recommended for its powerful monitoring capabilities across the full cloud stack, offering deep insights into performance, user experience, and business outcomes.
The tool’s Unified Monitoring feature makes it easy to capture and display the performance of the full cloud stack. This helps an administrator to spot issues before they affect overall output or user experience, and then collaborate on resolving them in the shortest time possible.
There’s more:
- It is home in most architectures and the devices supported by this tool include Windows, Android, iPhone, iPad, and Mac as well as web-based applications.
- It can be used to assess the performance of the cloud at the application level and right up to inter-cloud architectures; apart from Google Cloud Platform it can cross over and work on Microsoft Azure or AWS, for example.
- The tool is highly integrative which means administrators can easily communicate with some of the other Google Cloud Platform monitoring tools that we have just seen – with examples including SolarWinds and Datadog.
- The software enables users to learn the real state of their cloud applications right down to the business transaction and code level; this also makes it easier for the IT team to create cloud-native applications that can be gauged from inception to deployment stages – in real-time, of course.
- Administrators get a clear overview of the entire infrastructure because they can see the health of the entire network based on monitoring results for CPU or memory usage; for example, the analysis is made easier with the help of custom dashboards that also make it easy to make decisions based on the clear way they depict aspects like application health, infrastructure parameters, database capacities, and business data to be consumed by the concerned stakeholders and technology support teams.
Who is it recommended for?
Ideal for organizations that require a holistic view of their cloud performance, from application-level to inter-cloud architectures.
Pros:
- Comprehensive monitoring of cloud applications and infrastructure.
- Supports a wide range of architectures and devices.
- Integrates well with other cloud platforms and monitoring tools.
Cons:
- Pricing and complexity might not suit smaller businesses.
- May require a significant investment of time and resources to fully utilize.
AppDynamics offers a FREE 15-day trial of its Google Cloud Monitoring Tool
Which Google Cloud Monitoring Tool is right for you?
Okay, those were our 8 Best Google Cloud monitoring tools. But, if you are wondering how they became a part of this list, here are some features you need to look for in a great tool:
- Monitoring of custom metrics that may be unique to a business’ processes or architecture using custom dashboards or templates.
- Discovery and monitoring of all Google Cloud resources and services with minimal configuration needed and the ability to integrate directly into the Google Cloud console.
- Use of an agent that is easy to install or deploy and that doesn’t eat up memory, disk space, or bandwidth.
- Presentation of collected data – from the whole cloud or hybrid architecture – and analysis in aesthetic reports and charts with alerts clearly displayed for timely decisions to be made and actions to be taken.
- The ability to drill down into reports, charts, or logs directly from the dashboard.
- Alerts that can be sent out to administrators via platforms they may choose – email, text, or any other productivity or collaboration tool like Slack.
- The ability to configure custom metric violation alerts that meet the needs of a business’s unique requirements.
And there you have it – if you find a tool that meets all or most of these features you can safely assume that it is one of the best Google Cloud Monitoring tools for your business.
Let us know if there are any tools you think belong on this list by leaving us a comment below.