When was the last time you used an application at work? Every day, companies rely on applications, which in turn depend on servers to function. If the performance of these servers isn’t maintained properly, then the user experience of connected applications could suffer. In this article, we’re going to look at the top SQL Server monitoring tools for organizations using SQL servers.
Here is our list of the best SQL monitoring tools:
- ManageEngine Applications Manager (EDITOR’S CHOICE) Specialized monitor for SQL Server, other DBMSs, system applications, and servers. Installs on Windows Server and Linux.
- Paessler PRTG Network Monitor (FREE TRIAL) A network monitoring tool that can monitor SQL performance for Microsoft SQL, MySQL, Oracle SQL, and PostgreSQL. Access a 30-day free trial.
- Site24x7 SQL Server Monitoring (FREE TRIAL) Server monitoring system that also supervises all of the applications that support user interfaces, including SQL Server databases. This is a cloud-based service.
- ManageEngine EventLog Analyzer (FREE TRIAL) A SQL Server auditing tool that detects complex attack patterns in SQL databases and sends alerts for quick remediation. Start a 30-day free trial.
- Redgate SQL Monitor An SQL monitoring tool with customizable alerts and reports.
- dbWatch A database performance monitor that can monitor MS SQL Server, MySQL, Oracle, Azure, Sybase, and PostgreSQL.
- Idera SQL Diagnostic Manager Database monitor with performance recommendations and predictive alerts.
- SolarWinds Database Performance Analyzer A query performance monitor compatible with SQL Server, MySQL, Azure, DB2, SAP ASE, and AWS.
- dBForge Monitor (Free Microsoft SQL Server Management Studio Add-On) An SQL performance analyzer that can monitor CPU utilization, memory utilization, disk activity, read and write latencies, and more.
- Spiceworks A network and server monitoring tool that can automatically discover SQL databases.
Our methodology for selecting best SQL Server Monitoring Tools
We’ve broken down our analysis for you based on these key criteria:
- Comprehensive Monitoring Capabilities: Tools that offer extensive monitoring for SQL Server performance, including real-time metrics and historical data analysis.
- Ease of Use: Solutions with user-friendly interfaces, intuitive dashboards, and straightforward configuration processes.
- Scalability and Flexibility: Ability to handle varying sizes of database environments, from small setups to large, enterprise-scale deployments.
- Integration and Compatibility: Tools that easily integrate with other IT management and monitoring solutions, and support various SQL Server versions and environments.
- Proactive Alerts and Reporting: Features that provide customizable alerts and detailed reporting to preemptively address issues and ensure optimal database performance.
The Best SQL Server Monitoring Tools
1. ManageEngine Applications Manager (FREE TRIAL)
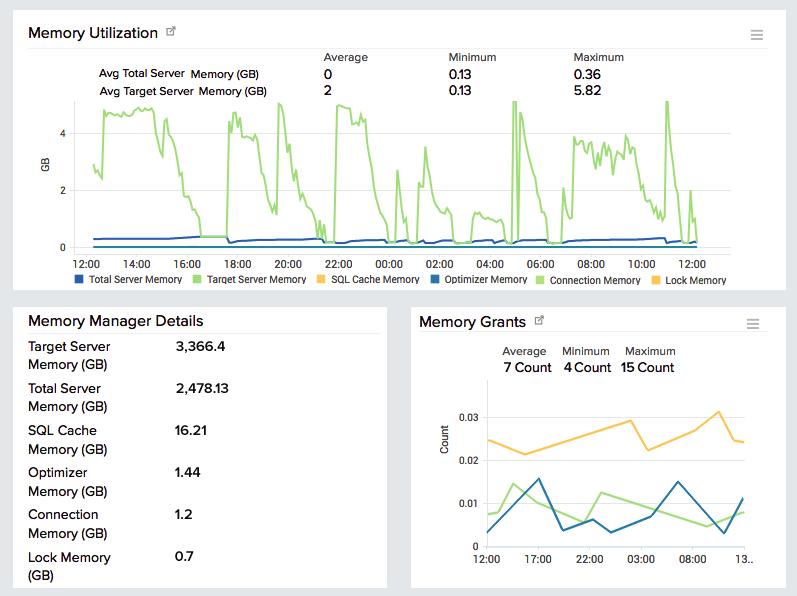
Applications Manager from ManageEngine includes specialized functions for monitoring databases. The software will monitor SQL Server databases as well as a long list of other DBMSs, including Oracle, SAP, PostgreSQL, and MariaDB. This means that the Applications Manager will effortlessly monitor a mixed-vendor environment, covering databases from different brands all on the same package.
Key Features:
- Database Monitoring: Monitors SQL Server, Oracle, SAP, PostgreSQL, MariaDB, and more.
- Unified Interface: Offers a single, tabbed screen for database, server, and application monitoring.
- Live Status Tracking: Provides real-time status updates for all databases on a server.
- Performance Analysis: Includes synthetic testing to optimize database queries and structures.
- Cross-Platform Compatibility: Installs on both Windows Server and Linux.
Why do we recommend it?
ManageEngine Applications Manager’s unique strength lies in its ability to seamlessly monitor diverse databases from various vendors within a single, consolidated package. This versatility ensures that it caters to mixed-vendor environments, making it a comprehensive solution for organizations with diverse database needs. Additionally, the tool’s integrated approach, combining database, server, and application monitoring in one interface, enhances overall resource management efficiency.
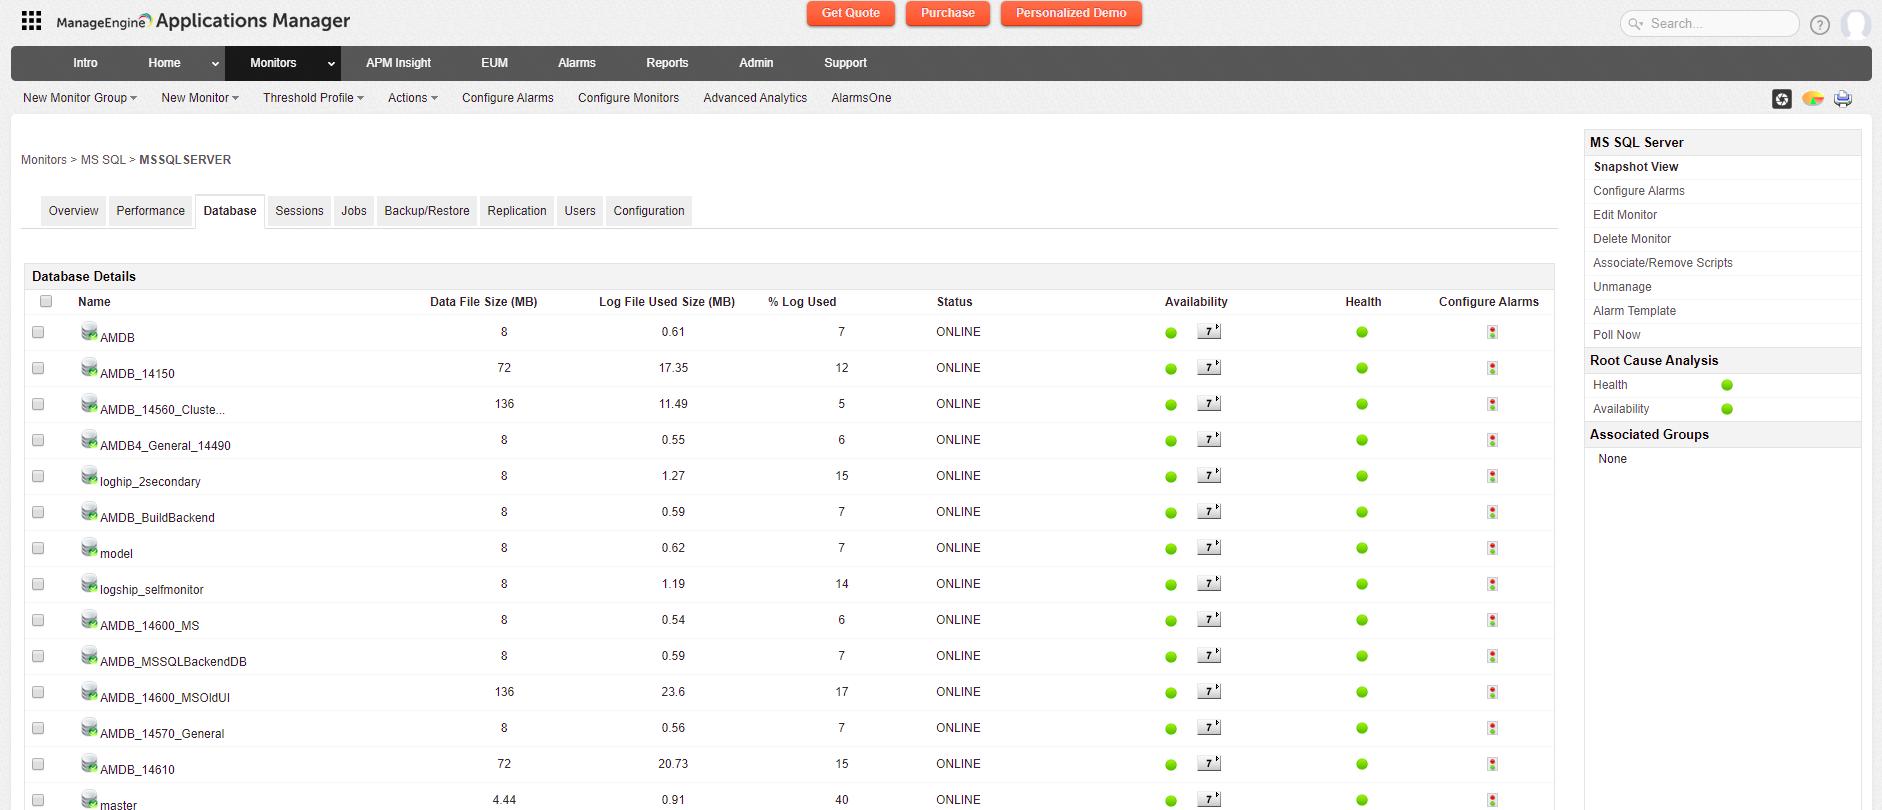
The screens for the database monitoring service are all bundled together in one tabbed screen. Leaving the database monitoring section of the Applications Manager, the user gets access to server monitoring functions and sections of the software that cover other applications, such as web servers and virtualization systems.
The tool tracks live statuses of all databases operating on a server. This summary view gives a good idea of the suitability of the host to support all of the load put on it. The DBA can drill down through database type, such as SQL Server, and then through to each individual instance.
The Applications Manager includes performance analysis features, such as synthetic testing of database structures so that developers can put their queries and database objects to the test before releasing them to the public. This enables performance tuning to be carried out without having to burden users with inefficient queries or badly constructed objects.
Who is it recommended for?
ManageEngine Applications Manager is recommended for organizations seeking a unified solution for monitoring diverse databases in a mixed-vendor environment. Our testing indicates its proficiency in handling SQL Server databases along with other DBMSs like Oracle, SAP, PostgreSQL, and MariaDB. The tool’s consolidated interface, seamlessly transitioning between database monitoring and other application and server monitoring functions, makes it suitable for IT professionals managing multifaceted infrastructures. The live status tracking of all databases provides a holistic view of server suitability, while the ability to drill down to individual instances enhances precision in monitoring. This recommendation is particularly tailored for enterprises looking for an integrated, cross-functional monitoring tool that streamlines resource management on both Windows Server and Linux environments.
Pros:
- Versatile Monitoring: Seamlessly monitors diverse databases from various vendors.
- Integrated Solution: Combines database, server, and application monitoring in one tool.
- Real-Time Insights: Tracks live statuses for a comprehensive overview of server health.
- Detailed Drill-Down: Allows precise monitoring down to individual database instances.
- Performance Optimization: Enables synthetic testing for performance tuning without user disruption.
Cons:
- Complex Setup: Initial configuration might be complex for new users.
- Resource Intensive: Requires significant system resources for full functionality.
- Learning Curve: May have a steep learning curve for users unfamiliar with comprehensive monitoring tools.
- Limited Free Trial: Only available for 30 days, which might be insufficient for thorough evaluation.
- Advanced Features Require Licensing: Some advanced features are only accessible with a licensed version.
ManageEngine produces a long list of infrastructure monitoring tools and they are all able to work together in order to ensure a seamless resource management service. The ManageEngine Applications Manager installs on Windows Server and Linux. It is available for a 30-day free trial.
EDITOR'S CHOICE
ManageEngine Applications Manager is our top pick for an SQL Server monitoring tool because this package includes a discovery phase that will identify all SQL Server instances and other applications running on the same server. The tool also tracks through process activity to identify which applications call others and, where possible, scans through code to discover external functions and microservices. The result of this initiative is an application dependency map. This will show you which applications access your SQL Server database and also which server resources support the instance. This map is particularly important for websites and Web applications where delivery speed is crucial. If a site slows down, you need to find out quickly why that happened. The reason for that performance dip could be your database or a connected service. ManageEngine will send you an alert if a component develops a problem. So, you can see straight away, which part of your system failed first. Alerts can be forwarded to technicians by SMS or email, so they don’t need to sit and watch the Applications Manager dashboard in order to spot performance issues.
Download: Get a 30-day free trial
Official Site: https://www.manageengine.com/products/applications_manager/download.html
OS: Windows Server, Linux, AWS, and Azure
2. Paessler PRTG Network Monitor (FREE TRIAL)
Paessler PRTG Network Monitor is a unified network monitoring system that can monitor servers and other infrastructure. With PRTG Network Monitor, you can analyze Microsoft SQL, MySQL, PostgreSQL, and Oracle SQL servers for signs of performance degradation.
Key Features:
- Unified Monitoring: Monitor multiple SQL server types from a single platform.
- Pre-Configured Sensors: Tailored sensors for Microsoft SQL, Oracle SQL, MySQL, and PostgreSQL.
- Detailed Performance Data: View metrics like execution time and query specifics.
- Configurable Alerts: Set thresholds and receive notifications via email, SMS, Slack, and push notifications.
- Cost-Effective: Free for up to 100 sensors, with affordable paid options.
Why do we recommend it?
PRTG Network Monitor impresses with its user-friendly design, offering essential information like execution time of database requests and query specifics. By analyzing Microsoft SQL, MySQL, PostgreSQL, and Oracle SQL servers, we validate its effectiveness in detecting performance degradation. The pre-configured sensors for each type of SQL server, such as Microsoft SQL v2 Sensor and Oracle SQL v2 Sensor, provide tailored monitoring interfaces with detailed performance data. The alert system, configurable through email, SMS, Slack, and push notifications, enhances its proactive approach to performance issues without manual intervention.
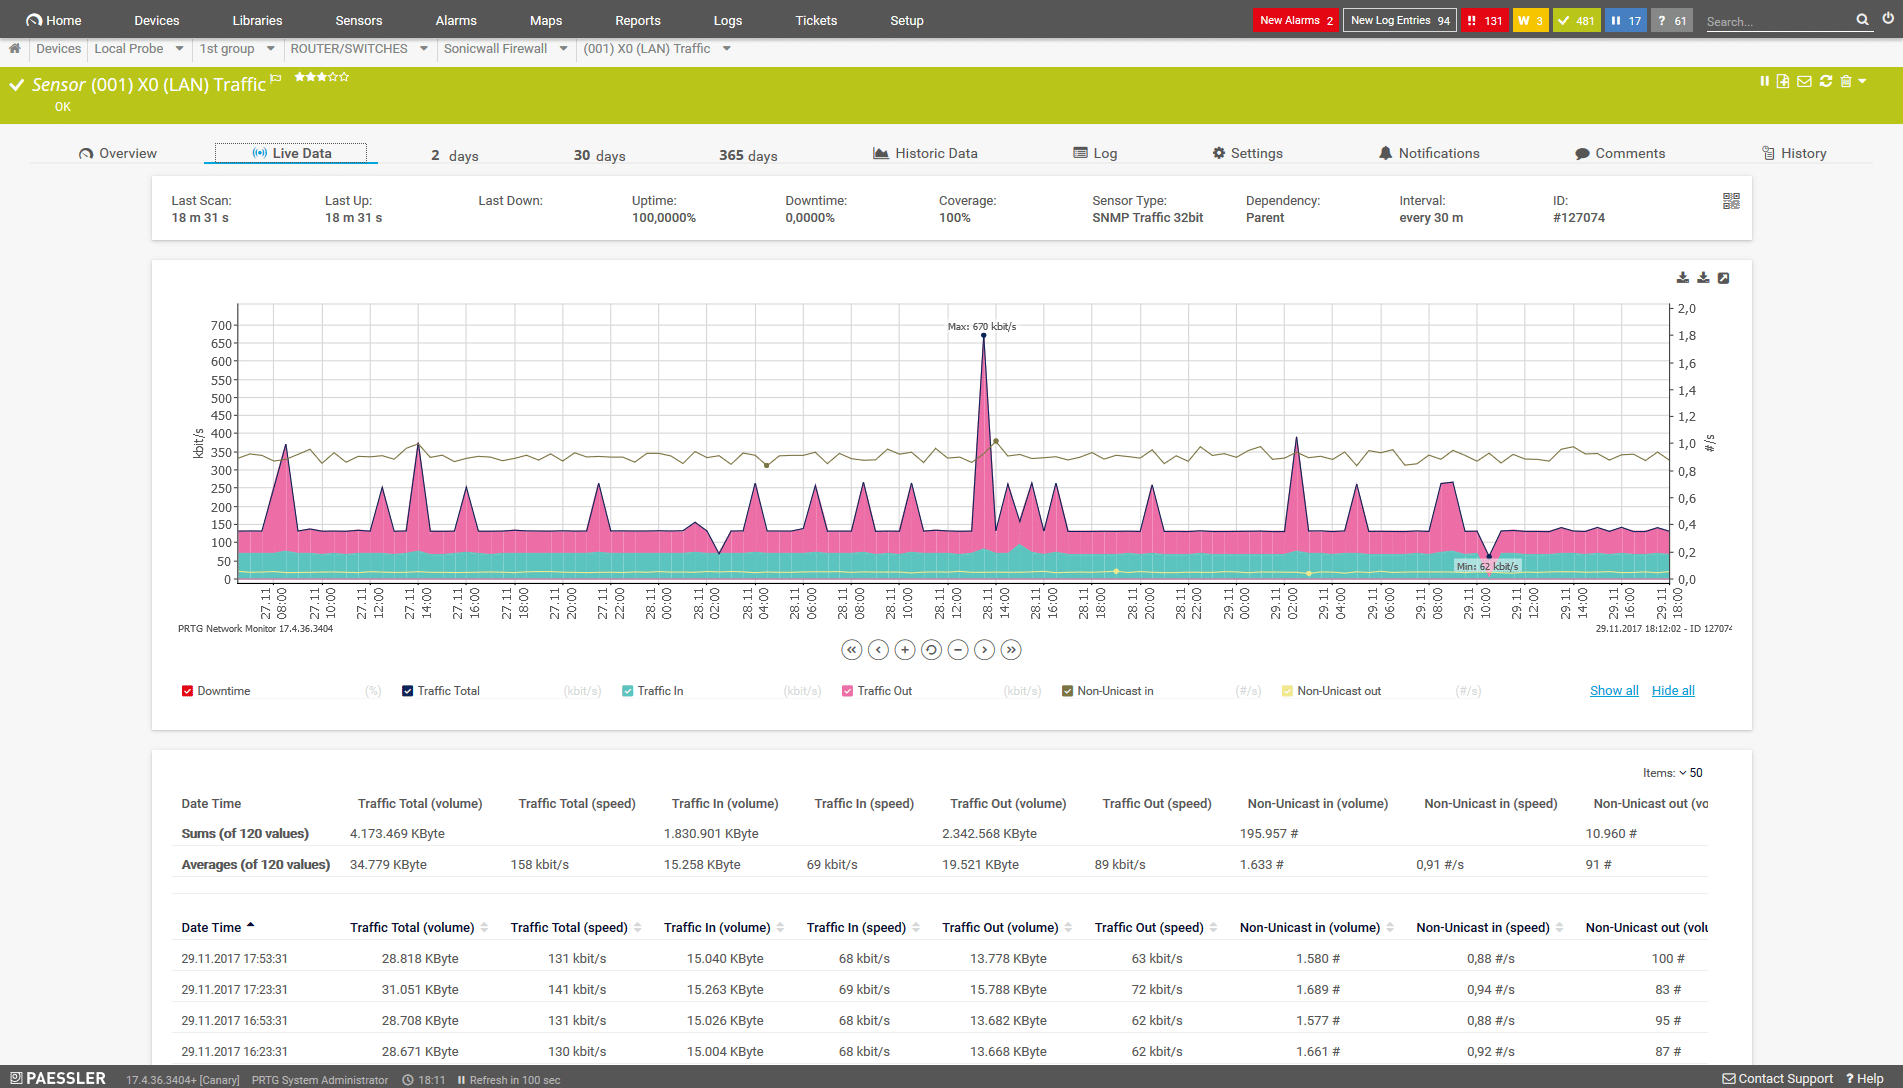
Each type of SQL server has its own pre-configured sensor on the PRTG Network Monitor. Sensors are monitoring interfaces where you can view performance data. There are multiple sensors including Microsoft SQL v2 Sensor, Oracle SQL v2 Sensor, MySQL v2 Sensor, and PostgreSQL Sensor.
The Microsoft SQL v2 Sensor displays information such as execution time of database requests, the execution time of the defined query, number of rows addressed by the query, and more.
There is also an alert system so that you don’t have to manually stay on top of every performance issue live. Alerts tell you by email, SMS, Slack message, and push notification when a server’s performance has moved outside of a normal threshold. Alerts can be configured according to your needs.
Who is it recommended for?
Paessler PRTG Network Monitor is specifically recommended for users looking for a unified, low-cost solution for monitoring SQL servers. Our testing indicates its proficiency in analyzing various SQL server types, making it versatile for organizations with diverse database environments. The tool’s alert system, coupled with configurable thresholds, ensures timely notifications for performance issues. PRTG Network Monitor’s cost-effectiveness, especially for users with fewer than 100 sensors, makes it an attractive choice for small to mid-sized enterprises seeking a reliable and budget-friendly SQL server monitoring tool. This recommendation is tailored for users prioritizing simplicity, cost efficiency, and effective monitoring of SQL servers.
Pros:
- Versatile Monitoring: Supports multiple SQL server types for comprehensive monitoring.
- User-Friendly Interface: Easy-to-use design with pre-configured sensors for quick setup.
- Detailed Insights: Provides in-depth performance metrics, including execution times and query details.
- Proactive Alerts: Configurable alert system to notify you of performance issues in real time.
- Affordable: Free for small setups and cost-effective paid plans for larger environments.
Cons:
- Limited Free Version: The free version is restricted to 100 sensors, which may be insufficient for larger setups.
- Initial Setup: Configuring multiple sensors might be time-consuming for some users.
- Support Costs: Accessing premium support services may incur additional costs.
- Complexity for Beginners: New users might face a learning curve with advanced features.
PRTG Network Monitor is a great low-cost tool for monitoring SQL servers. The tool is free for users with less than 100 sensors. Paid versions of PRTG Network Monitor start at $1,600 (£1,238) for five sensors and one server installation. You can download a 30-day free trial.
3. Site24x7 SQL Server Monitoring (FREE TRIAL)
Site24x7 monitors all of the services that support a front end all the way down to the operating system of the host. This collection of applications includes databases. The Site24x7 system can be expanded by integrations, which add special monitoring capabilities to the base package. These integrations are free add-ons and there is one for Site24x7 SQL Server Monitoring.
Key Features:
- Cloud-Based Access: Monitor from anywhere using any standard web browser.
- SQL Query Analysis: Examine and identify execution errors in SQL queries.
- Database Structure Monitoring: Track transaction performance, I/O, and disk usage.
- Resource Identification: Pinpoint physical server resources accessed by database processes.
- Automated Alerts: Set performance and resource availability thresholds for timely notifications.
Why do we recommend it?
Site24x7‘s cloud-centric approach allows for seamless accessibility through standard web browsers, providing flexibility and convenience. Through integrations, Site24x7 extends its monitoring capabilities, including the free add-on for SQL Server Monitoring. Our testing involves the installation of the on-premises data collector, ensuring a secure connection for uploading statistics to the Site24x7 cloud servers. The SQL Server monitor impresses with its multi-level examination, encompassing SQL query execution, database structure monitoring, and identification of underlying server resources. The system’s ability to identify dependencies between applications and system resources enhances root cause analysis for front-end performance issues.
The Site24x7 system is based in the cloud. All of the processing to generate statistics and data visualizations is performed on the Site24x7 servers. The console for Site24x7 can be accessed by any standard web browser from anywhere. There is one part of the system that needs to be installed on-premises. This is a data collector and it uploads statistics to the Site24x7 server over a secure connection.
The SQL Server monitor operates on several levels. It examines the execution of SQL queries on all of the enrolled SQL Server database instances and spots execution errors. It also monitors the structure of the database, watching how its transactions perform, such as I/O and disk usage. The SQL Server Monitor also looks underneath the database management system and identifies all of the physical server resources that each database process accesses.
The Site24x7 monitoring strategy identifies dependencies between applications and system resources. This makes it easier to discover the root cause of front-end performance problems. The ability to set performance and resource availability thresholds is another big advantage of this system. When a threshold is crossed, the system raises an alert, which is shown on the screen and also forwarded as notifications by email or SMS message to key staff.
The automated monitoring procedures in Site24x7 Infrastructure let technicians get on with other tasks because they know if a problem with their database arose, they would be drawn back to the monitoring dashboard and have enough time to head off disaster.
Who is it recommended for?
Site24x7 SQL Server Monitoring is recommended for organizations seeking a cloud-based, comprehensive monitoring solution covering services from front end to host operating systems. Our testing indicates its proficiency in SQL query execution analysis, database structure monitoring, and resource identification. The system’s automated monitoring procedures, coupled with the ability to set performance thresholds, make it advantageous for technicians looking to proactively manage database-related issues. The cloud-based infrastructure ensures accessibility from anywhere, while notifications through email or SMS keep key staff informed. This recommendation is tailored for those prioritizing a cloud-centric monitoring strategy with the flexibility to identify and address potential database problems efficiently.
Pros:
- Comprehensive Monitoring: Covers services from the front end to host operating systems.
- Cloud Accessibility: Access the console from anywhere using a web browser.
- Free Integrations: Includes a free add-on for enhanced SQL Server monitoring capabilities.
- Automated Alerts: Automated monitoring and alerts help prevent potential issues.
- Dependency Identification: Identifies dependencies between applications and system resources for effective root cause analysis.
Cons:
- Initial Setup: Installation of the on-premises data collector may be required.
- Learning Curve: May require time to fully understand and utilize all features.
- Limited Offline Access: Functionality depends on cloud connectivity, limiting offline capabilities.
Site24x7 Infrastructure is a subscription service that can be enhanced with extra add-on services. Get started with a 30-day free trial .
4. ManageEngine EventLog Analyzer (FREE TRIAL)

ManageEngine EventLog Analyzer is a comprehensive SQL Server auditing tool that gathers logs from all your databases and analyzes them for complex attack patterns, anomalies, privilege abuse, SQL injection attempts, credential theft, and more. Based on the findings, it sends instant alerts for quick remediation.
Key Features:
- Login Monitoring: Audits the login activities to detect identity theft and privilege abuse.
- DDL and DML Activities: Tracks DDL and DML to identify functional and structural-level changes in your database.
- SQL Injection Attacks: Its powerful correlation engine protects your network from SQL injection attacks.
- Alerts: Sends real-time alerts and notifications.
- Incident Response: Comes with an integrated incident response management console.
- Report Templates: Offers reporting templates for meeting compliance requirements.
Why do we recommend it?
ManageEngine EventLog Analyzser is recommended for its capability to correlate logs from different sources to provide detailed insights into your SQL server environment. What we love about this tool is its coverage of security events, as it can detect SQL injection events, credential abuse, identity thefts, data exfiltration attempts, and more.
A notable aspect is its out-of-the-box reporting templates that enable compliance with leading standard besides providing the required contextual data for troubleshooting. It also helps identify deviations from internal policies, so you can take appropriate action.
Who is it recommended for?
It is highly recommended for database engineers and architects, security and compliance teams, and any organization using SQL Server as its database.
Pros:
- Real-time Insights: Sends alerts in real time when it sports any issues.
- Security Posture: Maintains your organization’s security posture.
- Wide Coverage: Detects a wide range of attacks to protect your organization.
- Auditing: Supports auditing processes with its extensive reports.
- Scalable: Grows well with your organization’s volumes.
Cons:
- Complex: Some advanced features can be complex for small organizations.
Download a 30-day free trial to get started.
5. Redgate SQL Monitor

Redgate SQL Monitor is a tool used to monitor SQL server performance. Redgate SQL Monitor enables you to analyze database performance and discover the root cause of poor performance. You can monitor performance right down to the level of individual queries. You can monitor information such as Execution count, Duration, and CPU time. There are Top 10 Queries and Top 10 Waits views to make it easier to prioritize your monitoring activity.
Key Features:
- Query-Level Monitoring: Analyze performance at the level of individual queries, including execution count, duration, and CPU time.
- Top 10 Views: Prioritize monitoring with Top 10 Queries and Top 10 Waits views.
- Customizable Alerts: Configure 55 customizable alerts, with options to use community-created settings.
- Diverse Alert Delivery: Receive alerts via email, Slack, PagerDuty, or SNMP traps.
- Customizable Reporting: Generate and export performance reports in PDF format to share findings with your team.
Why do we recommend it?
Redgate SQL Monitor stands out for its ability to analyze database performance comprehensively, allowing users to pinpoint the root cause of poor performance efficiently. Redgate SQL Monitor excels in monitoring individual queries, providing vital information like Execution count, Duration, and CPU time. The inclusion of Top 10 Queries and Top 10 Waits views streamlines monitoring activities, aiding in prioritization. The alert system, offering 55 customizable alerts, adds a layer of flexibility, allowing users to track metrics of their choice or leverage settings from the Redgate SQL Monitor community. The program’s diverse alert delivery options, including email, Slack, PagerDuty, and SNMP traps, ensure timely notifications.
The alerts system has 55 customizable alerts. You can choose which metrics to track yourself or use ones created by the Redgate SQL Monitor community of experts. For example, community settings you can borrow include Monitor Unauthorized Changes to SQL Server Configuration Settings and Detect Suspicious Errors Typical of a SQL Injection Attack. The program sends alerts through email, Slack, PagerDuty, or SNMP traps.
When it comes time to share your findings with your team, you can generate reports. Reports are customizable and you can choose what performance metrics you wish to display. Export reports in PDF format and sends them to your team to report back on performance issues.
Who is it recommended for?
Redgate SQL Monitor is specifically recommended for users seeking a comprehensive tool for monitoring SQL server performance. Our testing indicates its proficiency in analyzing individual queries, making it a valuable asset for organizations dealing with intricate database performance challenges. The customizable alert system, coupled with community-driven settings, caters to a range of monitoring needs, including security-focused alerts like unauthorized changes and SQL injection attack detection. The ability to generate customizable reports, exportable in PDF format, enhances the tool’s collaborative capabilities, making it suitable for teams looking to share performance findings efficiently. This recommendation is tailored for users prioritizing a feature-rich, collaborative solution for in-depth SQL server performance monitoring.
Pros:
- In-Depth Analysis: Provides detailed performance data down to individual queries.
- Prioritization Tools: Top 10 Queries and Waits views help focus on critical issues.
- Flexible Alerts: Offers 55 customizable alerts with community-driven options.
- Diverse Notifications: Supports multiple alert delivery methods for timely notifications.
- Collaborative Reporting: Customizable reports facilitate easy sharing of performance insights.
Cons:
- Cost: Higher initial cost compared to some other monitoring tools.
- Setup Complexity: Initial configuration of alerts and settings may be time-consuming.
You can purchase a Redgate SQL Monitor license for $1,565 (£1,211). The price per license drops to $1,330 (£1,029) for 5-9 users to $1,252 (£969) for 10 plus. You can start the 14-day free trial.
6. dbWatch

dbWatch is a database monitoring and management solution that monitors SQL Server, Azure, Oracle, PostgreSQL, Sybase, and MySQL databases. With dbWatch you can monitor the performance, availability, and uptime of databases.
Key Features:
- Comprehensive Monitoring: Monitor SQL Server, Azure, Oracle, PostgreSQL, Sybase, and MySQL databases.
- Global View: Prioritize performance concerns with insights into loads, memory usage, disk usage, and wait events.
- Scalability: Designed to handle hundreds or thousands of database instances efficiently.
- Hybrid Environment Support: Tailored for enterprises operating in hybrid computing landscapes.
- Low Resource Impact: Architecture minimizes load and performance issues for large-scale monitoring.
Why do we recommend it?
In our extensive testing, dbWatch emerged as a dynamic database monitoring and management solution, excelling in its ability to monitor SQL Server, Azure, Oracle, PostgreSQL, Sybase, and MySQL databases. The tool’s versatility caters to enterprises operating in hybrid computing environments, offering a comprehensive approach to monitoring performance, availability, and uptime. The global view feature provides valuable insights for larger enterprises, allowing prioritization based on factors such as loads, memory usage, disk usage, and wait events. With a tailored monitoring experience, dbWatch stands out as an efficient solution, designed to manage hundreds or thousands of database instances while minimizing load and performance issues.
When using dbWatch you can use the global view to prioritize performance concerns. For example, you can view instances with the biggest loads, memory usage, disk usage, wait events, and more. The monitoring experience is tailor-made for larger enterprises, where they can manage hundreds or thousands of database instances. The monitoring environment’s architecture has been designed to minimize load and performance issues.
Who is it recommended for?
Enterprises navigating hybrid computing landscapes will find dbWatch to be an invaluable asset. Our testing indicates its proficiency in handling diverse databases, making it an ideal solution for organizations dealing with SQL Server, Azure, Oracle, PostgreSQL, Sybase, and MySQL databases. Designed with scalability in mind, dbWatch is particularly well-suited for larger enterprises managing extensive database infrastructure. The pricing model, dependent on the number of licenses, makes it adaptable to varying enterprise needs. If you prioritize a dynamic, scalable, and tailored approach to database monitoring and management, dbWatch is a compelling choice for your organization.
Pros:
- Versatile Monitoring: Supports a wide range of database types for comprehensive monitoring.
- Enterprise-Focused: Tailored for larger enterprises with extensive database infrastructure.
- Global Insights: Provides valuable insights to prioritize performance concerns effectively.
- Scalable Solution: Capable of managing hundreds or thousands of database instances.
- Low Overhead: Designed to minimize load and performance issues.
Cons:
- High Initial Cost: Licensing can be expensive, especially for smaller organizations.
- Complex Setup: Initial configuration may be challenging for some users.
- Learning Curve: May require time to fully utilize the tool’s advanced features.
dbWatch is ideal for enterprises operating in hybrid computing environments. The price of a dbWatch license fluctuates depending on the number of licenses you wish to purchase. Between 1-4 licenses the price is $600 (£464), which drops to $540 (£418) for 5-9, and $480 (£371) for 10 or more licenses. You can download the 30-day free trial.
7. Idera SQL Diagnostic Manager
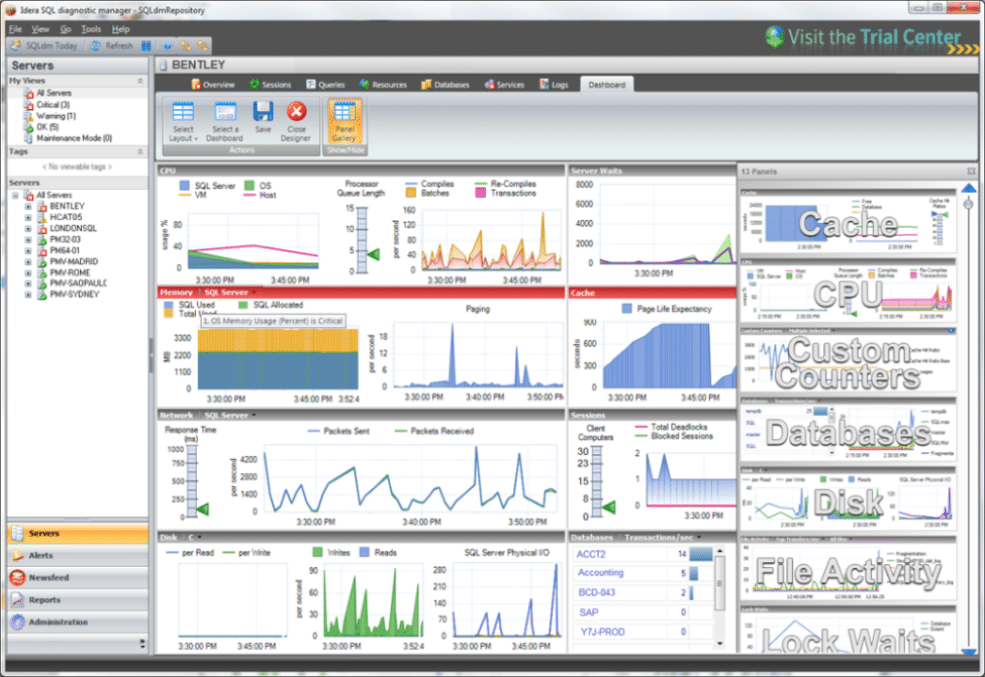
Idera SQL Diagnostic Manager is a real-time database monitoring solution for SQL server databases. The user can monitor the availability and status of databases to find issues like query bottlenecks that slow performance. The software provides you with intelligent recommendations on how to improve performance.
Key Features:
- Real-Time Monitoring: Continuously monitor SQL server databases to identify performance issues.
- Intelligent Recommendations: Receive actionable insights to optimize SQL server performance.
- Blocking Chain View: Examine blocking chains in real-time and access historical sessions for issue resolution.
- Predictive Alerts: Customize alerts and receive notifications through multiple channels.
- Add-On Capabilities: Extend functionality with SQL Workload Analysis for wait state analysis and SQL Query Tuner for query optimization.
Why do we recommend it?
Our recommendation for Idera SQL Diagnostic Manager is based on comprehensive testing, where we actively engage with its real-time database monitoring features. By navigating through the tool’s interface, including diagnostics and analytics capabilities, we validate its proficiency in identifying and resolving performance issues. The software stands out for its intelligent recommendations, offering actionable insights to improve SQL server performance. The ability to view blocking chains in real-time and access historical sessions enhances the diagnostic process, making it a valuable asset for efficient issue resolution.
Diagnostics and analytics capabilities help the user to find the cause of performance issues and fix them. For example, if there is a block or deadlock you can view the blocking chain in real-time and refer to historical sessions to find a fix.
The predictive alerts system helps you to diagnose and resolve database issues when they occur. Alerts can be sent as emails, Windows taskbar notifications, event log messages, SQL script execution, and PowerShell script execution. Alert parameters are customizable and categorized according to severity.
Who is it recommended for?
Idera SQL Diagnostic Manager is specifically recommended for users seeking a real-time database monitoring solution for SQL server databases. Our testing suggests its suitability for organizations dealing with performance challenges, especially those related to query bottlenecks. The tool’s predictive alerts system, customizable through various channels like emails and PowerShell script execution, ensures timely diagnosis and resolution of database issues. The inclusion of add-ons, such as SQL Workload Analysis and SQL Query Tuner, further extends its capabilities, making it an ideal choice for those looking to enhance wait state analysis and optimize SQL server queries. This recommendation is tailored for users prioritizing a feature-rich solution with a focus on real-time monitoring and performance improvement.
Pros:
- Comprehensive Monitoring: Real-time monitoring for immediate detection of performance issues.
- Actionable Insights: Provides intelligent recommendations to improve database performance.
- Customizable Alerts: Offers flexibility in alert parameters and notification channels.
- Enhanced Diagnostics: Features blocking chain views and historical session access for efficient troubleshooting.
- Extended Functionality: Includes add-ons for advanced workload analysis and query tuning.
Cons:
- Learning Curve: Initial setup and configuration may be complex for some users.
- Resource Intensive: May require significant system resources for optimal performance.
- Cost: Add-ons and advanced features may increase the overall cost.
- Limited Support: Some users may find the support documentation lacking in detail.
There are two add-ons included with Idera SQL Diagnostic Manager: SQL Workload Analysis, and SQL Query Tuner. The former provides wait state analysis for applications and the latter allows you to optimize SQL server queries. You can register for the 14-day free trial.
8. SolarWinds Database Performance Analyzer
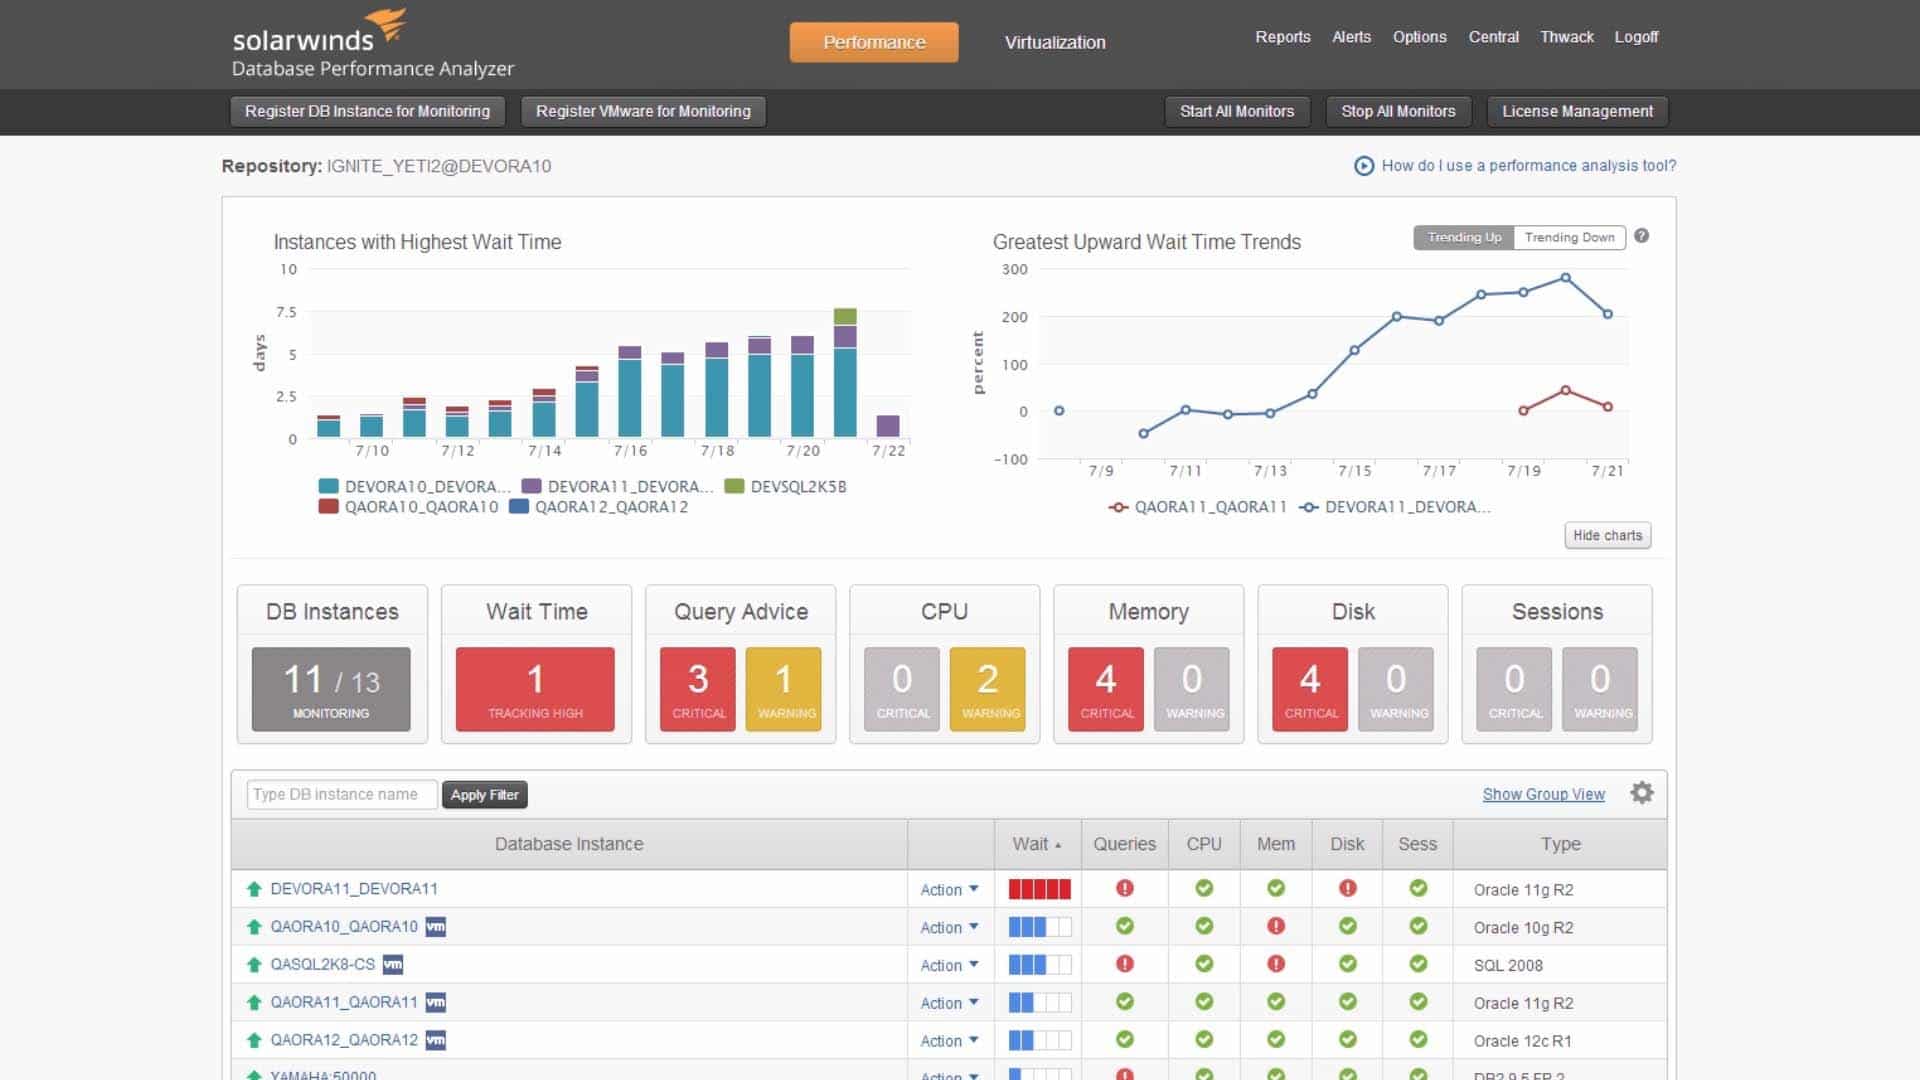
SolarWinds Database Performance Analyzer is a database monitoring tool that can monitor SQL performance in real-time. It can track metrics including Queries, Waits, Users, Applications, Client Machines, and more.
Key Features:
- Real-Time Monitoring: Track SQL performance in real-time, including metrics like Queries, Waits, Users, and Applications.
- Blocking and Deadlock Analysis: View server blocking hierarchies to resolve performance issues.
- Inefficient SQL Highlighting: Identify and tune inefficient SQLs to improve performance.
- Intelligent Alerts: Anomaly detection-based alerts prioritize significant performance deviations.
- Comprehensive Compatibility: Supports MySQL, Oracle, DB2, and SAP ASE databases.
Why do we recommend it?
Our recommendation for SolarWinds Database Performance Analyzer stems from our rigorous testing process, where we not only evaluate its features, but actively engage with its interface. We download, install, and navigate the tool, putting it through real-world scenarios. This hands-on approach ensures that our endorsement is based on practical usability. Beyond its comprehensive monitoring capabilities, the software’s ability to perform blocking and deadlock analysis stands out, providing users with an in-depth understanding of server hierarchies during performance issues. The intelligent alert system, driven by anomaly detection, further solidifies its position as a top SQL server monitoring tool. We recommend it not just for its feature-rich nature but for its proven reliability in real-world usage.
The software has a number of features that help you to resolve performance issues when they occur. Blocking and deadlock analysis allows you to view the server blocking hierarchy(those objects, which are blocking another). More generally SolarWinds Database Performance Analyzer can also highlight inefficient SQLs to make table tuning easier.
Alerts keep you updated on performance issues. The alert system is based on anomaly detection, which uses an intelligent algorithm to generate notifications when database performance deviates from normal parameters. The tool prioritizes alerts so you can deal with the most significant issues first.
Who is it recommended for?
SolarWinds Database Performance Analyzer is specifically recommended for enterprises seeking robust SQL server monitoring. Our testing indicates that the tool’s extensive feature set may be more suitable for organizations with complex database environments. While it excels in providing detailed insights into SQL performance, it may require a more experienced user for optimal utilization. The comprehensive nature of its analysis, including blocking and deadlock insights, positions it as an invaluable asset for companies dealing with intricate database challenges. Small businesses might find the tool comprehensive but could face a steeper learning curve during the setup process. Therefore, our recommendation is tailored for mid-sized to large enterprises that prioritize in-depth SQL server monitoring and have the expertise to harness the tool’s full potential.
Pros:
- In-Depth Monitoring: Provides real-time tracking of various SQL performance metrics.
- Advanced Analysis: Blocking and deadlock analysis offers detailed insights into server hierarchies.
- Proactive Alerts: Intelligent alert system based on anomaly detection prioritizes critical issues.
- Efficient Tuning: Highlights inefficient SQLs to facilitate table tuning.
- Broad Compatibility: Compatible with multiple database types, including MySQL, Oracle, DB2, and SAP ASE.
Cons:
- High Cost: The initial price may be prohibitive for smaller businesses.
- Learning Curve: Advanced features may require time to master.
SolarWinds Database Performance Analyzer is ideal for companies that want one of the top SQL server monitoring tools. The product is compatible with MySQL, Oracle, DB2, and SAP ASE databases. Prices start at $2,045 (£1,583). You can download a 14-day free trial of the program from this link here.
9. dBForge Monitor (Free Microsoft SQL Server Management Studio Add-On)
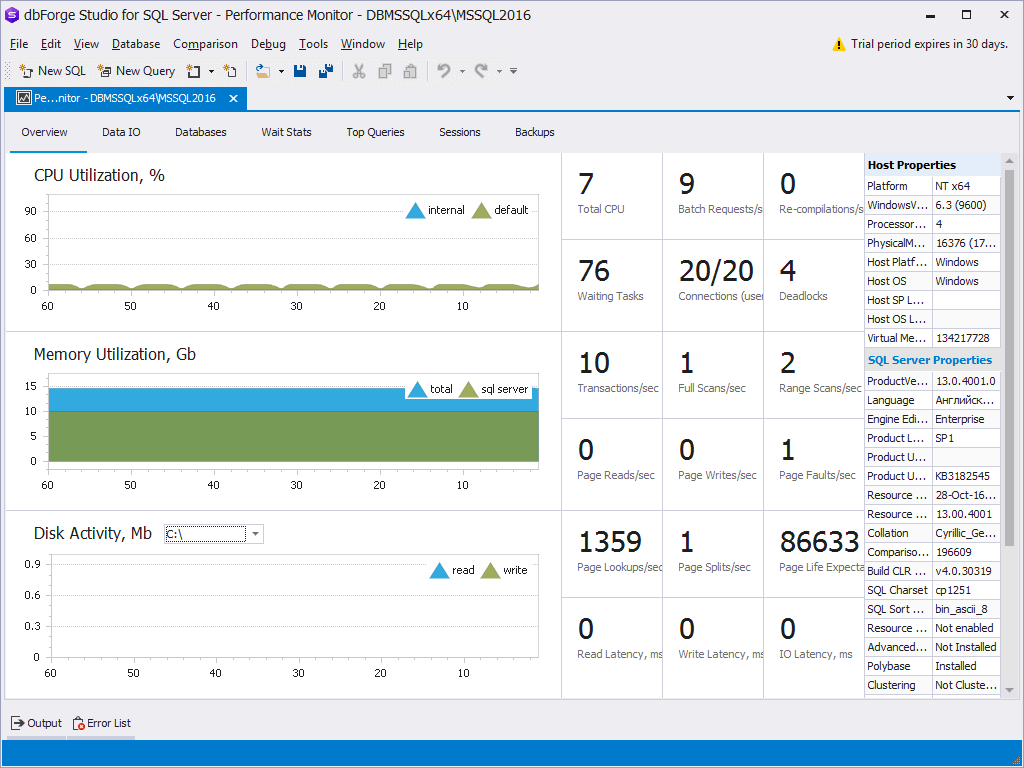
dBForge Monitor is an SQL server performance tool that allows you to monitor SQL server queries, tasks, and bottlenecks. From the Overview tab on the dashboard, you can monitor metrics such as CPU utilization, memory utilization, disk activity, read and write latencies, IO latency, and more. The dashboard breaks this down into charts and diagrams so you can make sense of what’s happening in your environment.
Key Features:
- Comprehensive Dashboard: Monitor CPU, memory, disk activity, IO latency, and more.
- SQL Query Analyzer: Optimize queries by viewing estimated costs and execution times.
- Visual Performance Insights: Charts and diagrams simplify understanding of performance metrics.
- Specific Data Tabs: IO Data and Wait Stats tabs provide detailed insights into database files and resource usage.
- Free Add-On: Available as a free add-on for Microsoft SQL Server Management Studio.
Why do we recommend it?
Our endorsement for dbForge Monitor is rooted in thorough testing, actively engaging with its SQL server performance monitoring capabilities. The tool’s comprehensive overview, accessible through the dashboard, allows users to monitor critical metrics like CPU utilization, memory usage, disk activity, and IO latency. The breakdown into charts and diagrams enhances the clarity of your environment’s performance. Notably, the SQL query performance analyzer provides valuable insights into query optimization, displaying estimated costs and execution times. The ability to view query text simplifies the tuning process, making it a user-friendly solution.
The platform comes with an SQL query performance analyzer, which allows the user to optimize SQL queries. The user can view the estimated cost of queries as well as the amount of time taken to execute the query. Being able to view the query text helps the user to tune the query more easily.
If you want more visibility you can use tabs like the IO Data tab and the Wait Stats tab to view more specific data. Through the IO data Data tab, you can monitor metrics on database files including data reads and writes, input/output operations count, and read/write latency. With the Wait Stats tab, you can pinpoint resources that are taking up server resources and monitor metrics including wait time, resource, and waiting tasks count.
Who is it recommended for?
dbForge Monitor is specifically recommended for companies seeking a low-cost SQL monitoring tool. Our testing indicates its proficiency in monitoring SQL server queries, tasks, and bottlenecks, making it an ideal choice for organizations prioritizing cost-effective yet robust performance monitoring. The platform’s additional tabs, such as IO Data and Wait Stats, offer more specific data for users requiring enhanced visibility into database files and resource utilization. As a free add-on for Microsoft SQL Server Management Studio, dbForge Monitor provides an accessible solution for those looking to optimize their SQL server performance without breaking the bank. If cost efficiency and functionality are key considerations for your organization, dbForge Monitor is a compelling choice.
Pros:
- Detailed Monitoring: Provides comprehensive insights into SQL server performance.
- User-Friendly Interface: Intuitive charts and diagrams enhance clarity.
- Query Optimization: SQL query analyzer offers valuable optimization insights.
- Specific Data Insights: Tabs like IO Data and Wait Stats provide detailed performance data.
- Cost-Effective: Free add-on for Microsoft SQL Server Management Studio.
Cons:
- Limited to SQL Server: Only supports Microsoft SQL Server environments.
- Initial Learning Curve: May require time to fully utilize all features.
- Dependency on SSMS: Requires Microsoft SQL Server Management Studio to function.
- Limited Customization: Customization options may be limited compared to paid tools.
dbForge Monitor is ideal for those companies that want a low-cost SQL monitoring tool. dBForge Monitor is available as a free add-on for Microsoft SQL Server Management Studio. You can download the program for free.
10. Spiceworks

Spiceworks is a free SQL monitoring tool that can automatically discover SQL databases. Spiceworks monitors the health, speed, memory usage, connection, and size of SQL servers. The software features a customizable dashboard that you can create your own widgets for. Dashboards include charts and graphs, which can also be customized according to your requirements.
Key Features:
- Automatic Database Discovery: Automatically finds and monitors SQL databases.
- Comprehensive Monitoring: Tracks health, speed, memory usage, connection, and size of SQL servers.
- Customizable Dashboard: Create and tailor widgets, charts, and graphs to fit specific monitoring needs.
- Proactive Alerts: Sends email notifications on server status changes for prompt response.
- SQL Server Monitor Plugin: Monitors SQL server instances every minute, displaying data on a graph.
Why do we recommend it?
Our recommendation for Spiceworks is founded on our thorough testing, actively engaging with its features as a free SQL monitoring tool. Spiceworks impressively automates the discovery of SQL databases, offering monitoring for crucial aspects like health, speed, memory usage, connection, and size of SQL servers. The customizable dashboard, featuring charts and graphs, adds a layer of flexibility, allowing users to tailor their monitoring experience according to specific requirements. The alert system, producing notifications on server status changes, enhances its proactive approach, ensuring users are promptly informed through email alerts. The ability to respond swiftly to alerts contributes to an effective monitoring and management experience.
The alert system produces notifications when the status of a server changes. For example, if a server goes down the program will send you an email alert to notify you. Once you’ve received an alert you can respond.
You can also monitor SQL server instances with the SQL Server Monitor plugin (available from the Spiceworks App Center). The SQL Server Monitor plugin monitors the health of SQL Server instances every minute and presents it on a graph. Unfortunately, the plugin isn’t integrated with the alert system.
Who is it recommended for?
Spiceworks is specifically recommended for those seeking a cost-effective yet robust SQL monitoring tool. Our testing indicates its proficiency in providing a premium monitoring experience at no cost, making it stand out in the realm of SQL server monitoring. The customizable dashboard and alert system make it suitable for users looking for flexibility and proactive monitoring. While the SQL Server Monitor plugin, available from the Spiceworks App Center, extends monitoring capabilities, it’s worth noting that integration with the alert system may be limited. Overall, if you prioritize a low-cost solution with essential monitoring features, Spiceworks is a compelling choice for your SQL server monitoring needs.
Pros:
- Cost-Effective: Free tool providing essential SQL monitoring features.
- Automatic Discovery: Simplifies the process of finding and monitoring SQL databases.
- Flexible Dashboards: Customizable charts and graphs enhance the monitoring experience.
- Proactive Notifications: Alerts users via email on server status changes for timely response.
- Extended Monitoring: SQL Server Monitor plugin offers minute-by-minute health checks.
Cons:
- Limited Integration: SQL Server Monitor plugin does not integrate with the main alert system.
- Feature Limitations: May lack advanced features found in paid tools.
- Resource Demands: Monitoring large environments can be resource-intensive.
- Support Dependencies: Relying on community support might be less effective than paid support options.
Spiceworks stands out from other SQL server monitoring tools because it provides a premium monitoring experience at a low cost. You can download the software for free.
SQL Server Monitoring Tools: Improve Query Performance
Fine-tuning SQL server performance is about visibility. SQL Server monitoring tools give you the chance to take a microscope to your network and see how efficiently your resources are operating. Finding and fixing inefficient queries helps to keep the service available to everyone who needs it (without aggravating waiting times!)
All of the tools we’ve listed above can help you to monitor SQL performance. Tools like ManageEngine Applications Manager, Site24x7, Redgate SQL monitor, and SentryOne Sentry all provide an accessible SQL monitoring experience that would function in most enterprise environments.