
In the realm of coding, time is money. The more time and resources it takes to process a program, the higher the overall financial cost to run that program. Having a tool like a Python profiler at your disposal is essential for identifying inefficient code and eliminating it so that you can optimize performance. In this article, we’re going to look at what a Python profiler is, how to use them, and some top tools for Python monitoring.
Here is our list of the best application performance monitoring tools and Python profilers:
- Datadog EDITOR’S CHOICE Cloud-based, real-time Python application monitoring, and anomaly detection.
- New Relic Customizable dashboards and alerts for comprehensive Python performance insights.
- AppDynamics Offers real-time monitoring and an API for Python applications.
- Yappi Profiling multi-threaded Python applications with various time measurements.
- Pyinstrument Uses wall-clock time for detailed Python code and web request monitoring.
What is a Profile and What is a Python Profiler?
In Python, a profile is a set of statistics that describe how often and how long parts of a program are executed. The process of measuring where a program spends the most time and resources is called profiling.
With a Python profiler, you can start profiling code to measure how long your code takes to run and find inefficient code segments to fix.
Python includes three modules for profiling (though it’s important to note there are many other third-party profilers you can use):
- cProfile – A built-in Python module and C extension that you can use to measure function calls and program execution time. It measures process CPU by default. Suitable for profiling long-running programs
- profile – A Python module with significant overhead.
- hotshot – An experimental C module with reduced overhead and longer post-processing times (no longer maintained)
All of the metrics you collect with cProfile and profile can be exported as reports through the pstatsmodule. Before we look at the profilers above in more detail, we’re going to briefly look at the types of profilers.
Why do I need a Python Profiler?
A Python profiler is vital for measuring speed and identifying performance bottlenecks that limit the speed of your programs. By using a profiler you can see where a program is spending most of its time (such as functions and sub-functions) at the code-level, and then make improvements to make it run more efficiently.
For example, if you find that a program is running slowly and queries take a long time to complete, you can use a Python profiler to analyze the code and identify the root cause so that you can fix it.
Many enterprises use profilers to eliminate potential program issues during development and to produce efficient applications during production. One of the key advantages of using a profiler is that it shows you which code you need to optimize so you can address performance issues faster without having to search for issues manually.
Types of Profilers: Deterministic vs Statistical
If you want to monitor the efficiency of a Python program and its code, there are two main types of profilers you can use:
- Deterministic – Monitors all function calls, function returns, and reception events, and records precise timings for the intervals between these events. Useful for measuring overall performance but makes code run slower and is usually unsuitable in production environments.
- Statistical – Monitors application performance by periodically collecting call stack snapshots or samples of the execution state, which can be used to determine the execution time of an application. Statistical profiling decreases accuracy by providing limited indications on where time is being spent but reduces system overhead.
Choosing between the two methodologies is about deciding whether you’d rather limit profiling overhead when measuring code or maximize accuracy. Deterministic profiling provides you with a vast amount of performance data, which increases the accuracy of coding analysis but carries a lot of system overhead as a result.
In contrast, statistical profiling decreases overhead by periodically sampling the program’s execution state. However, the more lightweight sampling of statistical profiling decreases accuracy. Most of the time, lower resource consumption makes this method more suitable in production environments.
What Metrics Should I Monitor?
There are many different metrics you can monitor when using a Python profiler. Some of the key metrics you’ll want to profile include speed, call frequency, line profiling, and memory usage:
- Speed – How much time It takes to execute each method. In cProfile you can collect speed metrics such as calls (number of calls), tottime (total time spent in a function), and cumtime (cumulative time spent in a function).
- Call frequency – The number of calls made on a method can have a large impact on performance if it’s called too frequently. Measuring the number of calls tells you how much the service is used.
- Line profiling – The process of monitoring your Python code line by line for timing (and other) metrics.
- Memory usage – Monitoring memory usage is useful for helping you to optimize storage. Memory can be monitored through the pympler and objgraph libraries.
How to Profile with cProfile
As mentioned above, cProfile is a built-in Python module and deterministic profiler, which makes it one of the most popular profiling solutions for Python developers. To use cProfile to monitor code you can use the run() function. The function has the following syntax:
cProfile.run(statement, filename=None, sort=-1)
To import cProfile and use the run function you need to enter the following:
import cProfile

Import re

cProfile.run(‘re compile("foo|bar")')
After entering the command the profiler will produce output listing the number of function calls and primitive calls, and how long they took to run. Below the function call summary, you can view a more detailed table on functions, sub-functions, and calls. We’ve briefly broken down the metrics below (please note there are two variants of the per-call metric):
- ncalls – number of calls made
- tottime – total time taken by the function
- percall – total time and number of calls
- cumtime – cumulative time spent (including all sub-functions)
- percall – cumtime divided by primitive calls
- Filename:lineno(function) – Provides data on each function
In the ncalls column, you will sometimes see two numbers listed when the function recursed, which is formatted as 4/1. The numbers tell you the total number of calls and the number of primitive calls. It’s important to note that if there is no recursed function then the two values are the same, and are represented by a single figure.
You can also create more advanced scripts and sort by parameters such as calls, cumulative, cumtime, file, and ncalls to reduce the amount of white noise and view more relevant performance metrics.
Monitoring Python Performance with Application Monitoring Tools and Alternative Profilers
In this section, we’re going to look at some of the alternative solutions you can use to monitor Python performance. We’re going to look at a mixture of application performance monitoring solutions with Python support and some alternative profilers you can use to monitor your programs.
Our methodology for selecting Python performance monitoring tool:
We’ve broken down our analysis for you based on these key criteria:
- Compatibility with Python applications.
- Real-time monitoring capabilities.
- User-friendly dashboard and visualization tools.
- Alert system efficiency and accuracy.
- Overall impact on application performance.
In many scenarios, application performance monitoring tools are beneficial for monitoring the performance of Python applications because they have minimal impact on performance. We’ve listed some of the top application performance monitoring tools and Python profilers below.
1. Datadog

Datadog is a cloud monitoring tool that you can use to measure Python code performance. With Datadog you can monitor Python applications for code-level errors and latency in real-time with real-time service maps. Metrics you can collect include availability, response time, error rates, and throughput. Graphs provide you with a timeline of application events so you can easily monitor performance fluctuations over time.
Key Features:
- Real-time service map
- Graphs
- Log collection
- Alerts
- Mobile app
Why do we recommend it?
Datadog is recommended for its comprehensive, real-time monitoring capabilities. It stands out for its ability to track Python application performance, offering detailed insights with service maps, graphs, and an effective alert system.
Centralized log collection provides you with a library of data you can use to investigate performance issues. Collected logs are searchable so you can troubleshoot and analyze log patterns efficiently.
If an application starts to experience latency then Datadog sends you an alert. The alerts system uses machine learning for anomaly detection so it can automatically identify performance anomalies and produce notifications. Notifications are available via
Slack, Hangouts Chat, Microsoft Teams, and the Datadog mobile app (for Android and iOS).
Who is it recommended for?
Datadog is ideal for organizations needing robust, real-time monitoring of Python applications. Its detailed log collection and alert systems make it suitable for enterprises that prioritize quick identification and resolution of performance issues.
Pros:
- Real-time Python application monitoring.
- Detailed service maps and graphs for performance insights.
- Centralized log collection aids efficient troubleshooting.
- Advanced alert system with machine learning for anomaly detection.
- Mobile app for monitoring on the go.
Cons:
- The pricing might be high for smaller teams or individual developers.
Datadog is a very convenient option if you want to simplify the process of monitoring Python performance with the help of anomaly detection. The APM package starts at $31 (£23.80) per host, per month. You can sign up for the 14-day free trial.
EDITOR'S CHOICE
Datadog is our top network monitor for Python applications because of its comprehensive real-time monitoring capabilities. Its service maps and graphs provide instant visual feedback on application performance. The centralized log collection is a standout feature, allowing efficient troubleshooting and pattern analysis. With machine learning-based anomaly detection, Datadog ensures that performance issues are promptly identified and addressed. The convenience it offers in monitoring Python performance, coupled with its user-friendly mobile app, makes it an excellent choice. Datadog is cloud-based and compatible with various platforms like Slack and Microsoft Teams.
OS: Cloud-based
2. New Relic
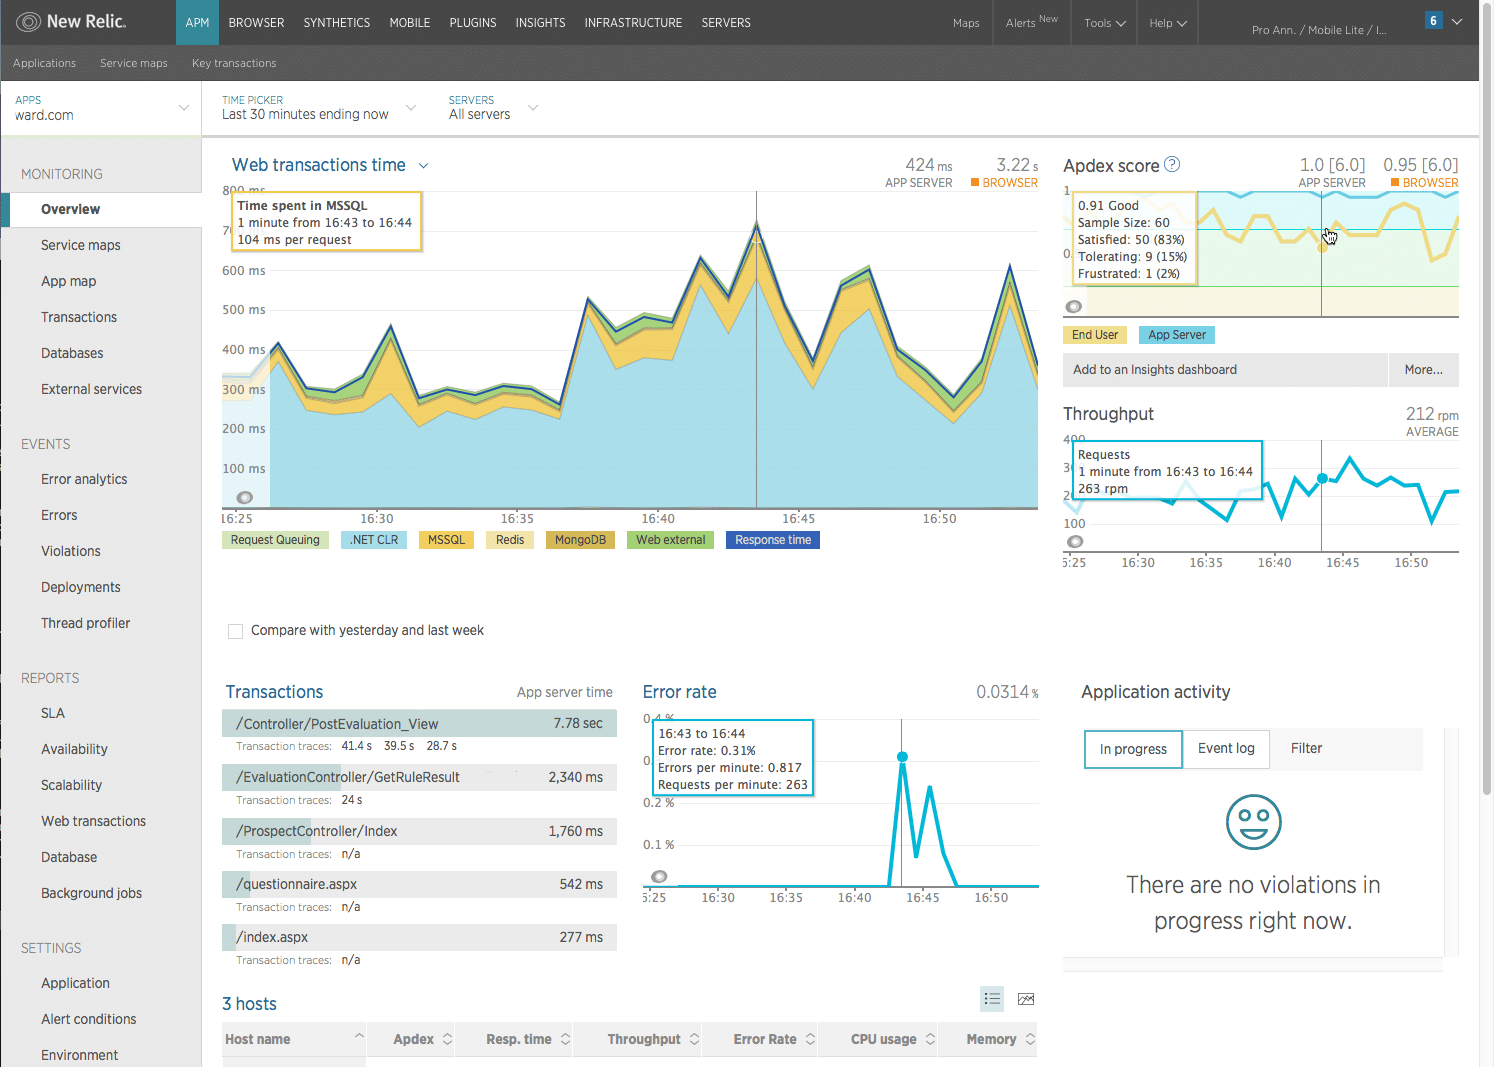
New Relic is an application performance monitoring tool with Python application monitoring. With New Relic, you can monitor code-level performance and gather metrics such as response time, Apdex score, throughput, web transactions, error rate, and recent events.
Key Features:
- Python monitoring
- Custom dashboards
- Graphs and charts
- Anomaly detection
Why do we recommend it?
New Relic is recommended for its versatile Python monitoring capabilities and customizable dashboards. It excels in visualizing performance trends, making it easier to understand and optimize Python application performance.
Custom dashboards provide you with a personalized vantage point of your monitoring environment. Visualization options like graphs and charts help to visualize performance trends. You also have the option to assign permissions to dashboards (Public – Read and write, Public – Read-only, and Private) to determine who can access performance data.
An alerts system identifies performance anomalies and notifies you about application errors when they occur. Notifications are available by Slack messages, messages, OpsGenie, push notifications, and more.
Who is it recommended for?
This tool is recommended for developers and teams seeking detailed performance insights with customizable views. New Relic is well-suited for environments where personalized monitoring and alerting are crucial.
Pros:
- In-depth Python application monitoring.
- Customizable dashboards enhance user experience.
- Effective anomaly detection for proactive issue resolution.
Cons:
- The complexity of features might be overwhelming for beginners.
New Relic is one of the top application performance monitoring tools with ample support for Python monitoring. There is a free version that supports one full access user with 100 GB per month of free data ingest. Paid versions start at $99 (£76.04) per additional user per month for the Standard package. You can sign up for free.
3. AppDynamics

AppDynamics is a SaaS-based application performance monitoring solution with code-level diagnostics for Python. With AppDynamics you can monitor the response times of Python applications in real-time. If this isn’t enough, you can use the API to add additional monitoring functions to monitor Python programs.
Key Features:
- Code-level diagnostics
- Custom dashboard
- API
- Anomaly detection
- Alerts
Why do we recommend it?
AppDynamics is recommended for its real-time monitoring and extensive API, allowing for tailored Python application performance tracking. Its machine learning-driven anomaly detection is a key feature for automatic issue identification.
Machine learning-driven anomaly detection enables the software to automatically identify performance anomalies and create notifications to let you know there’s an issue. The feature includes automated root cause analysis to show you what caused the issue to occur. There is also the option to create custom alert conditions to determine when the software creates an alert.
A customizable dashboard gives you control over how you monitor your environment and what metrics you prioritize. High-quality graphs and charts provide you with visual indicators of performance trends.
Who is it recommended for?
Ideal for enterprises requiring custom monitoring solutions, AppDynamics caters to those who need advanced, real-time insights and automated problem detection in their Python applications.
Pros:
- Automated anomaly detection and alerts.
- Customizable dashboards for tailored insights.
- Offers a free trial for initial evaluation.
Cons:
- Pricing information is not readily available, requiring direct contact.
AppDynamics is a superb application performance monitoring solution if you want to monitor Python applications with the support of anomaly detection. To view pricing information, you need to contact the company directly to request a quote. You can start the 15-day free trial.
4. Yappi
Yappi is an alternative Python profiler, written in C, which offers profiling for multi-threaded applications and CPU time. Yappi is easy to use, and you can run scripts to generate output displaying the name of called functions, CPU time spent on individual functions, how many times the function is called, how much time the function has spent on average, and more.
Key Features:
- Written in C
- Multi-threaded profiling and CPU time profiling
- Measure with CPU time and wall time
- Save profile results in call grind or pstats format
Why do we recommend it?
Yappi is recommended for its proficiency in profiling multi-threaded Python applications, offering detailed insights into CPU time and function performance.
The output is displayed in a table format so you can easily view performance metrics for multiple functions in one place. Once you’ve collected performance data you can save the output in callgrind or pstats format for further analysis.
You can also change how you measure the time spent on functions, by adjusting the clock type. There are two clock types to choose from: CPU time and Wall time. CPU time is the amount of time a CPU was used to process a computer program, and wall time is the time taken from when a program started, to when it finished.
Who is it recommended for?
Yappi is particularly suitable for developers working with multi-threaded Python applications who need detailed profiling on CPU usage and function performance.
Pros:
- Specialized in multi-threaded application profiling.
- Offers both CPU time and wall time measurements.
- Outputs can be saved in multiple formats for analysis.
Cons:
- Being a C-written tool, it may require additional learning for Python-only developers.
Yappi is suitable for enterprises looking for a free and fast alternative profiler to cProfile. The tool is OS independent and available on all operating systems. You can download it from this link here.
5. Pyinstrument
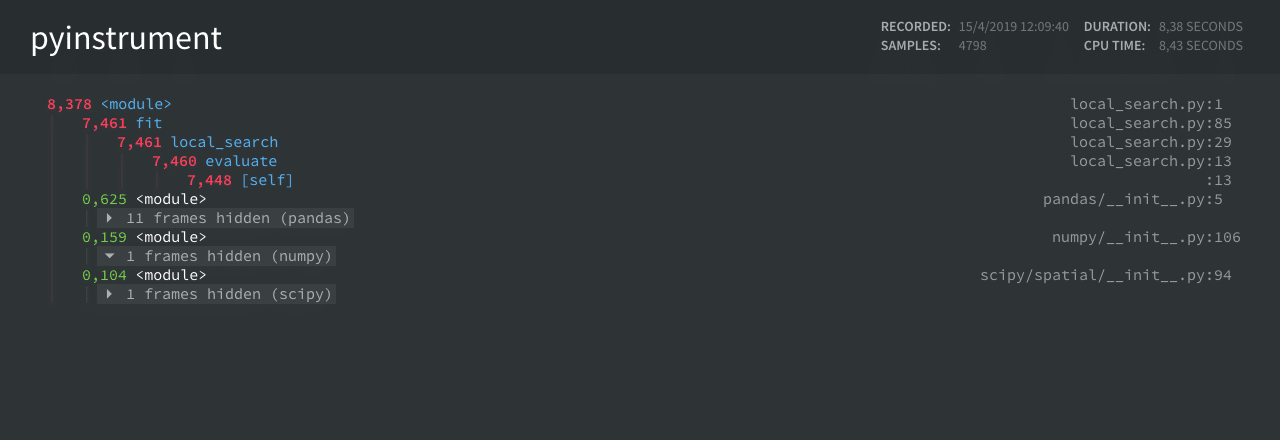
Pyinstrument is a statistical Python profiler you can use to profile code and identify slow code segments. With Pyinstrument you can record the duration of programs with wall clock time. The tool will interrupt the running program at 1ms intervals to collect performance data and view the output in text, json, or HTML format.
Key Features:
- Statistical profiling
- Python API
- Wall-clock time
- Profile code and web requests
Why do we recommend it?
Pyinstrument stands out for its statistical profiling approach, offering low-overhead monitoring of Python applications. Its ability to profile web requests adds to its utility.
On Pyinstrument, you can use the profiler to profile web requests, which you can configure to automatically profile requests and save the HTML output to the profiles folder. The solution also comes with a Python API enabling it to integrate with your existing processes more easily.
Who is it recommended for?
Recommended for those who need a lightweight profiler, Pyinstrument is ideal for developers looking to monitor web requests and applications without significant performance overhead.
Pros:
- Offers Python API for easy integration.
- Capable of profiling web requests.
- Available for multiple operating systems.
Cons:
- Statistical profiling may not provide the same level of detail as deterministic profilers.
Pyinstrument is recommended for enterprises searching for a simple statistical profiler with low overhead. It is available for Windows, macOS, and POSIX. You can download it from this link here.
Python Profiling: An Important Hack for Code Optimization
Profiling your code is a very effective way to optimize the performance of Python programs. Using a profiler like cProfile, Yappi, or Pyinstrument can highlight where most of your computing resources are spent so you can find ways to decrease resource consumption.
If you want more of an automated performance monitoring experience, then application monitoring tools like Datadog, New Relic, and AppDynamics can provide real-time Python code monitoring with features like anomaly detection that notify you about performance issues automatically.

