As the world moves towards cloud computing, more and more businesses are hosting their applications and services online. This has led to a rise in the need for serverless monitoring tools that keep track of the performance of these remote-hosted digital assets.
In this post, we will have a look at serverless monitoring tools to help businesses choose the right solution for their particular cloud computing architectures.
Here is our list of the seven best Serverless Monitoring tools:
- AppOptics Application Performance Monitoring (APM) (FREE TRIAL) A superior product from the leading tech company in the IT monitoring and management solutions realm; this SaaS-based solution is the best choice for in-depth, code-level insights into the whole cloud computing stack. Start a 30-day free trial.
- Site24x7 Serverless Monitoring (FREE TRIAL) Analyze events in near real-time, pinpoint functions status across the board, get in-depth insights into every moving part of the cloud stack; troubleshoot alerts and resolve them using an AI engine. Start a 30-day free trial.
- Datadog Serverless Monitoring Another tool, from another one of the biggest players in the game; immediate discovery of digital assets, automatic monitoring after a quick setup, and easy management of services and applications from one central console – regardless of the architecture – are a few of this tool’s features.
- New Relic Serverless Monitoring This tool delves deep into the transactions and data captured from cloud services to help with the monitoring of the health and performance of the whole architecture; it integrates with hundreds of solutions to cover all aspects of keeping a cloud stack up and running smoothly.
- Dynatrace Serverless Monitoring A tool also from another leading tech company, it scales easily and works well on even the most complex architectures which it can discover, monitor, and manage right out of the box; if that isn’t enough, integration with both local and third-party solutions makes it a powerful tool.
- Lumigo Serverless Monitoring and Troubleshooting Platform A tool with a highly interactive visual map for in-depth analysis and reports with drill-down capabilities to better grasp the overall health of a stack; everything from transactions to databases are covered with this tool that also allows collaboration among team members to tackle issues quickly.
- Dashbird Purpose-built for AWS Lambda deployments and also works with other AWS services; it has its own Amazon Elasticsearch-based analytics capability to process information from across the cloud stack and yet has a tiny digital footprint that won’t affect the performance of the architecture it is running on.
Serverless monitoring – what is it?
Before we can talk about serverless monitoring we will need to discuss serverless computing. So:
Serverless computing is:
- Also known as “serverless” for short or Function as a Service (FaaS).
- When a serverless provider allows users to write and deploy code without the hassle of worrying about the underlying infrastructure.
- An execution model where a cloud service provider is responsible for executing clients’ code by dynamically allocating any additional resources as may be required.
- A method of providing backend services on an “as used” basis, adopting a model where clients only pay when functions are invoked; this means there is no need for any payment upfront in lieu of server software or hardware costs.
Examples of popular serverless computing platforms and service providers include AWS Lambda, Azure Functions, IBM Cloud Functions, and Google Cloud Functions.
It should be noted again here that despite the term “serverless” there are actual servers involved – it is just seamless to the user.
And this brings us to…
Serverless monitoring is:
- Where clients won’t be directly working with their applications and servers, this means they will, to some extent, lose visibility into the performance of their digital assets – both software and hardware. This means they will face issues with directly extracting data for analysis or even deploying their codes.
- Therefore, with the help of serverless monitoring tools, administrators and DevOps teams can have seamless insights into the goings-on in the background.
- They will also be able to manage these resources and get detailed analytics results by way of reports and alerts to make sure no interruptions occur in the background applications and servers that could cause issues for the client-facing front end – examples of which include the services that are being offered on a customer-facing website.
The seven best Serverless Monitoring tools
1. AppOptics Application Performance Management (APM) (FREE TRIAL)

SolarWinds is a leading provider of powerful and affordable IT management and monitoring software solutions. It also offers AppOptics – an application performance monitoring (APM) tool that consists of three sub-applications.
AppOptics is a SaaS-based application performance monitoring solution, and its three cloud-hosted solutions are for:
- Pingdom – uptime and web performance monitoring to make sure no device or service is offline
- Loggly – log monitoring to ensure software and hardware health
- Papertrail – log analytics to help with troubleshooting application or server issues
Now, although users can run these applications individually (as there are stand-alone versions for each) AppOptics as an APM brings them all together as a SaaS-delivered solution to provide wholesome, deep monitoring of assets.
It delivers down-to-the-code insights into application performance, visualization of performance bottlenecks, and helps spot where and when end-user experiences do not meet expected service levels.
On the other hand, the integration of the three tools helps users cut the time, energy, and money wasted on reviewing logs, spotting errors, and putting it all together to find the root causes.
More features include:
- Complete, code-level visibility into the health and performance of applications and the supporting infrastructure.
- AppOptics requires zero configuration with distributed tracing, host, and IT infrastructure monitoring that runs right out of the box.
- It has 150+ integrations and custom metrics that feed into the same dashboard as well as into analytics and alerting pipelines.
- Users can create their own performance metrics to automate the monitoring of mission-critical services and applications that are unique to them.
- They can remotely test websites or apps to identify bottlenecks and ensure critical services are working correctly.
Finally, AppOptics APM is fully scalable and cost-effective while providing end-to-end visibility into all layers of applications, regardless of where they are running – on-premises or in the cloud – and including servers, containers, and virtual instances.
You can try AppOptics Application Performance Management (APM) through a free and fully functional 30-day trial.
2. Site24x7 Serverless Monitoring (FREE TRIAL)

Site24x7 Serverless Monitoring covers the full stack in near real-time. It is used to analyze events timelines and pinpointing what functions were down, or in critical status, during a particular time, for example.
It offers detailed visibility into critical performance parameters like execution times, memory usage, or network egress to ensure everything is working as well as it should.
But, there’s more:
- Users get instant visibility into the performance of the popular FaaS platforms like Azure Functions, AWS Lambda, and Google Cloud Functions.
- Monitoring of hybrid cloud infrastructure can also be done from a single unified console.
- It collects metrics on function activity, code execution time, and errors – the input can then be used to optimize performances.
- It also monitors and measures key performance metrics like invocations, errors, durations, and throttles.
- Administrators can set up alarms – that are triggered by function latencies, code execution bottlenecks, and debug function errors or crashes, for example – and with logging support behind them.
- In fact, it can be set up to trigger automatic notifications based on threshold violations for multiple statistics of the same attribute – cutting root cause analysis times.
- The tool uses an AI engine to help with the identification and detection processes, and once detected, administrators can quickly resolve the issues using Site24x7’s IT Automation
The Site24x7 Serverless Monitoring tool would be ideal for SMBs to mid-large enterprises where their focus would be on the business process side, leaving the IT aspects to cloud service providers. This way, they can still have control over their digital investments.
Get started with a 30-day free trial .
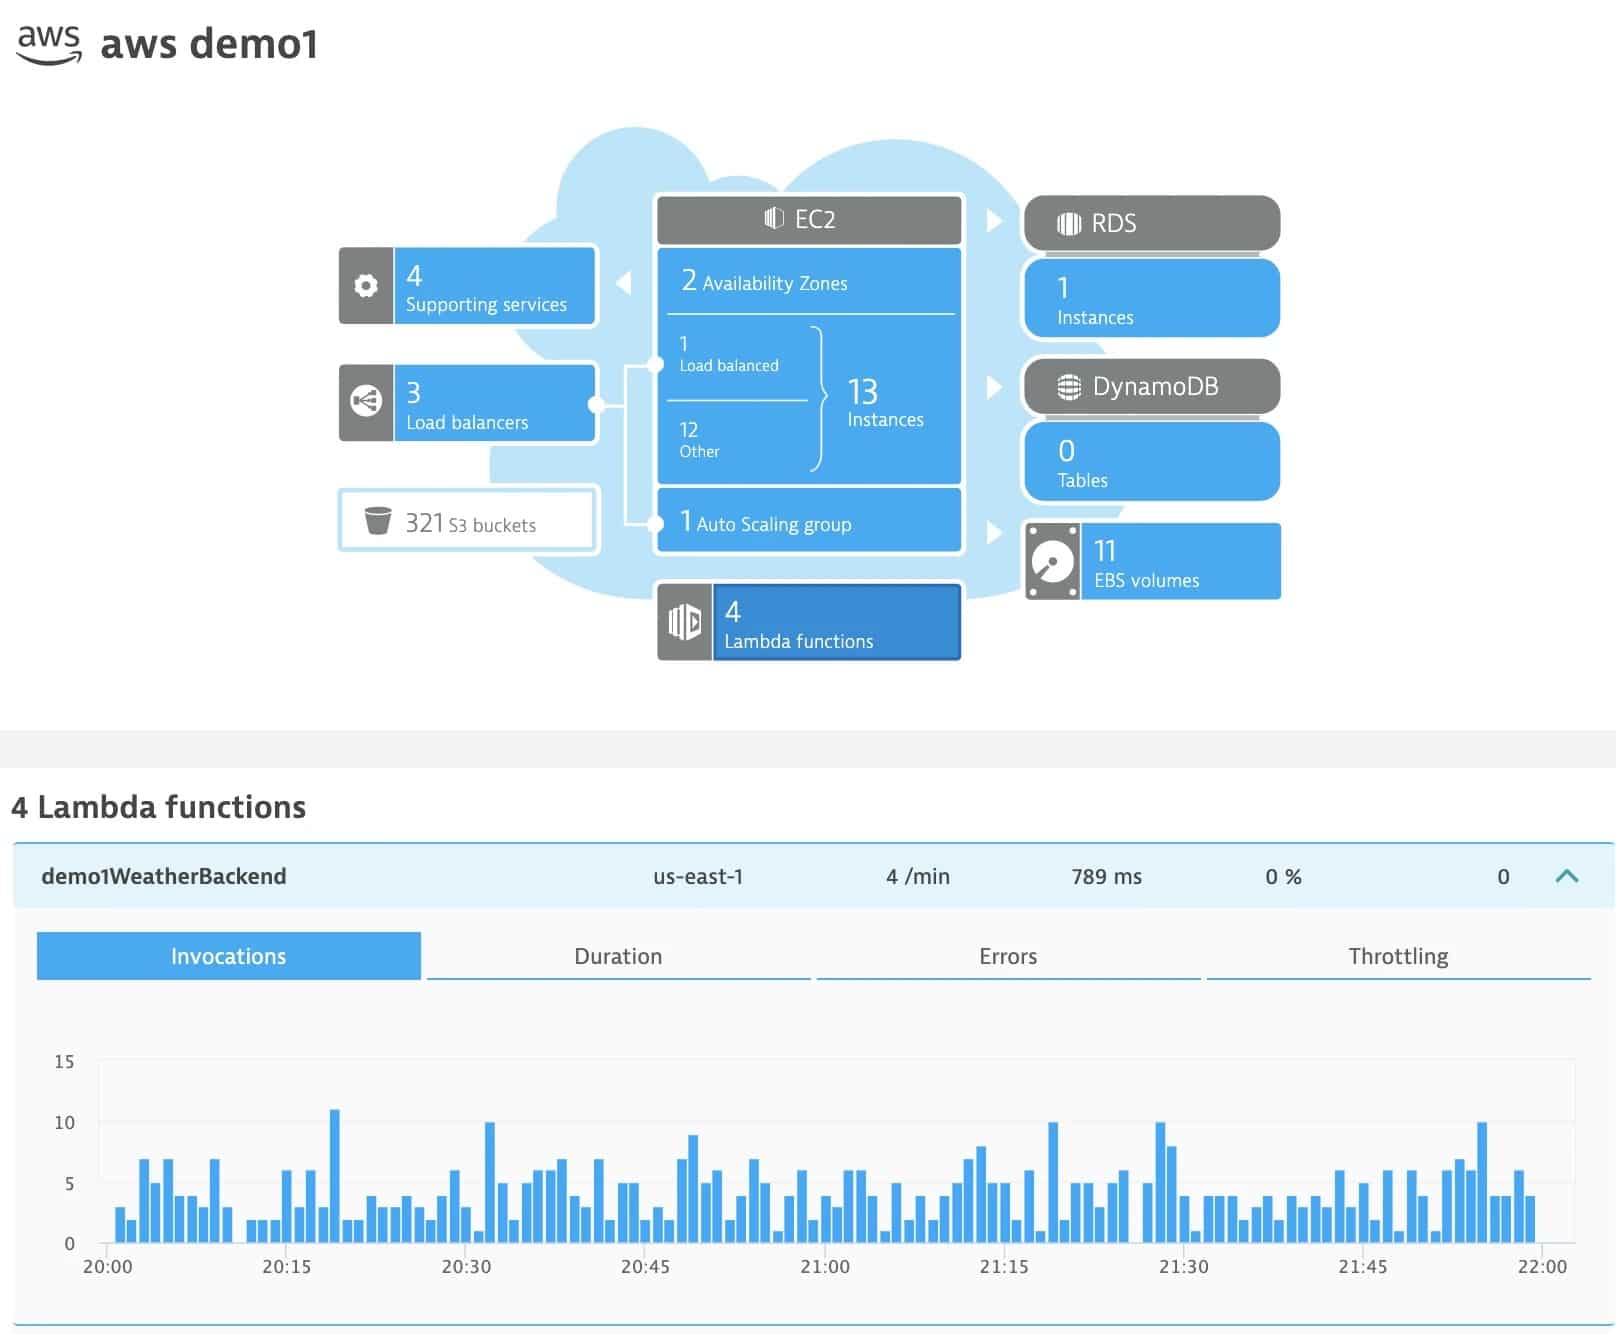
3. Datadog Serverless Monitoring

Datadog is another one of the big players in the serverless monitoring game. Its Serverless Monitoring tool gives full visibility into serverless computing and helps troubleshoot performance issues in applications and infrastructure alike.
This in-depth visibility is achieved thanks to Datadog monitoring and collecting metrics, traces, and logs from every instance of serverless applications.
And, there is more:
- All serverless functions integrate into Datadog as it discovers them immediately after installation; this provides administrators with a single pane of glass to monitor and troubleshoot all the serverless incidents including APIs, queues, databases, and more – all from a single, unified platform.
- It can collect business metrics from all serverless functions – straight out of the box and without the need for configuration or any other manual intervention, unless custom metrics monitoring is required, of course.
- Once installed, it immediately starts providing end-to-end visibility into the health of functions and applications; it collects critical serverless metrics to detect and resolve incidents occurring anywhere in the whole service architecture, including serverless functions, containers, and VMs.
- Datadog has over 500 built-in integrations that allow for the monitoring of just as many popular services like Amazon DynamoDB, S3, EC2, ECS, API Gateway, and Kubernetes – to name just a few.
- It can trace microservice calls across a stack allowing for end-to-end visibility into customer requests.
- Datadog can also visualize these distributed microservices in a map that can then be sliced and diced by tags like functions, customers, versions, and much more.
- It can also isolate an individual customer request and drill down to the associated logs and metrics to uncover the whole story – from incident to triggered alerts or incidents – even if they are unhandled exceptions, errors, or crashes.
One fact that needs to be mentioned here is that this tool doesn’t just work with serverless applications. It, in fact, integrates all data that is collected from the network, on-premises installations, users’ input or utilization, and many more sources to help build a complete picture.
All in all, this is the perfect tool to perform root cause analysis quickly by seamlessly navigating between logs, metrics, and distributed request traces from hosts and AWS Lambda, Azure, and Google Cloud functions.
Try Datadog Serverless Monitoring FREE for 14 days.
4. New Relic Serverless Monitoring

With New Relic Serverless Monitoring users get a platform for in-depth analysis that helps them know exactly what is happening in their infrastructure right down into the code level.
It is used to filter, analyze, and query all the performance data captured from cloud services and applications and which is then displayed on intuitive dashboards. In case of issues, alerts are immediately triggered and clearly displayed on the console.
Looking deeper, we find:
- This serverless monitoring platform has good gauges to accurately measure the speed and performances of individual transactions.
- It enhances control over the full stack with in-depth observation of critical systems and collects useful metrics, logs, and traces to make sure everything is working well.
- The out-of-the-box integrations with open-source tools make it easy to use this tool effectively.
- More New Relic integrations offer systems’ telemetry data – i.e., metrics, events, logs, and traces – connected in one platform to eliminate silos and also scale efficiently when the time comes to grow.
- It has log management for any text-based log data, originating from on-premises or the cloud, via a built-in Logs UI – to search, filter, analyze, and save search results for ongoing and accurate root-cause analysis.
- Administrators can integrate with, and leverage, the Telemetry Data Platform for alerting, dashboard control, or other open-source capabilities thanks to easy integration with third-party tools like Grafana and over 300 other solutions.
- It is quick – querying collected data is done in short response times – regardless of the data types.
- The tool can be configured to set off real-time notifications based on thresholds for all data types – metrics, logs, events, or traces.
All in all, using New Relic makes sense as it offers a powerful, no-nonsense tool that clients can start using for free and then upgrade to the packages they need without wasting money on features they don’t require.
Start using New Relic Serverless Monitoring for FREE.
5. Dynatrace Serverless Monitoring
Gartner named Dynatrace a Leader in the 2021 Magic Quadrant for APM report and rated them highest in 4 of 5 use cases in the 2021 Critical Capabilities for APM report – this shows it knows its job well.
Dynatrace Serverless Monitoring platform offers automatic and intelligent observability at scale for cloud-native workloads and enterprise apps. This feature helps ensure end-to-end hybrid cloud distributed tracing, optimization of service performances, faster innovation, efficient collaboration, and quick issue resolutions with the minimal manual effort required.
Let us look at more features:
- Dynatrace OneAgent Operator is the agent used to install the tool – once it has been deployed in the architecture, it becomes a native privileged service that not only helps with the assets’ discovery and management but also scales as the cloud stack grows.
- Dynatrace automatically discovers, baselines, and intelligently monitors dynamic multi-cloud environments – it continuously maps the dependencies of the entire environment, regardless of the complexity of the architecture.
- Its centralized platform allows for collaboration between various teams.
- The tool supports all the major cloud platforms and services – right out of the box; it also offers automatic SQL and NoSQL Database Monitoring.
- It can help gain situational awareness of DevOps pipelines – as it monitors and reports back on every build and deployment, any supporting infrastructure, and even the user activity around it all.
- In fact, it goes further to capture every user’s journey – every click and keypress – to build a picture of their activity; this information can be used to improve UX (user experience).
- Dynatrace is highly integrable and offers built-in support for over 500
The best thing about Dynatrace – apart from its already being a great tool for serverless monitoring, that is – is the fact that there are even more tools made by the company itself, that administrators can also integrate it with. This not only allows for end-to-end coverage but also gives further in-depth insights into each component of the cloud computing stack.
Try Dynatrace Serverless Monitoring FREE for 15 days.
6. Lumigo Serverless Monitoring and Troubleshooting Platform

Once it has been deployed, the Lumigo Serverless Monitoring and Troubleshooting Platform creates a visual representation of the whole cloud stack along with the services running on them. All the assets are presented on a visual map that is highly interactive and informative – all it takes is a single click, with no manual configurations required.
Other interesting features include:
- The platform offers one-click distributed tracing, monitoring, and debugging of cloud applications including Lambdas, other AWS services, API calls, and external SaaS services.
- Administrators can visualize the end-to-end execution duration of each service including those that run sequentially as well as in parallel; once implemented, Lumigo automatically identifies the services that are causing the worst latency.
- They can even view the duration of each call in a transaction – including asynchronous services such as S3, DynamoDB Streams, and Kinesis.
- Lumigo uses machine learning for predictive analysis to identify, and alert on, issues before they become a liability to application performance or up times.
- Lumigo provides drill-down reports with critical information such as warnings about issues, metrics, and costs.
Lumigo also offers other products like:
- Stackoscope – used to run health checks on AWS serverless environments. It can integrate into the deployment process or can be used directly from the command line. It helps improve security, cost, scalability, resilience, and performance issues.
- lumigo-cli – an open-source collection of essential development tools created for the serverless community. It consists of 17 useful tools designed to alleviate the development and management of event-based, distributed applications.
A great feature in Lumigo is that users can view all unhandled exceptions, timeouts, or out-of-memory conditions. They can then filter or assign them to a team member, and keep track of them until they are resolved.
Register to try the Lumigo Serverless Monitoring Platform for FREE.
7. Dashbird

This serverless applications monitoring tool was purpose-built for AWS Lambda deployments. Once it is deployed and has started collecting monitoring data, Dashbird brings it all under one pane of glass – everything including logs, metrics, and traces.
Every data point can be controlled from a central console which makes it easy to visualize the whole architecture and the applications that are running on them.
Delving deeper, we find:
- Dashbird hits the ground running – it can be set up in minutes and requires no configuration to immediately start giving full-stack visibility.
- The tool has automatic discovery capabilities and can ingest from all cloud resources; it has deep integrations with AWS services like X-Ray, CloudWatch Logs, and CloudWatch Metrics – as well as their dependencies and configurations.
- It can monitor multiple cloud components like Lambda functions, API Gateways, SQS queues, ECS containers, Kinesis, Step-Functions, and DynamoDB tables.
- And yet, Dashbird has its own full-fledged log analytics capability that is itself powered by Amazon ElasticSearch; it automatically ingests information from CloudWatch allowing for the searching, querying, and visualizations of multiple input sources.
- It streams and scans all serverless logs in real-time to detect code exceptions, timeouts, and out-of-memory alerts as well as numerous other anomalies.
- While Dashbird offers automatic metric alarm coverage; administrators can also set their own alarms and monitor or respond to them from one central console.
- It has over a hundred complex insight rules by default to constantly scan deployed services and spot issues with security and efficiency.
- It integrates seamlessly – and with a tiny digital footprint – into the existing workflow; this allows for reports and alerts to be sent out to other third-party solutions like Slack or emails.
An interesting feature of this tool is that Dashbird has actionable instructions to overcome any challenges. This makes life easier for administrators as each anomaly Dashbird detects is accompanied with instructions to resolve them as well as pointers to industry best practices.
Try the full version of Dashbird for FREE or simply choose their Free Forever version.
Those are the seven best serverless monitoring tools
Well, we have just seen the seven best serverless monitoring tools out there and talked about their features. We hope you have found this information useful and even gone ahead and tried a couple of them.
If you think there is a serverless monitoring tool that belongs on this list or have any other input about the ones listed above, we would love to hear about it. Drop us a comment below.


