For managing internal networks, there are no network monitoring tools as useful as LAN monitors. LAN monitoring tools come in all different shapes and sizes, and are used to manage the performance of important equipment like nodes and servers. LAN monitoring tools allow administrators to view the real-time and historic performance of connected devices to stay protected against cyber attacks.
Here is our list of the best LAN monitoring tools:
- ManageEngine OpManager EDITOR’S CHOICE A package of monitoring systems for networks and servers with autodiscovery and network topology mapping. Runs on Windows Server and Linux. Get a 30-day free trial.
- Paessler PRTG Network Monitor (FREE TRIAL) A bundle of monitoring systems that include network device monitoring through SNMP with autodiscovery and network topology mapping plus traffic analysis. Runs on Windows Server or is available as a SaaS platform. Start a 30-day free trial.
- Atera (FREE TRIAL) A SaaS package of tools for managed service providers that include remote monitoring systems for networks and servers. Access a 30-day free trial.
- Site24x7 Network Monitoring (FREE TRIAL) A cloud-based system that covers LANs and wireless networks and can track VoIP quality of service. Available for a 30-day free trial.
- ManageEngine OpManager Nexus (FREE TRIAL) An observability tool that monitors the availability and performance of all the components in your LAN. Download a 30-day free trial.
- Dynatrace This cloud-based application performance monitor also monitors infrastructure and it will extend its monitoring system right down to your LAN.
- Zabbix A free network and server monitor that will track your applications as well; it offers capacity forecasting as well as live monitoring. Runs on Linux, Unix, and macOS.
- Pandora FMS A free monitoring service that covers on-premises networks as well as servers, applications, and cloud assets. Available for Windows Server and Linux.
- ConnectWise Automate A SaaS package that implements remote monitoring and management for networks and servers and is a great option for managed service providers.
- Nagios XI (and Nagios Core) A systems monitor with a free version that can be extended by free plug-ins for technology-specific monitoring needs. Runs on Linux or Docker.
- SolarWinds Network Performance Monitor This on-premises software package implements LAN monitoring through the use of SNMP with automated discovery and topology mapping. Runs on Windows Server.
- WhatsUp Gold An on-premises package for SNMP-based network monitoring with a library of add-ons that includes a traffic analyzer. Runs on Windows Server.
- Zenoss Core A free full-stack monitoring system that can be extended by add-ons, called ZenPacks. The paid version has a SaaS option but this free package only runs on Linux.
Why Do I Need a LAN Monitoring Tool?
There are many reasons why LAN monitoring tools are important to enterprises. The most significant reason is that they provide you with complete visibility of your connected devices. With a LAN monitoring tool, you can view the performance of devices and your network through one pane of glass.
Typically, you’ll be able to view a dashboard of your network’s performance showing which devices are experiencing difficulties. The top-down perspective given to you by a LAN monitoring tool helps to spot the signs of performance degradation and cyberattacks before your service is disrupted.
The best LAN monitoring tools typically offer the following features:
- Real-time and historic network and hardware monitoring
- Autodiscovery to automatically configure devices
- Customizable alerts and notifications to highlight emerging security events
- Visualization and graphs to show network changes
For larger networks, LAN monitoring tools are essential because they can monitor hundreds of devices.
Our methodology for selecting the best LAN monitoring tool
We’ve broken down our analysis for you based on these key criteria:
- Ease of setup and usability to ensure quick deployment and intuitive navigation.
- Comprehensive monitoring capabilities that cover all aspects of LAN performance.
- Real-time alerting systems for immediate notification of network issues.
- Detailed reporting and analytics for in-depth network insights and troubleshooting.
- Compatibility with a wide range of devices and operating systems for versatile applications.
The best LAN monitoring tools
Administrators couldn’t possibly keep track of large numbers of devices without a LAN Monitor, as they would have to manually monitor every single device in the vicinity! In this article, we’re going to look at the best LAN monitoring tools for managing your network.
1. ManageEngine OpManager (FREE TRIAL)

Going back to the traditional dashboard monitoring experience we have ManageEngine OpManager. It provides an aesthetic LAN monitoring experience on Windows and Linux that allows the user to monitor the real-time and historical usage of data. Metrics you can monitor with ManageEngine OpManager included CPU usage, availability, disk space, and memory utilization on physical and virtual elements.
Key Features:
- Simple onboarding process
- Customizable alerts
- Over 100 built-in reports
- Supports Windows and Linux
Why do we recommend it?
ManageEngine OpManager excels in its ease of setup and extensive reporting capabilities, making it a top choice for efficient network management.
With ManageEngine OpManager, the onboarding process is simple. This tool takes less than two minutes to set up in order to start monitoring your network. From then on you can start to configure your own alerts to keep track of network events. Alerts are threshold-based so that you only receive notifications once a device’s usage has exceeded a preconfigured threshold.
For those instances where you need to collect further information about your network usage, there is a reports feature. ManageEngine OpManager comes with more than 100 built-in reports that you can customize or schedule as you wish. These are useful for preparing you for regulatory compliance or even keeping your team up-to-date.
Who is it recommended for?
Ideal for businesses needing quick setup and detailed network data analysis, especially in mixed OS environments.
Pros:
- Quick and straightforward setup
- Extensive reporting capabilities for in-depth analysis
- Customizable alerts for precise monitoring
- Compatible with multiple operating systems
Cons:
- May require additional configuration for complex networks
There are two main versions of ManageEngine OpManager available for purchase: the Essential version and the Enterprise version. For 25 devices ManageEngine OpManager costs £555 ($715). The Essential version is available for 500 devices at a price of £15,395 ($19,795). You can download the free trial.
EDITOR'S CHOICE
ManageEngine OpManager is our first choice for LAN monitoring, providing a centralized way to track, manage, and troubleshoot local area networks. It focuses on real-time performance visibility, helping administrators monitor the health and availability of devices such as routers, switches, firewalls, and servers. A key component is its network discovery and topology mapping. The platform automatically identifies devices on the LAN, maps them into a logical structure, and presents this in a clear visual layout. This makes it easier to understand dependencies, locate issues, and maintain an accurate view of the network. OpManager supports multiple protocols, including SNMP, WMI, and CLI, allowing it to work across a wide range of devices and environments. It also provides a centralized dashboard with insight into metrics such as bandwidth usage, latency, packet loss, and device uptime. Alerting and reporting features help teams stay informed of performance issues and respond proactively, supporting more consistent network operation and faster troubleshooting.
Download: Get a 30-day free trial
Official Site: https://www.manageengine.com/network-monitoring/download.html
OS: Windows Server, Linux, AWS, and Azure
2. Paessler PRTG Network Monitor (FREE TRIAL)

Another leading LAN monitoring tool is Paessler’s PRTG Network Monitor. It offers a network monitoring experience that is built around sensors. With this tool, you can easily monitor connected hardware, applications, cloud services, web pages, and NetFlow data to scrutinize the performance of the network.
Key Features:
- Autodiscovery of network devices
- Customizable sensors for monitoring
- Threshold-based alerts
- Supports various network elements
Why do we recommend it?
PRTG Network Monitor is versatile and user-friendly, offering a sensor-based approach for precise network monitoring.
The tool is great for those enterprises who want to get a quick start on their network monitoring as it offers an autodiscovery feature. With network auto discovery, PRTG Network Monitor automatically scans your network and locates connected devices. Once a device has been found, PRTG Network Monitor will create a sensor to monitor it.
In PRTG Network Monitor, sensors are designed to track the performance of network elements in a segmented manner. For example, there are sensors for bandwidth monitoring, web servers, SNMP, Windows, Linux, and virtual servers. Sensors help the user to narrow down to specific network performance issues without getting lost in other data.
Although PRTG Network Monitor emphasizes sensors, it still has threshold-based alerts through email and SMS so that you don’t miss out on anything important. If you’re part of an organization that’s looking for an affordable network monitoring tool then PRTG Network Monitor is a solid product.
Who is it recommended for?
Great for enterprises needing detailed, customizable monitoring of a wide range of network components.
Pros:
- Efficient network auto-discovery simplifies setup
- Customizable sensors for targeted monitoring
- Effective alert system for immediate issue notification
- Supports a broad spectrum of network elements
Cons:
- The sensor-based system might be overwhelming for new users
There is a free version of PRTG Network Monitor that offers users up to 100 sensors to monitor smaller networks. If you require more sensors then you’ll have to pay. The pricing model is scalable, so prices range from £1,244 ($1,600) to £46,656 ($60,000). There is also a 30-day free trial.
3. Atera (FREE TRIAL)

Atera is designed for use by managed service providers (MSPs). The package includes professional services automation (PSA) systems for running MSP businesses and remote monitoring and management (RMM) tools for use by technicians when supporting the systems of clients. The RMM system includes a great deal of automation and that includes its LAN monitoring service.
Key Features:
- Automated LAN monitoring
- Remote access service included
- Patch manager for maintenance
- Cloud-based console
Why do we recommend it?
Atera is a comprehensive and automated solution, ideal for MSPs needing robust remote monitoring capabilities.
The LAN monitor in the Atera RMM system operates remotely, so it can monitor any network anywhere in the world. The system uses SNMP routines to check on network device activity. SNMP agents on those devices will notify the Atera network monitor if the device has problems.
Atera’s network monitor has a series of performance thresholds that will trigger alerts if crossed. The service will also generate an alert if it receives a problem notification from a device agent. The alerting mechanism means that technicians don’t have to spend time watching regular activity on the network because they know they will be drawn back to the monitoring console if they are needed.
The Atera RMM system also includes monitors for servers and applications. All of these RMM functions are automated. Other tools in the RMM pack are a remote access service for investigations and customer support and a patch manager that can also launch automated maintenance tasks on a schedule. The PSA section of Atera includes client contact management, contract management, and a ticketing system for task tracking and team management.
Who is it recommended for?
Best suited for MSPs and businesses looking for a cloud-based, all-in-one monitoring and management solution.
Pros:
- Remote monitoring capabilities for global access
- Automation reduces manual workload
- Comprehensive toolset including patch management
- Cloud-based for easy access and management
Cons:
- Might be complex for smaller or less tech-savvy teams
Atera is a cloud-based system, so its console can be accessed from anywhere through any standard web browser. There are three plans available and they are all charged for by subscription, which you can choose to pay monthly or annually. An annual subscription plan gets you a lower rate. The Pro plan’s annual price works out at $129 per technician per month. You can examine the Atera platform with a 30-day free trial.
4. Site24x7 Network Monitoring (FREE TRIAL)

The Site24x7 Network Monitoring service is based in the cloud, but extracts data from your LAN with an installed local agent. This tool is able to discover all devices connected to the network, and generate an asset inventory. The package also draws up a network topology map from the data in the network inventory.
Key Features:
- Cloud-based with local agent
- Network inventory and topology
- Extensive traffic data analysis
- VoIP and QoS monitoring
Why do we recommend it?
Site24x7 offers a unique blend of cloud-based flexibility with in-depth local network insights, suitable for diverse network environments.
The package uses SNMP to check on the availability and statuses of network devices. This querying process also updates the network inventory if any devices have been added or removed. The availability check provides you with security monitoring because you will be able to see any rogue devices connected to the network.
As well as monitoring network devices, the Site24x7 system extracts traffic data from them using NetFlow, sFlow, J-Flow, CFlow, IPFIX, AppFlow, and NetStream. This enables the tool to show traffic data from the switches, routers, and firewalls that come from any provider. VoIP users can get IP SLA and MOS statistics to check on Quality of Service.
This package will also check on wireless networks and connections between sites. The Network Monitoring tool can track the performance of edge services and cloud packages as well as on-premises systems.
Who is it recommended for?
Ideal for organizations requiring comprehensive network monitoring with a focus on traffic analysis and device management.
Pros:
- Cloud-based for accessible, anywhere monitoring
- Detailed network inventory and topology mapping
- Extensive traffic data collection and analysis
- Effective VoIP and Quality of Service monitoring
Cons:
- Local agent installation may be complex for some users
Site24x7 markets its platform as a bundle, and every plan includes the Network Monitoring system. You also get server and application monitoring. It is also possible to get a plan that includes log management or website monitoring. For an example of package pricing, look at the Infrastructure plan, which starts at $9 per month. You can examine any Site24x7 plan with a 30-day free trial.
5. ManageEngine OpManager Nexus (FREE TRIAL)
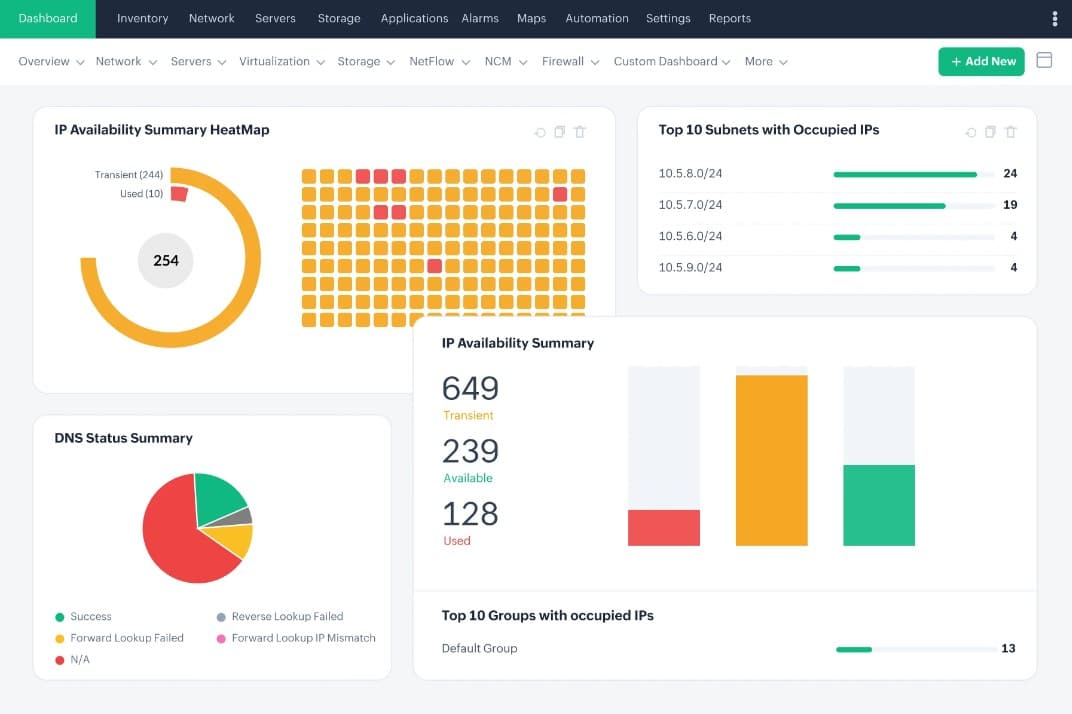
ManageEngine OpManager Nexus, formerly OpManager Plus, is a proactive network monitoring tool that leverages the power of AI and ML to improve the accuracy of alerts and the associated contextual information. It supports more than 10,000 hardware types for wide coverage.
Key Features:
- Complete monitoring of physical and virtual infrastructure.
- Handles bandwidth monitoring and flow analysis.
- Configuration tracking and control.
- Multi-channel alerts and notifications.
Why do we recommend it?
OpManager Nexus has a wide coverage, as it can monitor and manage both physical and virtual servers in your LAN environments. Moreover, it can monitor bandwidth usage and analyze traffic patterns from flow technologies to provide a good understanding of data movement in your network. It also provides complete control over your configuration for added flexibility and security.
Another aspect that we love about OpManager Nexus is its dashboards. They are well-designed and display all the required information through a single pane. You can further drill down into specific metrics for a more accurate understanding of the root causes.
Who is it recommended for?
It is recommended for large organizations, data centers, and compliance-focused organizations that need detailed insights into their operations.
Pros:
- Monitors firewall rules and policies for additional security.
- Generates insightful reports for proactive monitoring.
- Supports bandwidth monitoring and flow analysis
- Provides detailed insights into your network’s health and performance.
Cons:
- Maybe too complex for smaller organizations.
OpManager Nexus offers two editions – Professional ($1,233 a year for 50 devices) and Enterprise edition ($19,995 a year for 1000 devices). Start a 30-day free trial.
6. Dynatrace

When it comes to advanced network monitoring, Dynatrace has developed a reputation as an essential cloud-monitoring tool. Dynatrace is an application performance management and cloud infrastructure monitoring system. In other words, this tool provides you with “full stack” visibility throughout your local environment.
Key Features:
- Advanced cloud monitoring
- Automated metrics collection
- Autodiscovery of network devices
- Proactive security alerts
Why do we recommend it?
Dynatrace stands out for its advanced, automated cloud-monitoring capabilities, offering deep insights into network performance and security.
The automation of Dynatrace is one of the main reasons it has acquired such a popular following. To use Dynatrace all you need to do is install one agent per host, then the program will start to collect metrics throughout your network stack. Similarly, there is an autodiscovery feature that discovers and maps devices so that you can view the relationships between them.
The responsiveness of Dynatrace to the latest threats is another reason to buy. The user is sent alerts the moment a security event occurs. The platform also activates root cause analysis to provide the user with details as to the cause of the security incident. In some instances, you can even automate the response so that Dynatrace solves the problem itself.
Who is it recommended for?
Best for organizations focused on comprehensive cloud-based network monitoring with an emphasis on security and automation.
Pros:
- Advanced cloud-monitoring capabilities
- High level of automation for operational efficiency
- Efficient device discovery and mapping
- Proactive security alerting and analysis
Cons:
- Pricing and feature complexity may not suit smaller businesses
Dynatrace is an exceptional choice for those organizations that want to automate their LAN monitoring efforts. In order to find out more information about the pricing options for Dynatrace you’ll need to contact the company directly. However, there is a free trial.
7. Zabbix
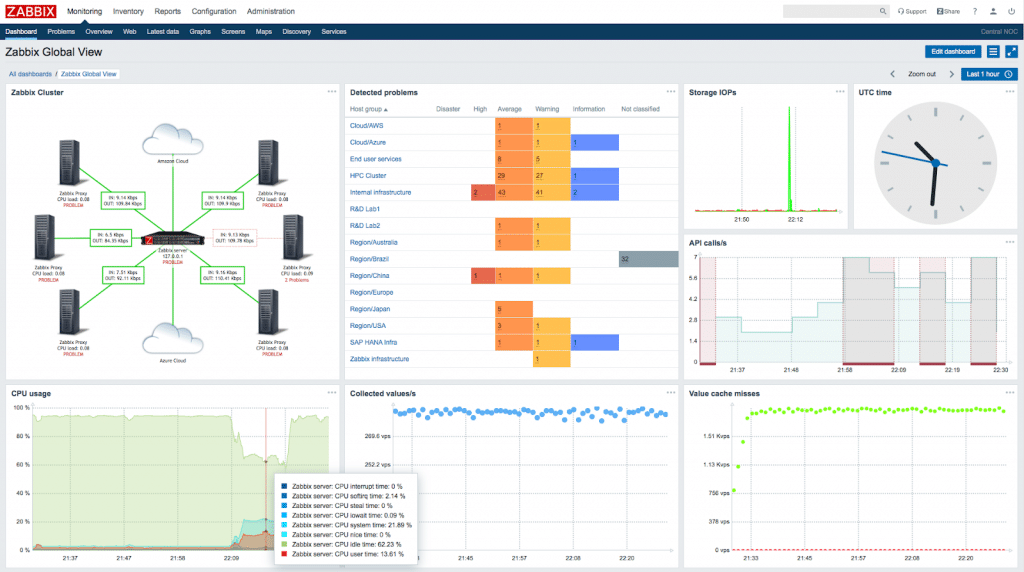
Zabbix is an open-source network monitoring tool that provides everything you need to monitor your local environment. Zabbix offers network monitoring, server monitoring, cloud monitoring, application monitoring, and services monitoring to provide 360-degree protection against threats and poor performance. The effectiveness of this approach has lead Zabbix to be adopted by such household names such as Dell and Salesforce.
Key Features:
- Anomaly detection
- Comprehensive dashboard
- Trend prediction and forecasting
- Open-source and free
Why do we recommend it?
Zabbix offers powerful network monitoring with advanced features like anomaly detection, ideal for comprehensive, cost-effective network oversight.
Perhaps the greatest strength of Zabbix is its ability to detect network problems almost immediately. Zabbix offers trend prediction, anomaly detection, and problem forecasting. The most interesting of these three is the anomaly detection feature which can detect anomalous activity in your network, notify you, and start root cause analysis to pinpoint what caused the problem.
However, if you want to use that more dashboard-based approach Zabbix has plenty onboard to support you. Network usage is displayed with clear visualization options such as graphs and a central dashboard to minimize the risk of missing something important. You can even generate reports if you wish to compile more information on a recent event.
Who is it recommended for?
Perfect for businesses seeking a robust, open-source solution for extensive network monitoring and anomaly detection.
Pros:
- Advanced anomaly detection for security
- Comprehensive and customizable dashboard
- Predictive analytics for proactive management
- Open-source and free, suitable for budget-conscious organizations
Cons:
- May require more technical expertise for setup and customization
The best part about Zabbix is that it is completely free for CentOS, Debian, Oracle Linux, Red Hat Enterprise Linux, Ubuntu, and Raspbian. As such, this makes it suitable for organizations on a shoestring budget who are looking for an open source approach to LAN Monitoring. You can download Zabbix for free.
8. Pandora FMS
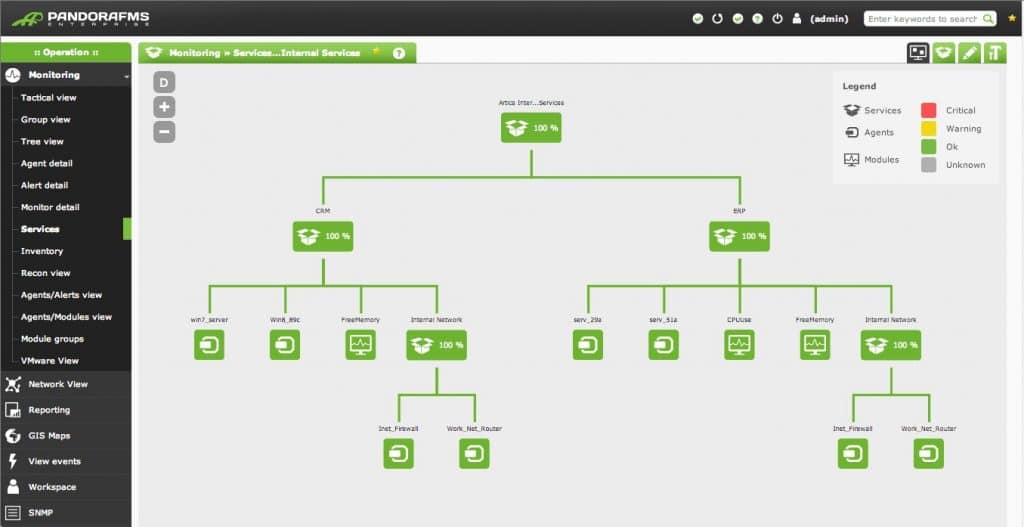
Another widely-used open-source LAN monitor is Pandora FMS. Pandora FMS is web-based and can monitor everything from networks to servers and applications. Pandora FMS advertises itself as a “Flexible Monitoring System” and is compatible with Docker, MySQL, Slack, Apache, Windows IIS, Microsoft SQL Server, and Amazon Web Services to name a few.
Key Features:
- Web-based monitoring
- Fault and Event Management
- Supports various integrations
- Available in Open Source and Enterprise versions
Why do we recommend it?
Pandora FMS offers a flexible, web-based monitoring solution that caters to both small and large-scale enterprises with its dual versions.
Pandora FMS is available as an Open Source and an Enterprise version. The Open Source version is intended to support smaller-sized companies. The Enterprise version is designed specifically for larger organizations to conduct Fault and Event Management, Event Correlation, Low Collection, Monitoring policies, and security updates.
Who is it recommended for?
Ideal for organizations of varying sizes looking for a customizable, scalable monitoring solution with a wide range of integration options.
Pros:
- Web-based for easy access and management
- Comprehensive Fault and Event Management features
- Wide range of integrations for versatility
- Available in both open-source and enterprise versions
Cons:
- Enterprise version might be costly for smaller organizations
The Pandora NMS version of Pandora FMS starts at a price of £2,322 ($2,985) for the first year and the Enterprise version starts at £3,317 ($4,265). As a network monitoring tool, Pandora FMS is also available for free.
9. ConnectWise Automate

Stepping up to the apex of technical network monitoring we have ConnectWise Automate. As the name suggests, ConnectWise Automate provides a LAN Monitoring experience that provides users with many different options for automating their network monitoring. With this tool, you can automatically discover devices within your network so that you can see what is going on.
Key Features:
- Automated device discovery
- Patch management capabilities
- Remote device management
- Extensive monitoring tools
Why do we recommend it?
ConnectWise Automate excels in automation, providing a comprehensive set of tools for effective and efficient network management.
ConnectWise Automate also adds patch management capabilities to the mix as well. The user can schedule and approve patches remotely so that they don’t have to do it manually on each device. In addition, you can also manage connected devices remotely without impacting the end user.
The network monitoring capabilities of ConnectWise Automate are also very impressive, with over 500 out-of-the-box monitoring tools to monitor every environment. If you’re using virtualized services then these can be monitored through the Virtualization Manager which can monitor VMware and Hyper-Vr setups.
Who is it recommended for?
Highly suitable for large companies seeking a scalable and automated solution for comprehensive network monitoring and management.
Pros:
- Automated discovery for easy setup
- Efficient patch management for maintaining network health
- Remote management capabilities for operational flexibility
- Over 500 monitoring tools for comprehensive oversight
Cons:
- May be too complex for smaller or less tech-intensive organizations
For large companies without looking for a scalable LAN monitoring solution with automation, ConnectWise Automate is the perfect tool. ConnectWise Automate starts at £544 ($700) for the installation and agents range from a price of £0.78 – 4.67 ($1-$6) per month for each agent. There is also a free trial.
10. Nagios XI (And Nagios Core)

Nagios XI is a tool that is well-known in the LAN monitoring space. Both tools take an agentless monitoring approach to analyze network performance. The web-based GUI is completely customizable so that you can create a monitoring experience that differs from user to user. If this isn’t enough, you also have a number of APIs that allow you to integrate third-party applications.
Key Features:
- Customizable web-based GUI
- Agentless monitoring approach
- User management features
- Scalable for larger environments
Why do we recommend it?
Nagios XI offers a highly customizable and scalable monitoring solution, well-suited for large environments needing robust, agentless monitoring.
While Nagios XI keeps its layout relatively sparse, this helps to create a clear-cut monitoring experience. For example, the design of the capacity planning graphs isn’t much to look at but it gives you a clear reading of your future usage requirements. The layout helps you to read more complex graphs that would be lost on other platforms.
For larger environments, Nagios XI is a reliable option because of its user management features. For instance, you can manage multiple user accounts from one location. Each of these user accounts can be assigned a different role within your network monitoring strategy. This helps you to organize a fast-track response to security concerns.
Who is it recommended for?
Best for larger organizations requiring a flexible, web-based network monitoring solution with strong user management features.
Pros:
- Highly customizable GUI for personalized monitoring
- Agentless monitoring for ease of deployment
- Effective user management for large teams
- Scalable to suit large network environments
Cons:
- The barebones layout might not appeal to all users
Nagios XI starts at a price of £1,551 ($1,995); however, you can download a more limited version for free called Nagios Core. With Nagios Core you can monitor your network, manage alerts, and even utilize some APIs to customize your experience. You can download a 60-day free trial.
11. SolarWinds Network Performance Monitor

First up on this list we have SolarWinds Network Performance Monitor, a LAN monitoring tool that provides a dashboard-centric approach to network monitoring. With this tool you can run auto discovery to locate devices connected to your network and start monitoring. All of these devices can be monitored from the dashboard.
Key Features:
- Dashboard-centric monitoring
- Wireless heat maps available
- Intelligent network maps
- Email and SMS notifications
Why do we recommend it?
SolarWinds Network Performance Monitor offers comprehensive and intuitive monitoring solutions, making it ideal for thorough network oversight.
On the dashboard, you’ll be able to view the health and performance data of your entire network. Here, devices will be characterized as Up, Warning, Critical, or Undefined. You can also use SolarWinds Network Performance Monitor’s wireless monitoring to view the performance of your wireless connection as well. Most notable is the ability to build wireless heat maps to see where your local connection is strongest.
Of course, if you find that you want more depth over your network’s structure then you can view intelligent maps of your entire environment. With intelligent maps, you can see how connected devices interlink, and see when they are experiencing performance issues. In the event that you aren’t at your desk to catch an event then you can stay in the loop with notifications via email and SMS.
Who is it recommended for?
It is particularly suited for organizations seeking an all-encompassing tool to monitor complex network environments.
Pros:
- User-friendly interface enhances monitoring efficiency
- Auto Discovery feature streamlines device integration
- Advanced wireless heat map generation
- Intelligent mapping offers detailed network insights
Cons:
- Higher price point may be prohibitive for some
For those organizations who are looking for an easy-to-use LAN monitoring tool that can monitor their entire local environment, SolarWinds Network Performance Monitor is the perfect package. SolarWinds Network Performance Monitor starts at a price of £2,275 ($2,926). There is also a free trial.
12. Progress WhatsUp Gold

Progress WhatsUp Gold is another top-of-the-range web-based LAN monitoring tool that provides one of the best dashboard-based experiences on the market. When monitoring your network with WhatsUp Gold you’ll notice that the dashboard doesn’t overwhelm you with information. You can view the status of network devices through the Current Device Status screen (here you are shown whether devices are categorized as Up, Down, Maintenance, or Unknown with colored blocks).
Key Features:
- Intuitive dashboard interface
- Network auto-discovery feature
- Customizable alerts system
- Network traffic analysis capabilities
Why do we recommend it?
WhatsUp Gold provides an intuitive, user-friendly monitoring experience with comprehensive features like auto-discovery and traffic analysis.
To make things convenient, WhatsUp Gold also has an autodiscovery feature which automatically discovers connected devices so that they can be monitored immediately. Autodiscovery not only connects devices but helps to form a map of the entire network. The map view is particularly useful when it comes to troubleshooting problems in particular areas of a network.
The alerts system doesn’t miss a step either, with customizable alerts that are triggered the moment a network event occurs. Alerts can be sent via email, SMS, Slack, web alarms, IFTTT posts, or service restarts. No matter what threat you are confronted with, WhatsUp Gold puts you in the best position to be responsive under pressure.
Who is it recommended for?
Ideal for businesses needing an accessible yet powerful tool for in-depth network monitoring and analysis.
Pros:
- User-friendly dashboard for easy monitoring
- Autodiscovery streamlines network setup
- Customizable alerts for proactive network management
- Detailed network traffic analysis
Cons:
- Pricing and package options might be confusing for some buyers
WhatsUp Gold is available in a number of editions; Premium Annual Subscription, Premium License, and the Total Plus License. The main difference between the Premium and Total Plus versions is that the Total Plus version provides you with network traffic analysis, application monitoring, virtualization monitoring, configuration management, and scalability pollers. Pricing for WhatsUp Gold starts at £2,065 ($2,656). There is also a free trial.
13. Zenoss Core

Finally we have Zenoss Core, it is a free network monitoring platform that offers application performance management, log data, events data, and incident management. The APM focus of Zenoss Core has made it ideal for monitoring both physical and virtual devices (including containers and microservices).
Key Features:
- Application Performance Management
- Comprehensive dashboard customization
- Supports physical and virtual devices
- Free community version available
Why do we recommend it?
Zenoss Core is a versatile and customizable monitoring solution, especially effective for managing both physical and virtual network components.
Zenoss Core is available for Linux but can also be installed via VMware Player or VMware Server by users on Windows and Mac devices. However, much of your monitoring activity will take place through the online web-based GUI. The dashboard is completely customizable so that you can drag and drop widgets as you see fit.
In terms of visualization, Zenoss Core is a little outdated when compared to many other tools on this list. That being said, it does provide you with everything you need to stay up to date. Device Status is color-coded so that you can check the uptime of devices instantly. You can also view a color-coded network topology map that shows all of your connected devices.
Who is it recommended for?
Best suited for businesses looking for a free, robust solution capable of managing a diverse range of network components and applications.
Pros:
- APM for comprehensive network oversight
- Highly customizable dashboard for personalized monitoring
- Supports a wide range of physical and virtual devices
- Free community version for budget-conscious users
Cons:
- Advanced features require purchasing cloud or on-premises versions
There are three versions of Zenoss available; Zenoss Cloud, Zenoss On-Premises and Zenoss Core. Zenoss Core is the free community version and offers basic network monitoring capabilities. However, if you require more advanced features like event management, root-cause analysis, analytics, and reports, you’ll need to purchase Zenoss Cloud or Zenoss On-Premises. You can download Zenoss Core here.
The Best LAN Monitoring Tools: ManageEngine OpManager
If you’re in the market for a new LAN monitoring tool then you’re likely to be overwhelmed by the number of choices you have available to you. What tool is best for your environment depends on the style of network monitoring tool that you want to use. For the classic dashboard-based approach, ManageEngine OpManager offers a complete package.
OpManager is great for those companies that want a premium LAN monitoring tool at a competitive price. The device autodiscovery capabilities of OpManager and its simple user interface makes it easy to onboard in almost any enterprise.
In the event that you’re seeking an open-source LAN monitoring tool, then Zabbix is an alternative worth considering. To make sure that your deployment goes smoothly we recommend trying out two or more free trials just so you can see first-hand what these tools have to offer before making a purchase. After all, you don’t want to realize a LAN monitoring tool isn’t suitable once you’ve invested in it!


Please for my complete sanity will someone take a look at the excellent “Statseeker”
I have used most of the ones above and they all have many limitations and drawbacks with data and such but Statseeker is the best monitoring tool I have ever used by far, and I have never seen anyone even mention it
Thank you for the recommendation Allan. We’ll take a look at Statseeker for future network monitoring articles.