A Network Monitoring Tool is a program that drags useful information from different parts of the network. It will make it easier to run and manage the network. Performance monitoring, fault monitoring, and account monitoring will be the focus of the best network device monitoring tools.
Here is our list of the best network device monitoring tools:
- Auvik EDITOR’S CHOICE A network management tool that implements network discovery, device documentation, network mapping, and constant device status checking. The system also provides network traffic analysis. Delivered as a cloud-based SaaS package. Start a 14-day free trial.
- ManageEngine OpManager (FREE TRIAL) A network monitor that is based on SNMP and has great options for how to lay out the network topology. Start a 30-day free trial.
- Paessler PRTG (FREE TRIAL) This bundle of monitoring tools for networks, servers, and applications is centered on a network discovery routine that creates an inventory and a network topology map. SNMP routines implement continuous device monitoring. Offered as a SaaS platform or a software package for Windows Server. Access a 30-day free trial.
- Site24x7 Network Monitoring (FREE TRIAL) Site24x7 is a cloud-based website and server monitoring platform that helps small to large businesses keep an eye on their websites, servers, clouds, networks, applications, and real-time users. Start a 30-day free trial.
- Datadog Network Monitoring Provides excellent visibility into each of your network’s components, as well as the connections that connect them all.
- Checkmk This version is for professionals, and the Checkmk Micro Core replaces Nagios at its core. It has a few extra features as well. For this edition, you can get help from a professional.
- Progress WhatsUp Gold This monitoring tool sends out what are called MIBs, which are requests for status reports, regularly.
Network monitoring tools are used to look at things like applications, email servers, and so on. It sends a signal, or Ping, to the different system ports to look at the network or its internal parts. When choosing a network monitoring tool for your IT environment, it is important to think about both your current needs and what you might need in the future. This is because it is very important to choose the right tool out of the many that are available. Almost every year, new IT monitoring, server monitoring, and system monitoring software, tools, and utilities come out to compete in a market that changes all the time.
Here in this article, after doing deep research, we have reviewed the best network monitoring tools, to make it easy for you to choose.
Our methodology for selecting the best network device monitoring tools
We’ve broken down our analysis for you based on these key criteria:
- Emphasis on real-time network performance monitoring and fault detection.
- Compatibility with a wide range of network devices and platforms.
- Scalability to adapt to growing network sizes and complexities.
- Intuitive user interface and ease of deployment across network systems.
- Comprehensive reporting capabilities for detailed network analysis.
The Best Network Device Monitoring Tools
1. Auvik (FREE TRIAL)
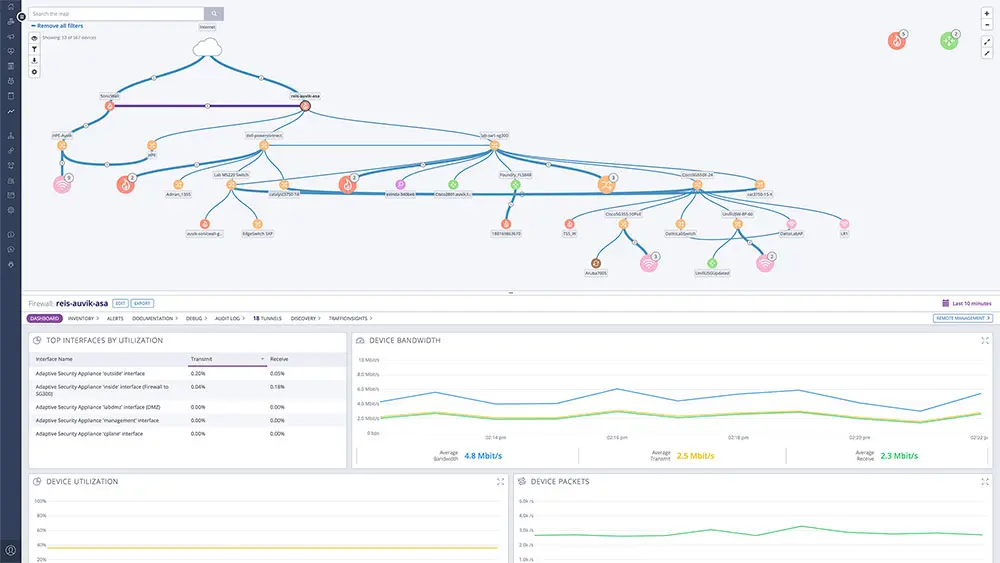
The cloud-based network management software from Auvik ensures that IT networks all over the world work proficiently. Auvik helps an IT team’s efficiency and capacity increase by automating and making network management easier. It also protects the business from network risk. Real-time mapping and inventory of networks allows you to find and check out new networks quickly. Even if your users and devices move, you’ll always know where everything is.
Key Features:
- Monitoring of networks on multiple sites is centralized
- Keeps an eye on the status of network devices
- Provides two plans; Essential and Performance
- Traffic analysis of the network is part of the higher plan
- Monitors both real networks and virtual LANs
Why do we recommend it?
Auvik‘s cloud-based network management software excels in enhancing IT team efficiency and managing network risks. Its ability to automate and simplify network management, along with real-time mapping and inventory, makes it highly recommendable for efficient network oversight.
The system of thresholds in Auvik’s network monitoring system makes it possible for it to be automated. Most of the metrics that the network monitor keeps an eye on already have thresholds built into the service. There is also the option to set your thresholds.
The Auvik service can be made better by using third-party tools that integrate with the network monitor. Auvik has two different types of plans: Essential and Performance. The Performance plan is the higher plan, and in addition to the network monitoring services that come with the Essentials plan, it also has functions for traffic analysis and Syslog management.
Auvik’s processing power comes from the cloud servers that run the service. But each site that is being watched needs to have a collector installed. Both Windows Server and Ubuntu Linux can run this software. The collector can also be run on a virtual machine (VM). No matter where the collector is, the system manager can still use any standard Web browser to get to the service’s console, which is based on the Auvik server.
Who is it recommended for?
Auvik is ideal for IT teams seeking to boost efficiency and manage network risks, especially in environments with multiple sites and a need for centralized network monitoring and real-time device status updates.
Pros:
- Centralizes multi-site network monitoring
- Real-time network device status updates
- Offers two tailored plans for diverse needs
- Advanced traffic analysis in the Performance plan
- Monitors both physical networks and virtual LANs
Cons:
- Takes time to fully explore all features
Auvik’s service starts with a process called “network discovery”. All of the basic information that the monitor needs to work will be filled in automatically. Since the discovery service runs all the time, it will notice when new devices join the network. You can register for a 14-day free trial.
EDITOR'S CHOICE
Auvik is our top pick for a network device monitoring tool because this system discovers and documents all network devices and draws up a network map as well. Constant rescanning of the network picks up any status issues with switches and routers. Performance metrics are shown in the Auvik dashboard and any problems are displayed as alerts. This mechanism is based on SNMP procedures and it means that network management staff can assume that everything is working OK on the network unless they are notified otherwise.
Download: Get a 14-day FREE Trial
Official Site: https://www.auvik.com/#trial
OS: Cloud-based
2. ManageEngine OpManager (FREE TRIAL)
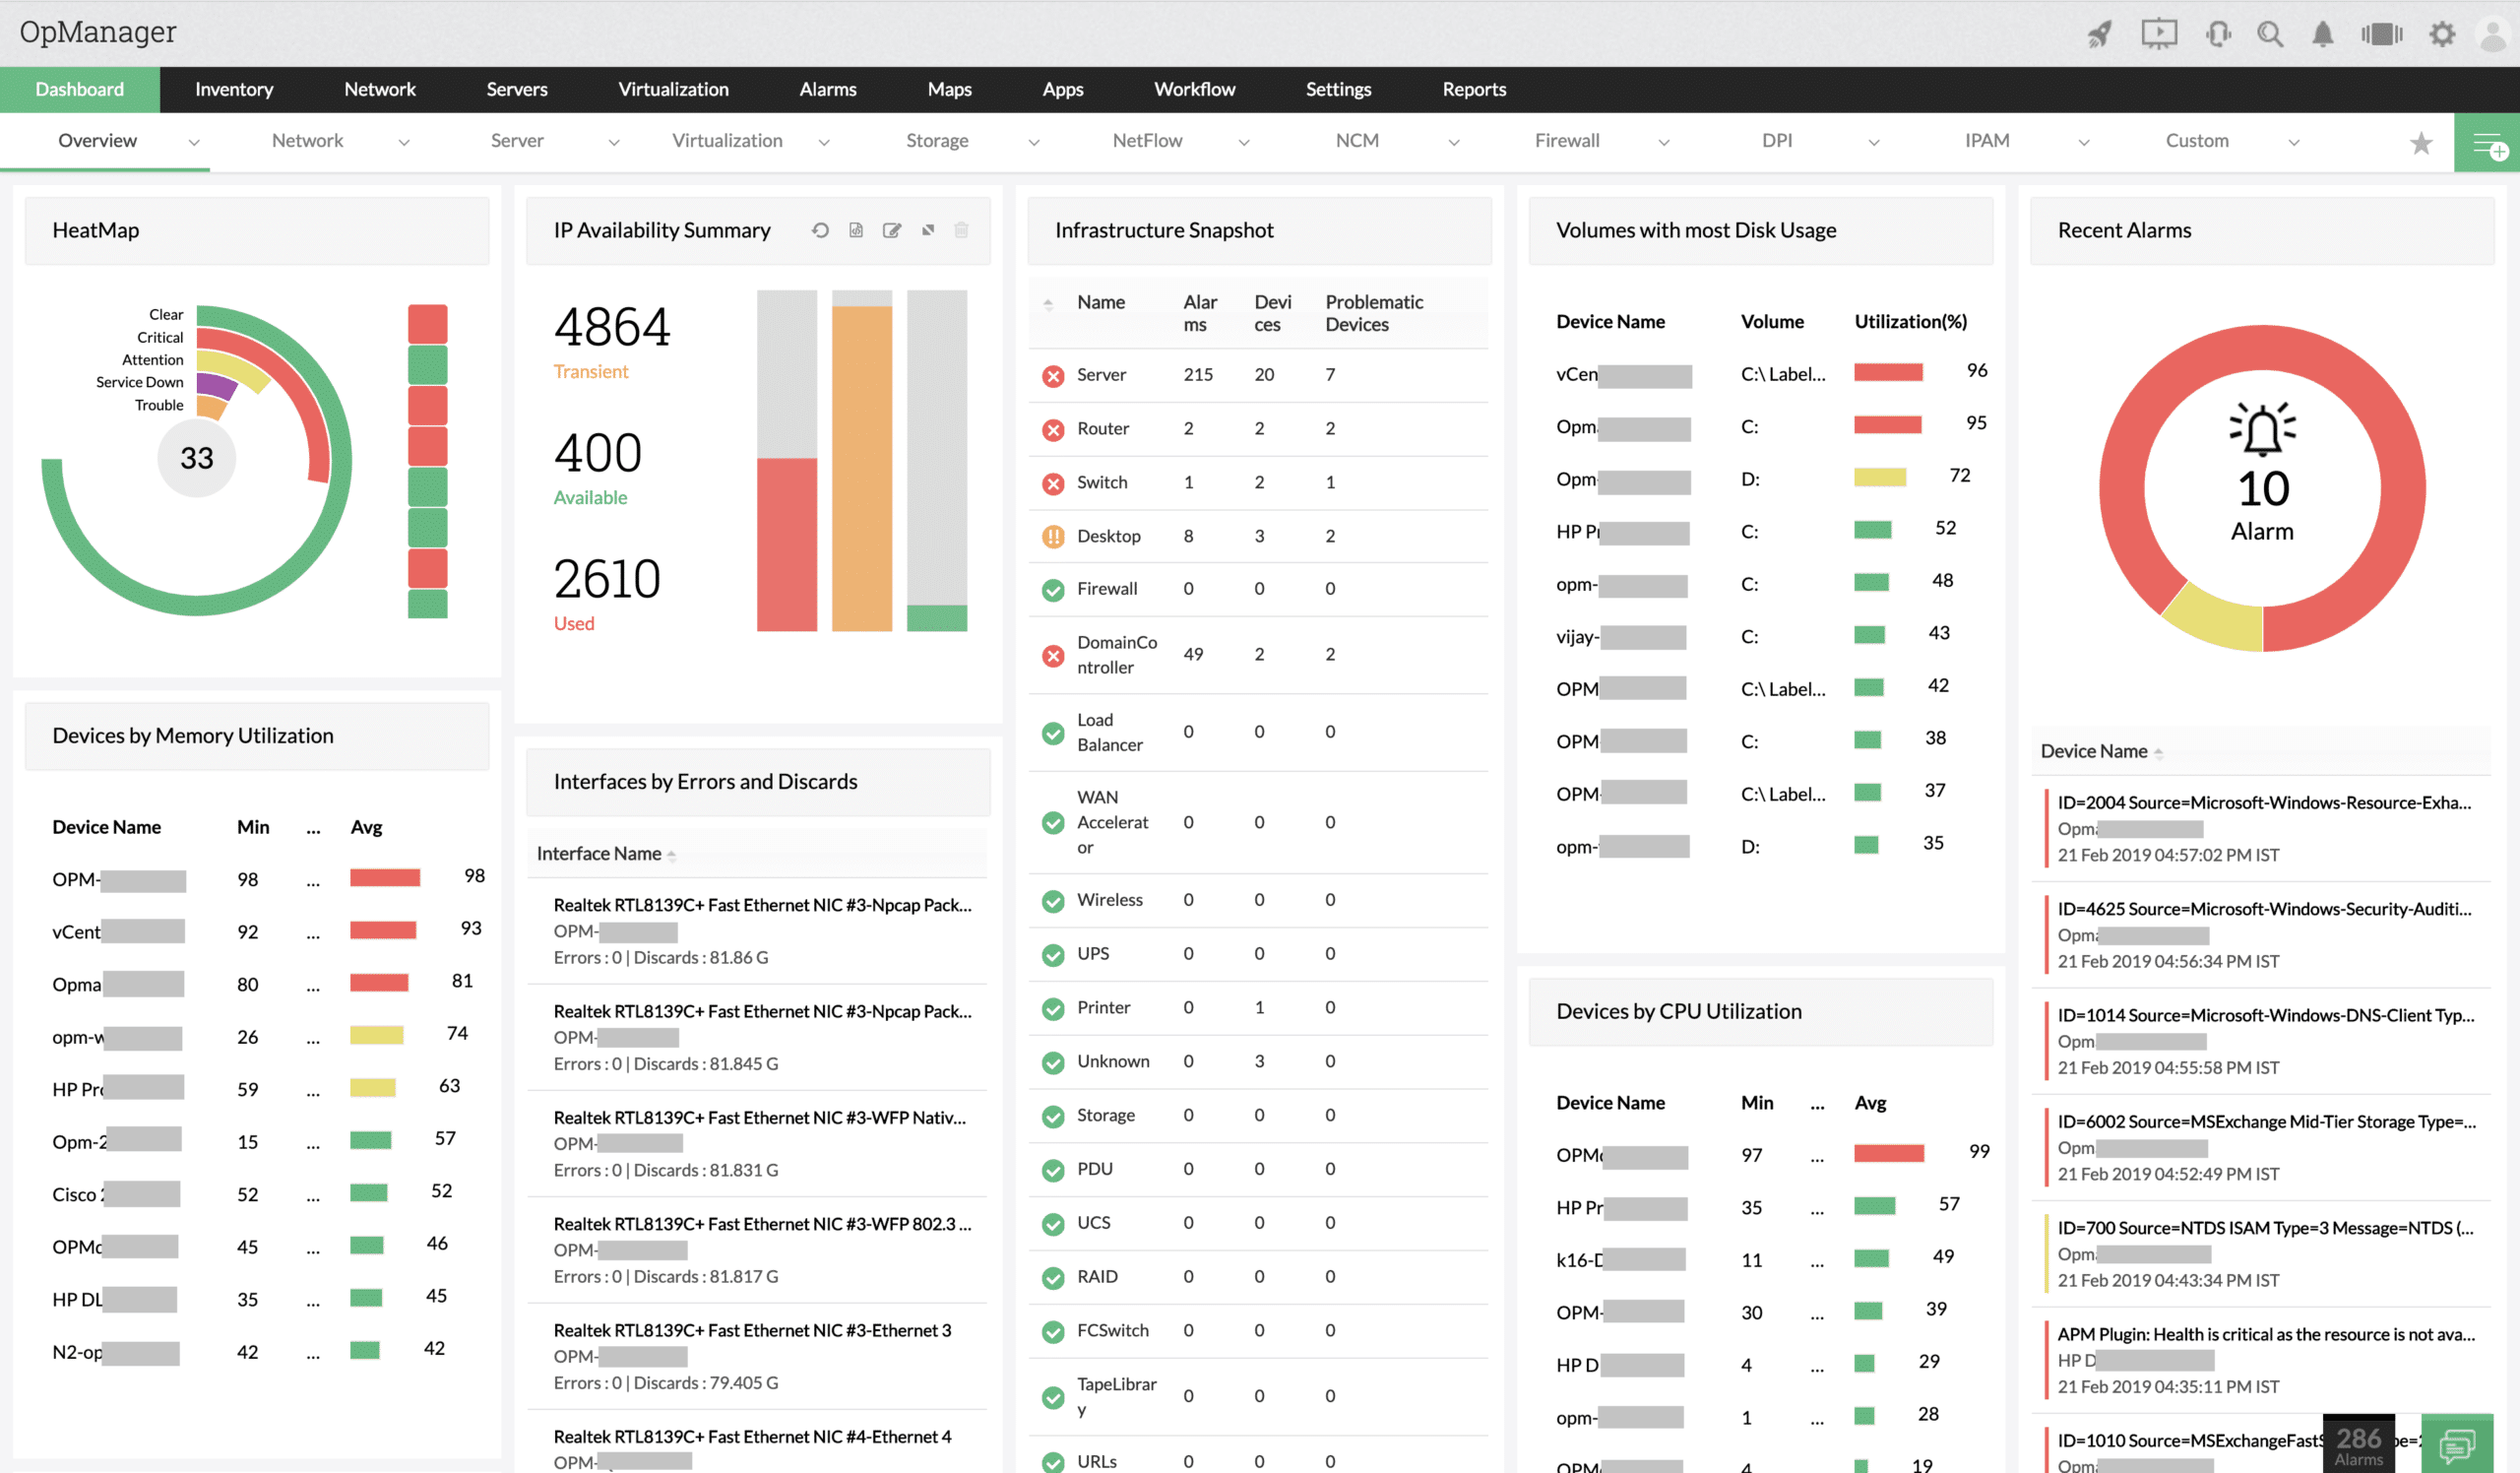
ManageEngine OpManager is an integrated solution for network management that makes it easy and effective. It lets network and IT administrators do several things at once, such as monitoring network performance, analyzing bandwidth, managing configuration, managing firewalls, monitoring storage, managing IP addresses (IPAM), and managing switch ports (SPM).
Key Features:
- Acts as an SNMP manager and constantly checks the health status of devices.
- Gets SNMP Traps and sends out alerts when a device has a problem.
- Sets up performance limits and finds system problems.
- Keeps an eye on the availability of resources.
- Live data dials and graphs that can be changed to fit your needs.
- Alerts are sent to people by email or SMS.
Why do we recommend it?
ManageEngine OpManager offers a comprehensive blend of monitoring and analysis features, making network management both straightforward and effective. Its customizable dashboard enhances visibility and control over network issues.
When it comes to tools for managing networks, this one has a good mix of features for monitoring and analyzing. The solution can take care of your network, servers, network configuration, network faults, and performance, and it can also look at the traffic on your network. Manage Engine OpManager has to be installed on-premises so that it can be used.
Also, OpManager’s custom dashboard lets you see all of your most important network metrics in one place, so you don’t have to switch between screens. This gives you full control and full visibility so that you can easily fix any network problems.
One of the best things about this product is that it comes with network monitor device templates that are already set up. These have monitoring parameters and time intervals that have already been set for certain types of devices. The product’s essential edition costs $595 and can be used on up to 25 devices.
Who is it recommended for?
This tool is ideal for network and IT administrators seeking an integrated solution for monitoring network performance, managing bandwidth, and ensuring resource availability.
Pros:
- Efficient SNMP manager with real-time device health monitoring.
- Sets performance thresholds to identify system issues.
- Sends alerts via email or SMS for prompt response.
Cons:
- Requires on-premises installation, limiting flexibility.
Get started by registering for a 30-day free trial.
3. Paessler PRTG (FREE TRIAL)

Paessler PRTG is a package of tools to monitor networks, servers, and applications. This service includes a discovery routine that identifies all of the hardware on the network and creates a network inventory and topology map. That routine repeats continuously, so the inventory and map are kept up to date.
Key Features:
- Network Discovery and Mapping: Automatically scans hardware on the network, creating and updating an inventory and network topology map in real-time.
- SNMP Monitoring: Continuously tracks the status of network devices using SNMP, providing real-time performance data.
- Switch and Router Monitoring: Provides detailed insights into switch and router capacity and utilization to prevent bottlenecks.
- Custom Alerts via SNMP Traps: Converts SNMP Traps into alerts and notifies users via email or SMS for quick issue resolution.
- Ping and Traceroute Tools: Offers essential performance troubleshooting services like Ping and Traceroute to quickly identify network issues.
Why do we recommend it?
Paessler PRTG is highly recommended for its ability to offer full-stack monitoring across networks, servers, and applications. Its continuous network discovery and real-time updates ensure that system administrators always have an accurate view of their infrastructure. The platform’s versatility in handling both SNMP-based device tracking and performance troubleshooting makes it an excellent tool for organizations that require both proactive and reactive monitoring. Additionally, the flexible sensor-based pricing model is appealing for businesses of all sizes.
The PRTG bundle includes network traffic monitoring as well as device status tracking either of these two network monitoring avenues can alert technicians to evolving problems. For example, the main cause of dropped packets is an overloaded switch; alternatively, a switch that has reached full capacity is going to cause packet loss.
The network monitoring service can be combined with server and application monitoring to provide full stack observability. The package also includes tools to monitor cloud platforms, virtualizations, and web systems. A problem with a network device is going to emerge as performance problems at every layer of the service stack. The combination of monitoring tools in the PRTG package supports rapid root cause analysis when problems arise.
Who is it recommended for?
PRTG is ideal for IT teams in mid-to-large-sized organizations that need comprehensive network, server, and application monitoring. It’s particularly well-suited for businesses that require customizable alerting and rapid root cause analysis across their entire service stack. Managed Service Providers (MSPs) and enterprises managing complex infrastructures will also benefit from PRTG’s extensive capabilities in monitoring cloud platforms, virtualized environments, and network devices.
Pros:
- Comprehensive Monitoring: Combines network, server, and application monitoring into one platform, allowing for full-stack observability.
- Real-Time Inventory Updates: The discovery tool continuously updates the network inventory and topology map, ensuring accurate data for network management.
- Rapid Root Cause Analysis: By monitoring both device performance and network traffic, PRTG aids in quickly diagnosing the source of network problems.
- Flexible Pricing Model: The sensor-based pricing allows businesses to only pay for what they need, making it cost-effective for small and large networks alike.
- Multi-Layer Monitoring: The tool’s ability to monitor virtualizations, cloud platforms, and web systems offers wide applicability across different IT environments.
Cons:
- Windows-Only On-Premises Version: The on-premises software is limited to Windows Server, which may not suit organizations using other server platforms.
Paessler charges for PRTG as an allowance of sensors. Buyers then decide which sensors to activate up to the number that was paid for. A company that only wants to activate 100 sensors never has to pay for the package. This system is available as a SaaS platform and also as a software package that will run on Windows Server. Paessler offers PRTG on a 30-day free trial with all sensors activated.
4. Site24x7 Network Monitoring (FREE TRIAL)

The Site24x7 Monitoring agent doesn’t put your server’s security at risk in any way. The Site24x7 server monitoring agent only uses a one-way HTTPS connection, which works well with firewalls and usually doesn’t require you to open any new ports to the outside.
Key Features:
- Auto-discovery for a network device inventory that is always up to date
- Automatic mapping of a network’s topology
- Includes monitoring of the internet’s performance for things like VPNs
- Storage clusters have their monitoring routines.
- Keeps an eye on the boundary and edge services like load balancers
Why do we recommend it?
Site24x7 excels in providing comprehensive information on uptime, web application performance, and network health. Its focus on hardware monitoring and automatic updates of network inventory and topology maps makes it a reliable choice.
The platform lets users get information about uptime, the performance of web applications, internet services, and private networks. Site24x7’s best features include monitoring website performance, web page speed (browser), DNS servers, website availability, website defacement monitoring, File Transfer Protocol (FTP) speed, Representational State Transfer (REST) API, Secure Sockets Layer (SSL)/Transport Layer Security (TLS) certificates, and more.
Switches, routers, firewall appliances, power supplies, load balancers, wireless networks, cloud services, and WAN connections are all monitored by Site24x7. It’s not a traffic monitor for the bandwidth. The monitor focuses on hardware that is hooked up. When you look at the Site24x7 package as a whole, you can see that the system also keeps an eye on servers and endpoints. It also keeps track of how well applications work.
The Simple Network Management Protocol (SNMP) is used by the site Monitor to check the status of devices every minute. If these answers show that there have been changes to the network infrastructure, the inventory and topology map are updated. The network monitoring service that comes with this package starts by looking for devices that are connected to the network. IT writes down what it finds in a network inventory and makes a topology map of the network.
Who is it recommended for?
This platform is suited for businesses needing constant monitoring of websites, servers, and network infrastructure, especially those managing edge services like load balancers.
Pros:
- Monitors internet performance for VPNs and other services.
- Focuses on boundary and edge service monitoring.
- Uses SNMP for minute-by-minute device status updates.
Cons:
- Not primarily a bandwidth traffic monitor.
5. Datadog Network Monitoring

Datadog Network Performance Monitoring (NPM) uses a unique, tag-based method to track the performance of on-premise and cloud-based networks. This lets you break down network traffic between hosts, containers, services, or any other tag in Datadog.
Key Features:
- Shows how network traffic moves between hosts, containers, and even more abstract ideas like services.
- Matches data about network traffic with relevant application traces, host metrics, and so on.
- Shows the flow of traffic visually on an interactive map to help find traffic jams and their effects.
Why do we recommend it?
Datadog Network Monitoring is distinguished by its tag-based approach, offering exceptional insights into network traffic. Its ability to correlate network data with application traces and host metrics makes it a robust tool for comprehensive network analysis.
You can set your own thresholds to get alerts about whatever you want. The alerting system is also available in the Network Performance Monitor, so when bottlenecks start to form, the traffic limits will be brought to your attention.
Datadog is a great network and service monitoring service for IT shops that are in the middle size range. If you can get past the initial setup and agent-based architecture, it has a lot to offer, like a lot of integrations, dashboards, and flexible alerts.
You can set up an alert forwarding rule so that you can get notifications by email, SMS, PagerDuty message, or Slack message. This means that you can leave the two network monitoring systems to watch the network on their own, knowing that you will be notified if something needs a person’s attention.
Datadog Network Performance Monitoring gives you granular visibility into network flows across multiple clouds and lets you collect and track this data using any Datadog tag.
Who is it recommended for?
It’s ideal for mid-sized IT operations needing detailed visibility into network flows across cloud and on-premise environments, with a focus on host, container, and service-level traffic analysis.
Pros:
- Offers an expansive view of network traffic patterns.
- Visualizes traffic flows on an interactive map for easy bottleneck identification.
- Integrates network data with application traces and host metrics.
Cons:
- Initial setup and agent-based architecture can be challenging.
6. Checkmk

Since 2007, Checkmk has been a free, open-source project. Every day, more than 15 full-time developers work to make Checkmk better. The Checkmk Raw Edition, which is our open-source edition, has more than 90% of our code changes. Under the GPL v2 license, we’ve shared more than 500,000 lines of code. Checkmk is based on the idea of plug-ins, which makes it a very modular monitoring solution. The plug-ins let you add vendor- and technology-specific parts to the solution so you can keep an eye on it.
Key Features:
- There are several ways to get live network topology maps
- LANs and wireless networks both need to be watched
- The ability to monitor more than one site
- Servers, applications, and networks are all kept an eye on
Why do we recommend it?
Checkmk stands out for its flexibility and modular design, offering live network topology maps and monitoring capabilities for a diverse range of network types and devices.
The SNMP system is used by the monitor to talk to switches, routers, and firewalls. All of the devices on your network will already have SNMP agents installed, but you may need to turn on that function. Checkmk asks agents for updates on their status. Responses are put together to make real-time reports on network readiness and performance.
The dashboard gives network managers an overview of all activity and then gives them several ways to get reports on individual devices, both in real-time and over time. Bandwidth monitoring is also part of the Checkmk package. This shows you where device and cable capacity is not enough to keep up with demand.
Who is it recommended for?
This tool is particularly effective for environments that require a customizable, plugin-based monitoring solution capable of supporting LANs, wireless networks, servers, and applications.
Pros:
- Comprehensive surveillance of servers, applications, and networks.
- Utilizes SNMP for effective communication with network devices.
- Offers a free open-source edition suitable for initial testing.
Cons:
- The open-source edition may lack some advanced features.
This one is mostly used to test the solution to see if the Enterprise Standard edition is the best option. It has no limits on what it can do, and you can use it for 30 days. After 30 days, you can only have up to 25 hosts. If you don’t have more than 25 hosts, you can take as long as you want. You can go straight from the Free and Raw versions to the Enterprise Standard version.
7. Progress WhatsUp Gold
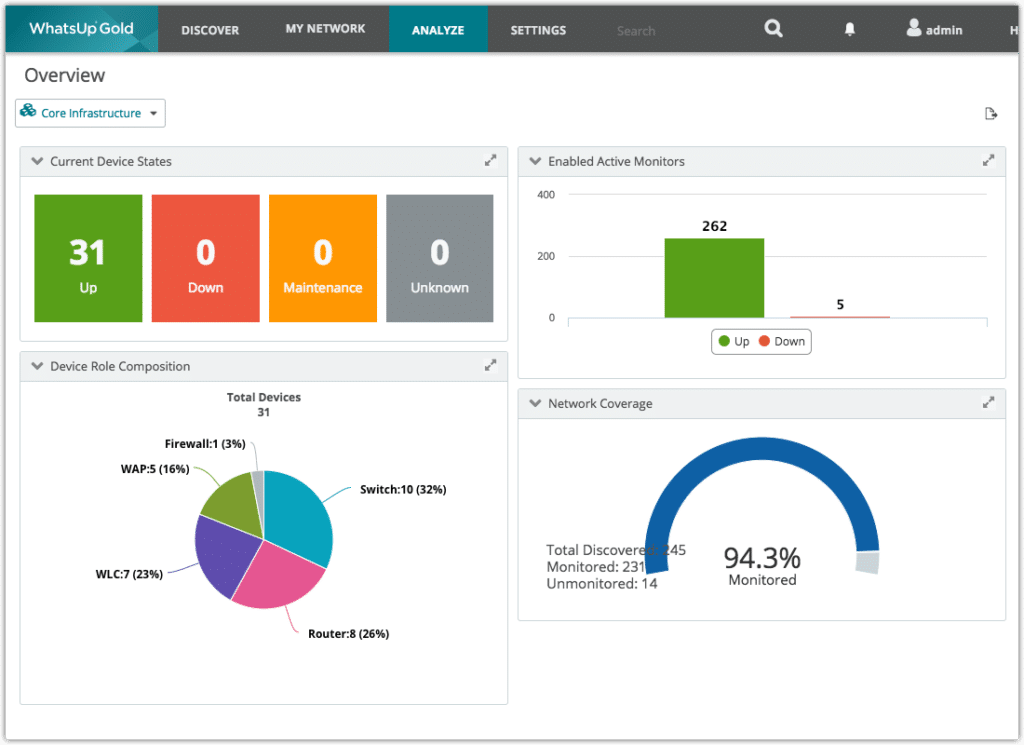
The Simple Network Management Protocol (SNMP) is used by Progress Software Corporation’s WhatsUp Gold to track how well networks are running. On each switch and router, SNMP agents make a status report and keep it up to date, waiting for an SNMP manager to ask for it. Windows Server is used to install WhatsUp Gold. There are different pricing plans for this software so that it can work with your network and your budget.
Key Features:
- Includes real-time data on how network devices are doing
- Makes charts and graphs of time-series data on the recent history of the device
- Shows a summary of the network, giving an overall status at a glance
- Support capacity planning with a list of the most popular sites and an analysis of trends
- Covers both LANs and wireless networks.
Why do we recommend it?
Progress WhatsUp Gold uses SNMP to effectively monitor network performance, offering real-time device data and comprehensive network summaries. Its ability to automatically detect cloud resources enhances its network visibility.
Each device agent answers the request, and then WhatsUp Gold puts together all of the answers. This mechanism tells the monitoring system exactly what devices are out there and which other devices each one is connected to.
Early on, WhatsUp Gold had a reputation for having simple metrics for IT professionals, but after reviewing it, we found that the platform has grown a lot and now has some of the best monitoring tools we saw in this roundup.
WhatsUp Gold software will automatically find cloud-based resources and show them on the same interactive map that shows your on-premises network. Not only can you now see and change them like any other device, but you can also see your whole networked infrastructure from end to end, which makes troubleshooting faster.
WhatsUp Gold has an interactive map of the network that shows how everything fits together. Its mapping interface is easy to use and offers filters and overlays to help you see your wireless networks, virtual environments, cloud resources, network dependencies, or interface usage.
Who is it recommended for?
It’s suitable for organizations seeking a network monitoring tool that provides detailed device metrics, trend analysis, and comprehensive overviews of both LAN and wireless networks.
Pros:
- Delivers real-time information on network device performance
- Generates detailed time-series data charts and graphs
- Aids in capacity planning with trend analysis and site popularity insights
Cons:
- The initial setup process can be complex for some user
Conclusion
Monitoring a network should be done proactively, which will help find problems early on. It can keep things from breaking down or going down. Out of all the best netowrk device monitoring tools, ManageEngine OpManager claims the top spot for its ease of use and many admin-focused features.