If you’re looking for a tool to track down network latency, you’re in the right place. While there are dozens of programs to choose from, we’ve found the top network latency testing tools you can use to track down and eliminate slowness on your network.
Here is our list of the best network latency testing tools:
- Pingdom – Best for website owners monitoring external app and user-experience latency
- NirSoft NetworkLatencyView – Best for small networks and home users seeking a free lightweight tool
- PingPlotter – Best for smaller businesses wanting real-time graphing and hop analysis
- MultiPing – Best for quick lightweight testing with alerts and DNS tracking
- Windows Ping – Best for all Windows users needing instant no-install command-line checks
- SolarWinds NTA – Best for large corporate networks requiring deep traffic and latency granularity
What exactly is network latency?
Network latency is simply the speed of the traffic across your network, usually measured in milliseconds and abbreviated as ‘ms’. While you can never truly eliminate latency all together, you can make changes to your network environment to help reduce this time and improve your network performance.
However, not all latency is created equal. While 100ms might be an okay latency for a file transfer, that same speed could cause a noticeable drop in VoIP quality or live video streaming. Luckily, there are a few tricks we can use to help prioritize specific traffic types, as well as eliminate unneeded traffic congestion altogether.
What causes network latency?
Network latency is not an easy issue to diagnose and must be looked at thoroughly to find the exact cause. Some perceived slowness on your network may be beyond your control. For example, slowness in a live steam video may have nothing to do with your network, but everything to do with the broadcaster’s connection.
When there is a legitimate latency problem, understanding where it’s coming from can be a real pain without at least some basic troubleshooting tools. Local area network issues known as packet storms or broadcast storms can cause a flurry of traffic on your LAN that makes accessing internal servers and services slow and unreliable.
Broadcast storms could be caused by a miscommunication of a device resulting in what is known as a switching loop. You can think of these loops as an echo chamber where devices continuously repeat traffic across a network causing congestion, dropped packets, and severe latency.
In more rare circumstances network latency can be the result of a sporadic DDoS attack against your network. Depending on if you have DDoS protection, this flood of illegitimate network traffic could overwhelm your firewall, server, or applications and cause severe network latency.
How can I fix my network latency?
Since network latency is such a broad problem, there is no clear-cut way to solve your latency issues in a few simple steps. There are however a few techniques you can use to dramatically improve the performance of your network that very well may fix your latency issues in the process.
Enable QoS on your router or firewall. Almost all modern network devices allow you to configure a custom QoS or Quality of Service configuration. This setting allows you to prioritize traffic based on a number of criteria such as source, type, protocol, or IP address. For example, home networks may want to lower the QoS priority of gaming traffic over the network to increase bandwidth for video chats.
Businesses often use QoS to prioritize VoIP traffic over other network packets. This helps ensure that phone calls have priority and experience less latency when the network is under a heavier load.
Avoid using unmanaged or ‘dumb’ switches. Switches and network equipment that doesn’t allow you to configure them are often referred to as dumb or unmanaged devices.
In a network environment, this unmanaged hardware can cause problems by not properly communicating with managed devices on the network. These devices are sometimes unable to understand important instructions through Spanning Tree Protocol, causing a storm of traffic and out of control latency.
Eliminate network paths one by one. If you’re dealing with a large network and inconsistent slowness, it pays to take your time and be detailed. If you have multiple switches, try and determine if the latency is only between that switch.
Test the latency of both IP addresses responses, as well as the hostname. Sometimes stubborn latency problems can be caused by wireless interference or even damaged ethernet cables. It may take a bit of leg work to properly narrow down your latency culprit, but it’s well worth ruling these issues out early in your investigation.
Use a trusted latency testing tool. Not using a network latency tool can add significant time to your investigation, which could lead to countless amounts of productive hours wasted in a corporate environment. Even a simple tool that gives you some context to your ICMP queries can go a long way when dealing with a tricky network issue.
But what’s better than solving a network latency issue quickly? It’s not getting one in the first place. There are numerous network latency testing tools now available that can help monitor the health of your network and even proactively alert you to events that could cause a rise in network latency and general slowness.
Let’s check out some of the best networking latency testing tools you can use to prevent, diagnose, and fix network latency issues.
Our methodology for selecting the best network latency testing tools:
We’ve broken down our analysis for you based on these key criteria:
- Ability to provide comprehensive and detailed insights into network performance.
- Ease of use and user-friendly interface, enabling efficient network management.
- Range of features offered, including the monitoring of both virtual and physical hardware.
- Capability to swiftly identify and help resolve network latency issues.
- Compatibility with common operating systems and network environments.
The best network latency testing tools
1. ManageEngine NetFlow Analyzer (FREE TRIAL)
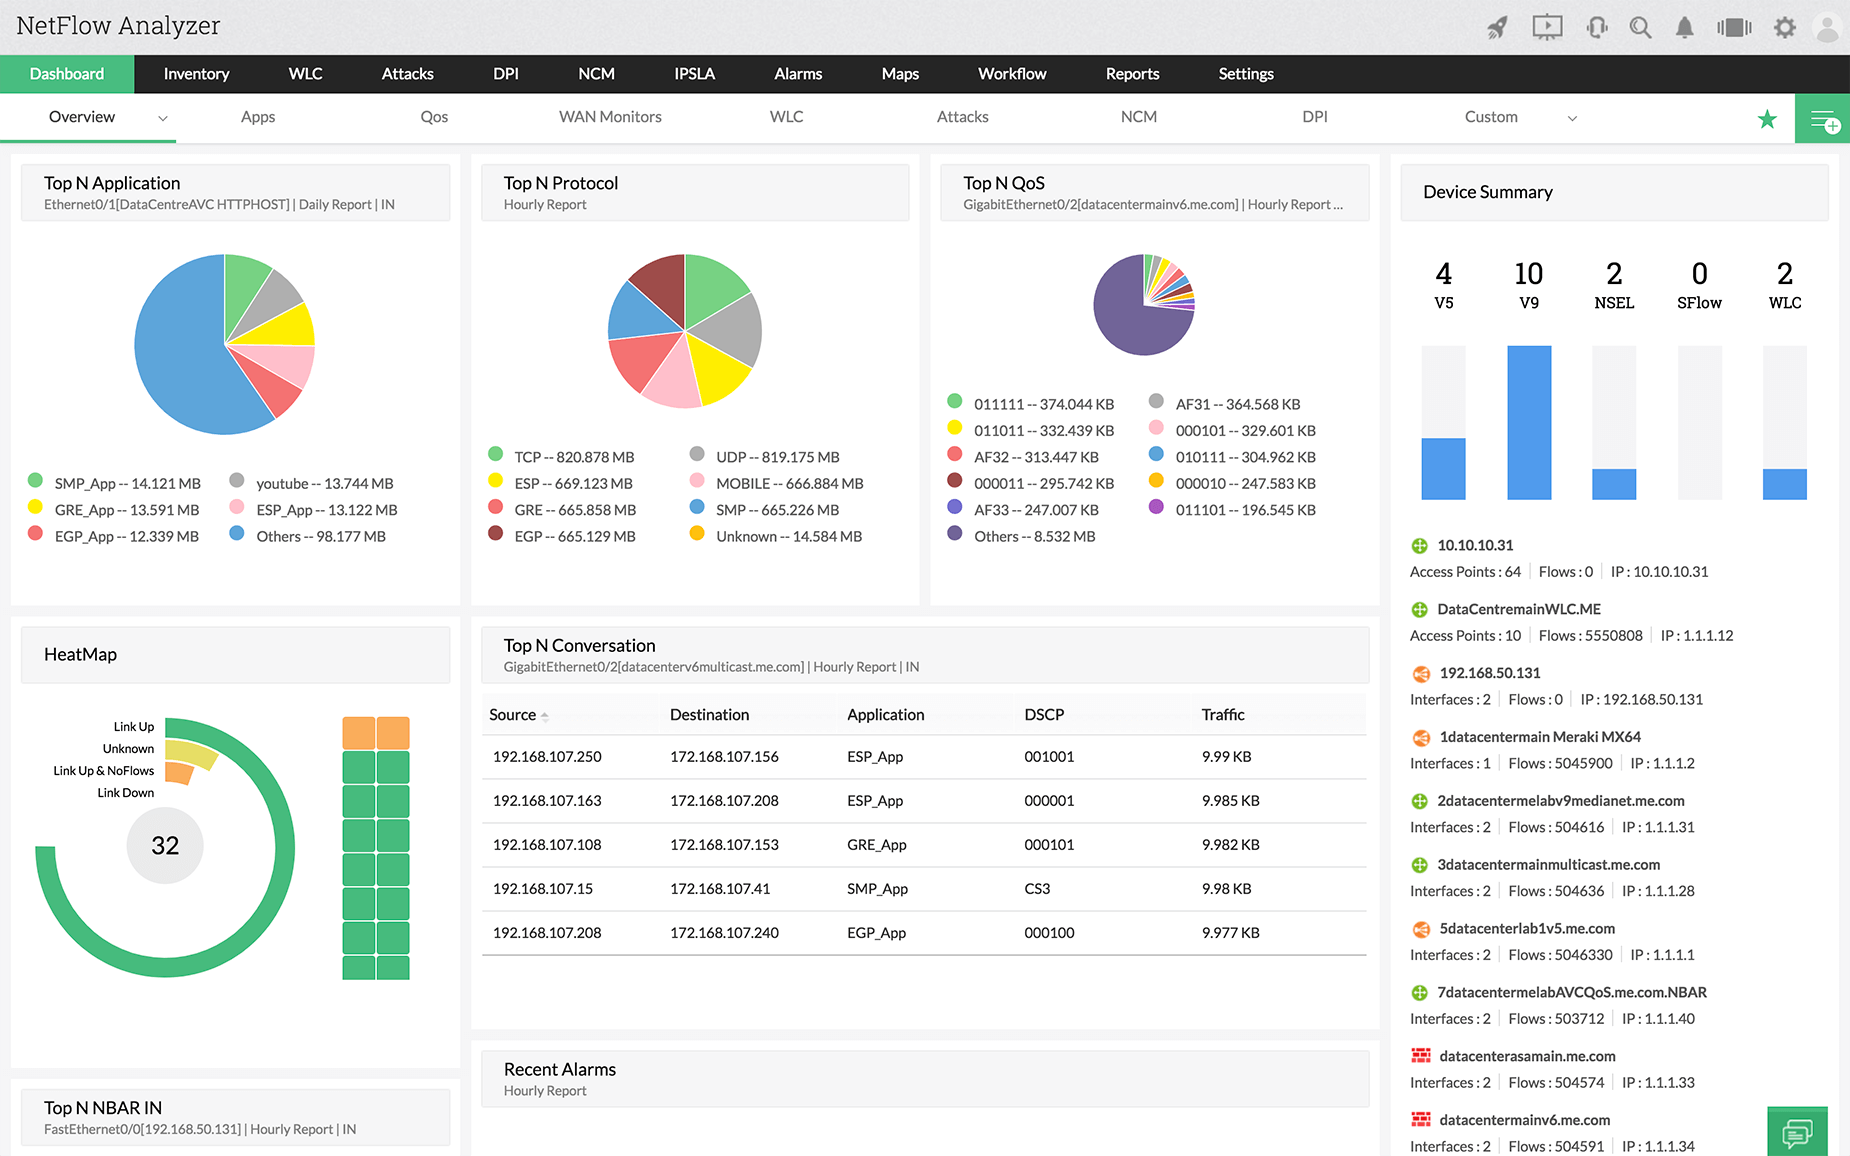
Similar to our number two pick, ManageEngine NetFlow Analyzer (MENA) also takes advantage of flow-based network traffic monitoring to provide realtime visibility and traffic insights. Drill down into the exact time and location where specific latency issues occur, and uncover traffic patterns down to the individual interface.
Key Features:
- Real-time visibility into traffic
- Recognizes non-standard applications
- Intelligent network classifications
- IP SLA Monitor for vendor performance
Why do we recommend it?
ManageEngine NetFlow Analyzer is a highly recommended network latency testing tool that excels in providing real-time visibility and insights into network traffic. It allows users to drill down to specific times and locations where latency issues occur, enabling them to pinpoint problem areas with precision. One of MENA’s unique features is its ability to recognize non-standard applications and their services based on protocol, not just port numbers, thanks to Cisco’s NBAR technology. This feature is particularly valuable for larger, complex networks, as it streamlines the process of tracking down traffic sources.
A unique feature of MENA is its ability to recognize non-standard applications and detect their services based on protocol, not just the port the traffic is flowing over. This is done by using Cisco’s NBAR to provide intelligent network and application classifications. If you have a larger unruly network, this feature alone performs a lot of the manual investigative work you might have to perform to track down traffic sources.
MENA can integrate and analyze flows from other vendors such as 3COM, Juniper, HP, and Cisco, making this a great tool to use if you’re already collecting traffic from different devices or software. Sometimes application latency is out of your hands. The IP SLA Monitor is simple to set up and will alert you if your third party vendors are reaching or breaking a specified threshold that you can configure.
Not only does MENA have built-in reporting, but it gives you access planning and billing tools to help use network data to expand your infrastructure, and assign a monetary value to the companies data usage. MENA is compatible with both Windows and Linux and even has mobile versions on iOS and Android.
Who is it recommended for?
It caters to those who require real-time insights into network performance and traffic patterns, making it an ideal choice for managing latency issues. Its compatibility with multiple vendors and platforms, as well as its ability to recognize non-standard applications, positions it as a valuable tool for users dealing with diverse and complex network environments. Whether you are tracking network traffic, identifying latency culprits, or monitoring third-party vendor performance, MENA offers versatile functionality for a broad range of network management tasks.
Pros:
- Detailed analysis of latency issues
- Supports various network device vendors
- Monitors third-party vendor performance
Cons:
- Might be complex for smaller network setups
If you’re looking to test out ManageEngines’s Netflow Analyzer you can download a 30-day free trial for yourself to try.
EDITOR'S CHOICE
ManageEngine NetFlow Analyzer is our top network latency testing tool because of its exceptional real-time visibility into network traffic and its ability to pinpoint latency issues with precision. The tool’s unique capability to recognize non-standard applications through Cisco’s NBAR technology is particularly beneficial for managing complex networks. This feature simplifies the tracking of traffic sources, which would otherwise require extensive manual investigation.
Additionally, its IP SLA Monitor allows users to assess vendor performance, ensuring that service level agreements are met. With broad compatibility across various vendors and platforms, including Windows, Linux, iOS, and Android, ManageEngine NetFlow Analyzer stands out as a versatile and powerful tool for network management.
Download: Download a 30-Day Free Trial
Official Site: https://www.manageengine.com/products/netflow/
OS: Windows, Linux, iOS, Android
2. Site24x7 (FREE TRIAL)
Positioned as a broad network monitoring service, Site24x7 is particularly effective at measuring latency so businesses can improve performance and maintain a better user experience. It helps IT teams trace the source of delay, which supports quicker troubleshooting and more efficient network administration. By testing latency between network devices, the system delivers live visibility into network health.
Key Features:
- Network latency measurement
- Live performance tracking
- Threshold-based notifications
- Automatic device discovery
Why do we recommend it?
We recommend Site24x7 for network latency testing because it identifies delay-related issues accurately, presents results through an interface that is easy to work with, and ties latency testing into a wider monitoring toolset. Real-time testing combined with customizable alerts allows network teams to respond before performance bottlenecks grow worse.
The discovery service reduces the effort involved in managing infrastructure by identifying connected devices automatically. Using SNMP, ICMP, and WMI, the platform scans the environment, detects assets, and follows their status over time. This keeps IT teams informed about newly added devices and changes across the network with current and reliable data.
For every device it finds, the service generates detailed records. Its mapping capability adds a live visual view of the infrastructure, showing how devices connect and helping administrators understand the network layout. That visibility makes it easier to trace latency problems and confirm that traffic is moving properly across links and devices.
Round-the-clock observation is also included. The platform reports live data on latency, packet loss, and bandwidth consumption, allowing businesses to follow network conditions continuously. This ongoing oversight helps IT teams catch developing issues before end users are affected and supports a more stable, better-performing network.
Users are supported with detailed guides and tutorials covering setup, alert configuration, and result interpretation. The package also includes an extensive knowledge base and access to customer support, helping businesses resolve difficulties that arise while using the service.
Who is it recommended for?
The package suits businesses of any size that need dependable network monitoring and latency testing. It is especially useful for organizations with large or distributed networks and for those that must maintain low latency for mission-critical applications. Network administrators, IT teams, and service providers can all benefit from the depth of insight and continuous monitoring it provides.
Pros:
- Automatic device documentation
- Detailed reporting for historical review
- Straightforward integration with broader monitoring functions
- A cloud-hosted platform
Cons:
- No self-hosted deployment option
Site24x7 provides a 30-day free trial, giving organizations an opportunity to evaluate the tool before committing.
3. Paessler PRTG (FREE TRIAL)
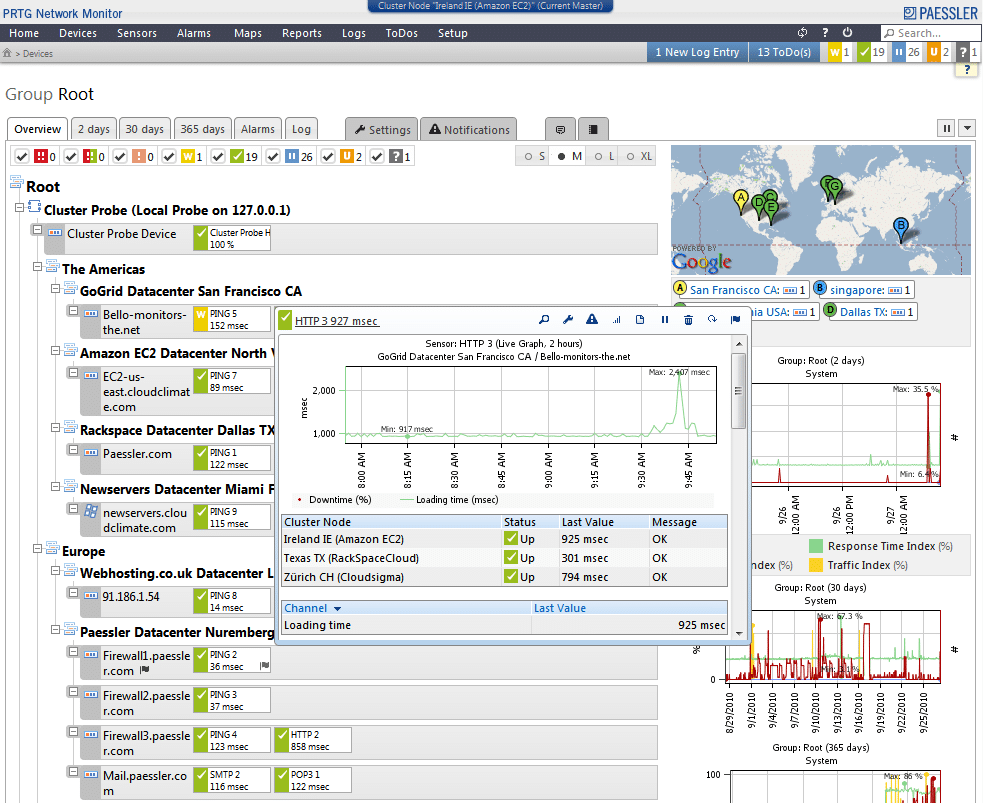
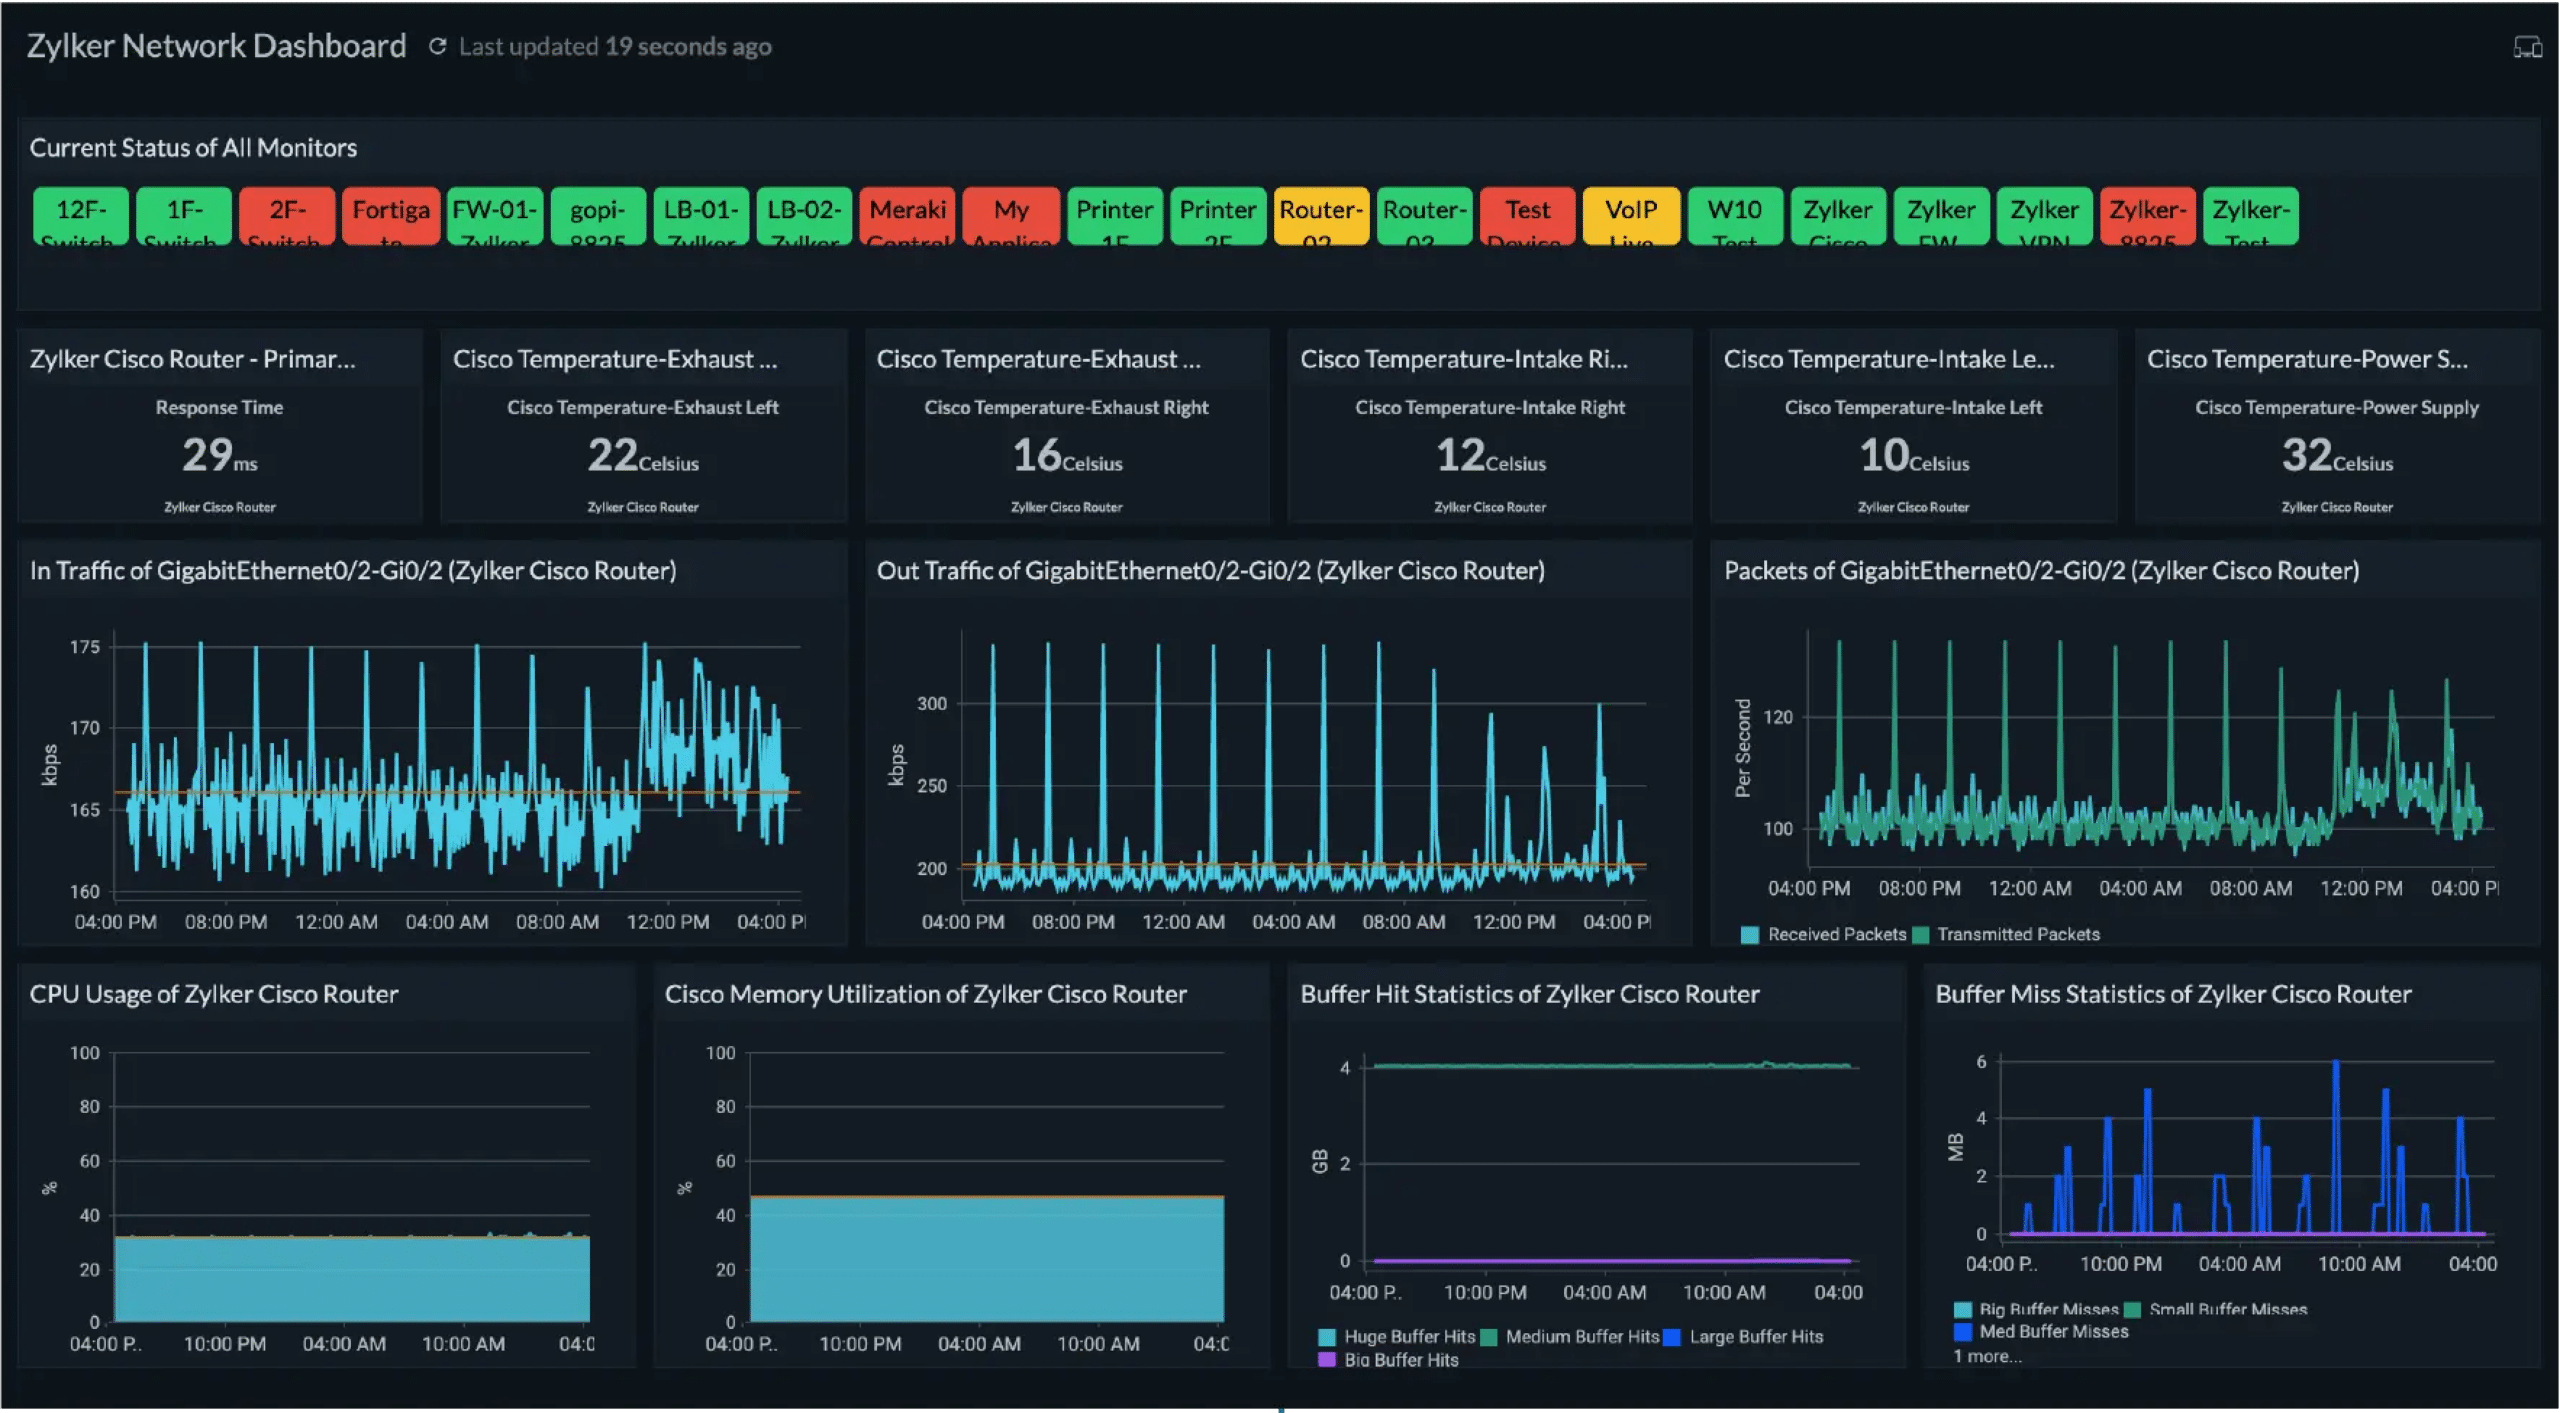
If you need to track and proactively monitor network speeds, bandwidth, and uptime across your networks, Paessler PRTG is one of the best. When it comes to finding the source of latency or connectivity issues PRTG makes visualizing your network and resources simple. Pinpointing slowness can be as easy as glancing at a dashboard when PRTG is configured to do so.
Key Features:
- Comprehensive network monitoring
- Customizable dashboard and maps
- Cloud and on-premises monitoring
Why do we recommend it?
Paessler PRTG is highly recommended for its efficient network monitoring capabilities, making it ideal for users who need to track network speed, bandwidth, and uptime. It excels in visualizing network elements, simplifying the identification of latency and connectivity issues. PRTG stands out with customizable dashboards, allowing for streamlined data presentation and sharing via URL. It offers comprehensive tools for measuring latency, supports a variety of alerting options, and facilitates reliable network management, particularly for organizations focused on maintaining specific uptime levels and cloud service reliability.
If you’re a sysadmin you’ll enjoy the level of customization and freedom PRTG gives you when creating your own dashboard. You can monitor all of your network’s assets from the PRTG map designer, which gives you access to over 300 map objects, charts, and lists. This is perfect for static displays in your NOC, or on a spare monitor at your desk. One of my favorite features is the ability to share custom dashboards as a URL, and give anyone access to the same metrics you’re monitoring.
PRTG gives you all the tools you need to measure latency across your applications and devices. Measure SNMP, SSH, HTTP, SQL, and REST API response time all with minimal configuration. When you’re not at your dashboard, alerting can be configured based on customized thresholds and times. You can receive email alerts, desktop notifications, or be alerted directly on your Android or iOS phone through the PRTG app. If you have your own internal software, you can use PRTG API to script your own notifications.
If you’re a NOC who needs to adhere to a specific level of uptime, the clutter failover option will help keep your team informed and in the loop, even during network issues. Automatic failover handling will immediately assign another node to take over all of the altering and reporting responsibilities for the given network. This feature is available for both the cloud and on-premises version of PRTG.
If you utilize third-party cloud services, PRTG can monitor their uptime to ensure you have acceptable speeds and continuous availability from multiple locations across the world. This not only helps you ensure your team is reliably connected from anywhere but also verifies that your vendors are within their own service level agreement.
If network latency and service outages are unacceptable in your environment, PRTG gives you everything you need to catch network traffic issues, before they result in calls to the help desk.
Who is it recommended for?
Paessler PRTG is an excellent choice for network administrators, system administrators, NOC personnel, and users seeking robust network monitoring solutions. It’s particularly valuable for organizations that require proactive monitoring of network performance and uptime. Specific use cases include network administrators responsible for network maintenance, system administrators in need of flexible dashboards, NOC personnel overseeing uptime, organizations relying on cloud services, and users requiring effective alerting for network management. PRTG is versatile and adaptable, catering to a wide range of network monitoring needs.
Pros:
- Offers a wide range of monitoring features
- Highly customizable for specific needs
- Failover handling for continuous monitoring
Cons:
- Can be complex to set up and manage
If PRTG sounds like a good fit for your network, you can try out a 30-day free trial to test out all of the features.
4. Pingdom
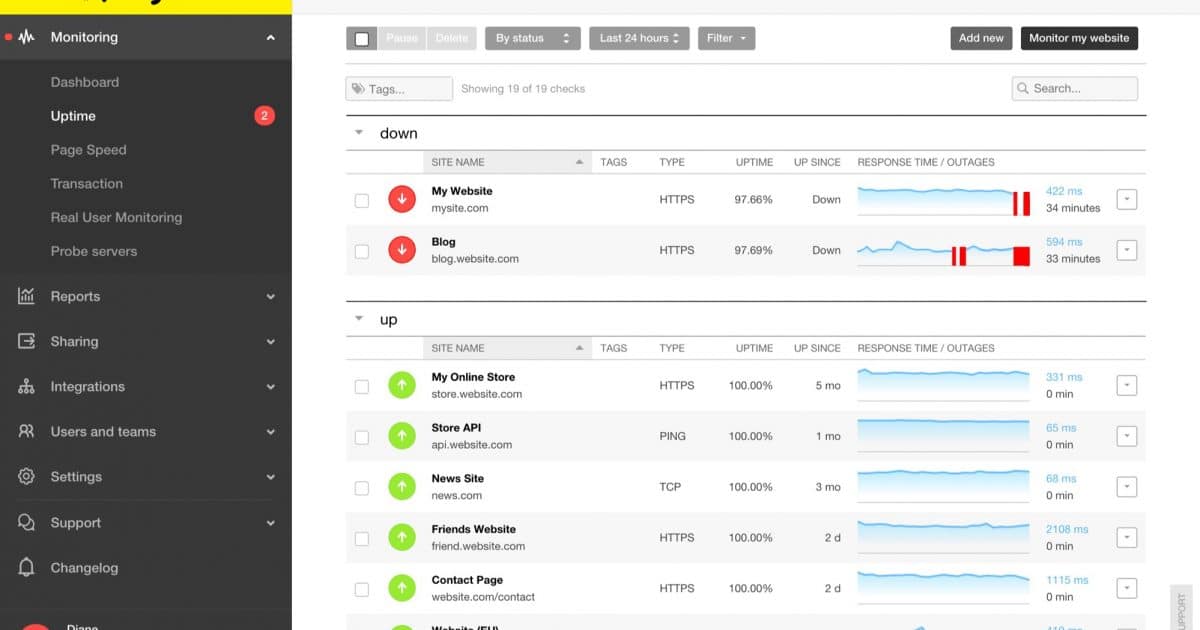
Pingdom is a SaaS product that allows you to monitor websites and applications for latency issues, uptime, and a host of other metrics. If you have the need for an external third party to monitor your outward-facing applications, Pingdom has made their services easy to use and proven to be an affordable option for small and large businesses alike.
Key Features:
- External website and app monitoring
- Detailed user interaction recording
- Provides actionable latency solutions
- Affordable SaaS product for businesses
Why do we recommend it?
Pingdom is a versatile tool that excels in tracking latency issues, uptime, and various other crucial metrics. With user interaction recording and script analysis capabilities, Pingdom provides in-depth insights into application performance, allowing users to pinpoint latency culprits. The tool stands out for its ease of use and affordability, making it accessible to both small and large businesses. It offers a valuable combination of external third-party monitoring and actionable recommendations for latency issue resolution.
Record exactly how users interact with your web content and get a detailed look into the scripts that are running or causing latency problems. In addition to latency testing tools, you’ll also be given actionable steps to help correct the problems that Pingdom discovers.
Who is it recommended for?
Pingdom is ideal for businesses of all sizes seeking to monitor website and application performance. It caters to IT professionals, web developers, and website administrators who need reliable and cost-effective monitoring solutions. Whether you have outward-facing applications or websites that require consistent monitoring, Pingdom offers a user-friendly and efficient way to track latency issues.
Pros:
- Provides detailed latency and uptime metrics
- Affordable pricing for various business sizes
- Offers steps to rectify discovered issues
Cons:
- Primarily external-focused, less on internal network monitoring
Pricing starts at just $10.00 (£8.10) a month. You can sign up for a free 14-day trial.
5. NirSoft NetworkLatencyView Tool

NirSoft NetworkLatencyView is a free tool that is more suited for smaller businesses and home networks to identify traffic usage, latency issues, and the source destination of the traffic. NetworkLatencyView is lightweight and lacks many of the in-depth analysis that some of the more modern network latency testing tools provide.
Key Features:
- Lightweight network monitoring
- Supports older Windows versions
- Real-time traffic capturing
Why do we recommend it?
Although NetworkLatencyView is lightweight and may lack some of the advanced analysis features of modern tools, it has consistently proven itself as a valuable resource since 2013. If you need a straightforward, rapid, and cost-effective solution to gain insights into your network’s performance and latency problems, NetworkLatencyView is an excellent choice. While NetworkLatencyView may not be the most advanced tool for larger enterprises, it serves as an invaluable free resource for smaller businesses and home users, offering a portable and convenient troubleshooting solution.
With that being said if you’re looking for a simple, quick, and free tool to give you a better understanding of your network slowness problems NetworkLatencyView has proven itself since 2013. If you’re running older hardware this tool can support versions of Windows going all way back to Windows 2000 and up to Windows 10 for both 32- and 64-bit architecture.
The only additional download you may need to use is the WinPcap driver and the Network Monitor driver to capture the TCP packets properly. There is a Raw Socket mode, but for the most accurate results, you’ll want to make sure you have those additional components installed as well.
Once you’re ready, simply press the Play button to start capturing traffic across your network in real-time to view which applications are suffering from latency issues. On a single window, you’ll see an exact breakdown of where the traffic is originating from, where it’s going, the hostname, and its average millisecond response time.
While this won’t be the best tool for most businesses, it’s a great free tool to throw on a flash drive in case some quick troubleshooting is ever in order.
Who is it recommended for?
This tool is well-suited for those who require a quick and free solution to identify and address network slowness problems. It is particularly valuable for users with older hardware and legacy Windows operating systems, given its broad compatibility, supporting versions from Windows 2000 to Windows 10 in both 32- and 64-bit configurations. NetworkLatencyView is also suitable for those looking for a portable troubleshooting tool to keep on a flash drive, providing the ability to rapidly assess and resolve latency issues as they arise. While it may not offer the extensive features of more complex tools, NetworkLatencyView offers simplicity and efficiency for smaller network environments and less demanding latency testing requirements.
Pros:
- User-friendly and lightweight
- Effective for basic latency analysis
- Supports a wide range of Windows versions
Cons:
- Lacks in-depth analysis features
You can download NetworkLatencyView for free on Nirsoft’s official website.
6. PingPlotter
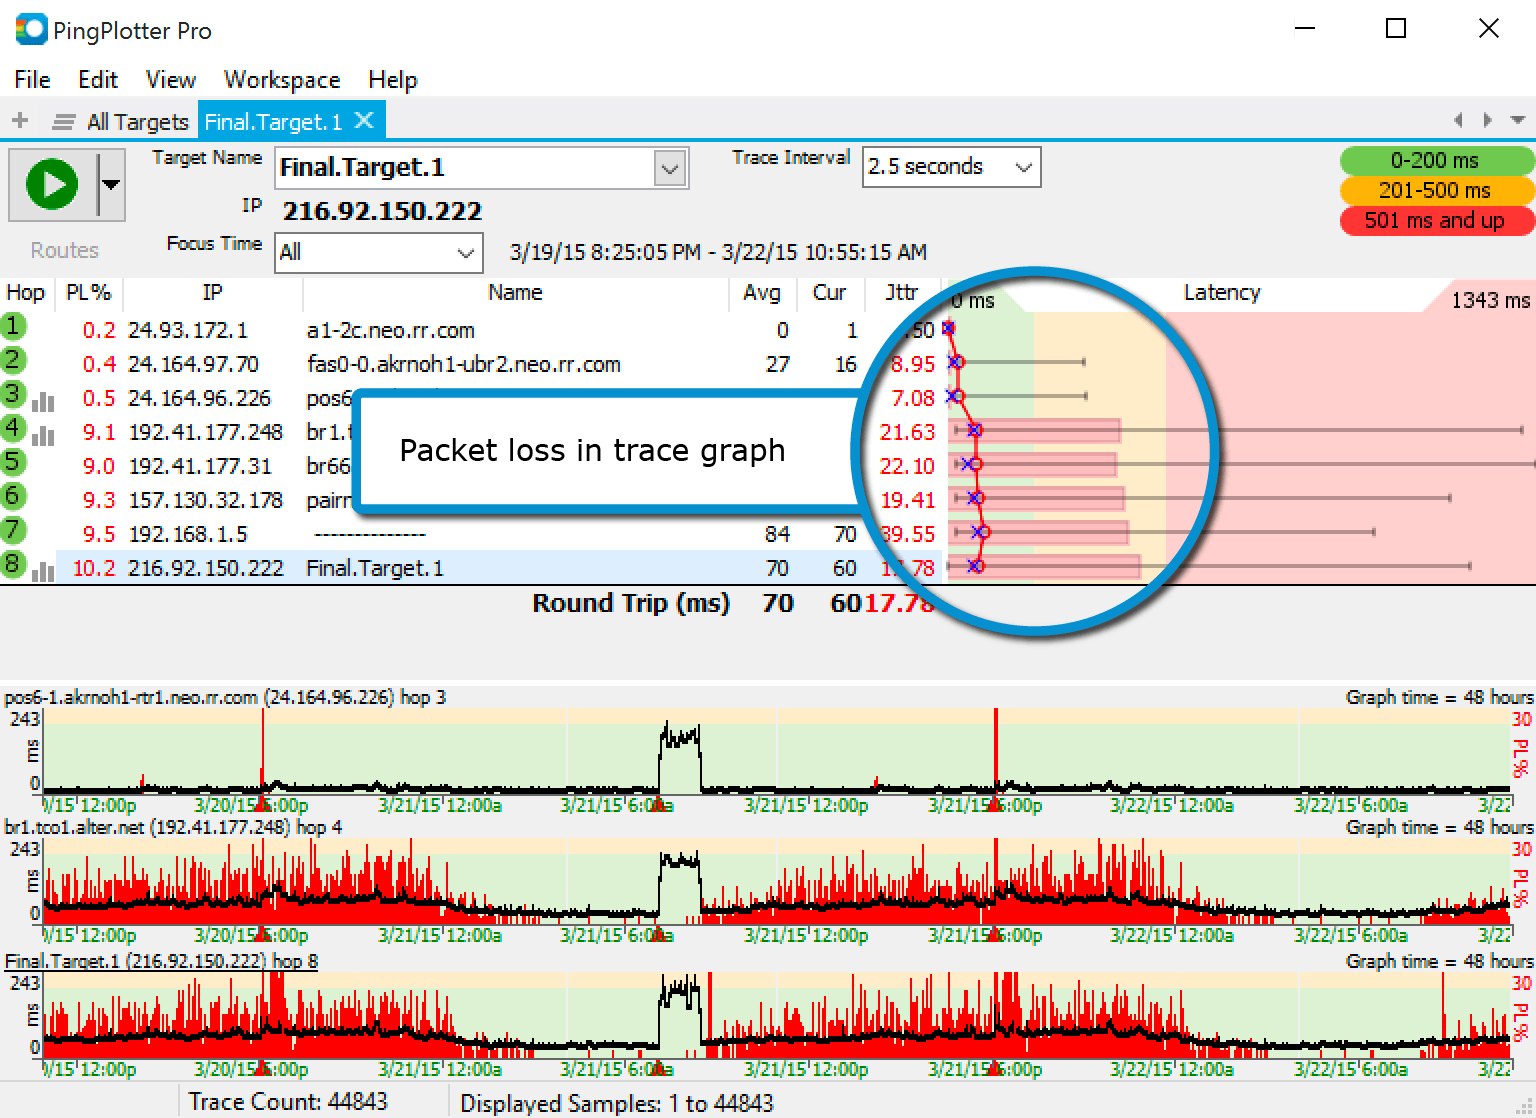
PingPlotter can be seen as a paid upgrade to NetworkLatencyView and is a bit better equipped for smaller businesses. This tool measures network latency based on an active connection in realtime, while also providing live graphing that records the time and number of hops taken.
Key Features:
- Real-time latency monitoring
- Live graphing capabilities
- Low-bandwidth deployment
- Simple setup and operation
Why do we recommend it?
PingPlotter excels in measuring network latency in real-time and provides live graphing with time and hop count recording. The tool boasts effortless deployment in various environments, ensuring minimal impact on performance due to its low bandwidth usage. It is an affordable solution for businesses with an accessible starting price, making it a valuable choice for real-time latency measurement.
Deployment is simple and can be run in nearly any environment. The tool itself uses very low bandwidth so you can measure hundreds of connections with relative ease without worrying about impacting performance.
Who is it recommended for?
PingPlotter is an excellent recommendation for smaller businesses and organizations looking for effective network latency testing tools. It is particularly suited for businesses seeking real-time monitoring and live graphing capabilities. This tool caters to a broad range of users, including network administrators, small business owners, and organizations focused on monitoring network latency, making it an accessible choice for various network management needs.
Pros:
- Live graphing for latency visualization
- Utilizes minimal bandwidth
- Affordable pricing options
Cons:
- More basic compared to comprehensive tools
Pricing starts at $29.00 (£23.49) a month or $349.00 (£282.71) for a perpetual license. You can also test PingPlotter through a 14-day free trial.
7. MultiPing

MultiPing is another great choice if you’re looking for a lightweight latency testing tool. In under 60 seconds, you can launch MultiPing to begin detecting network traffic and monitoring latency through a very simple user interface.
Key Features:
- Lightweight latency testing
- Dynamic DNS tracking
- Simple user interface
- Email and audible alerts
Why do we recommend it?
MultiPing is highly recommended for its lightweight and efficient latency testing capabilities. With a quick setup process that takes less than 60 seconds, it provides users with a straightforward and user-friendly interface. This tool stands out for its unique features, such as the ability to receive alerts when a target IP address changes using the Dynamic DNS tool. MultiPing also offers timeline-based monitoring and customizable alerts through email or audible notifications, enhancing its utility for network latency monitoring.
A few unique features that I personally enjoy is the ability to be alerted when a target IP address changes through the Dynamic DNS tool. In addition to the timeline based monitoring, you can configure an alert that notifies you via email or audibly when a threshold is reached.
Who is it recommended for?
MultiPing is an excellent choice for users seeking a lightweight and straightforward network latency testing tool. It is ideal for individuals and small to medium-sized businesses that value simplicity and quick deployment. Additionally, those who require alerting capabilities and the ability to monitor changes in target IP addresses will find MultiPing to be an invaluable tool for efficiently monitoring network latency and traffic.
Pros:
- Very easy to use and set up
- Offers key features like DNS tracking
- Configurable alerting options
- Minimalistic and effective interface
Cons:
- Limited in terms of advanced features
An evaluation trial version is available for download on the MultiPing website.
8. Ping
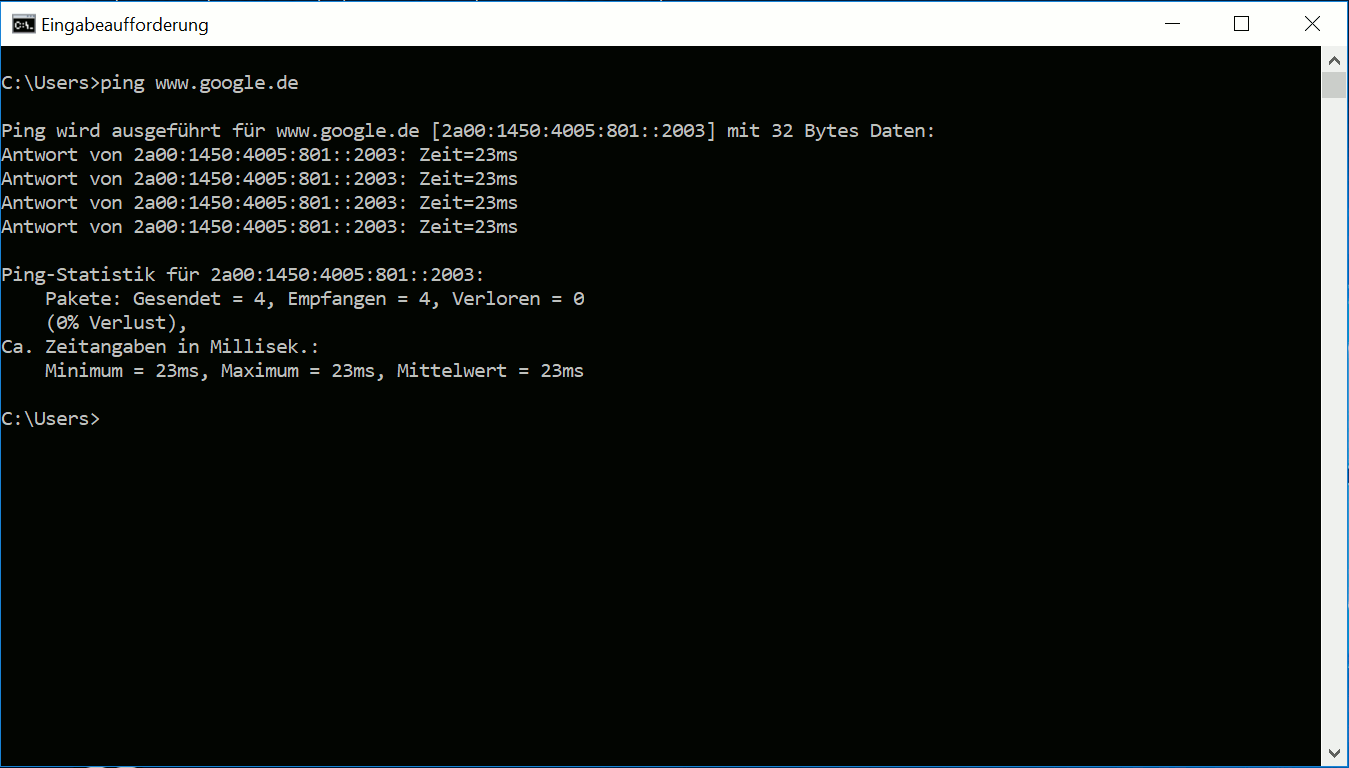
Sometimes you don’t have to go very far for the tools you need. The good old fashioned ping command is sometimes all you need to get an idea of where a problem is coming from.
Key Features:
- Built-in Windows tool
- Various command options
- Immediate latency testing
- No additional download required
Why do we recommend it?
Ping is recommended for its simplicity and immediate accessibility, making it a go-to tool for quick network diagnostics and latency testing. Its built-in nature in Windows means there’s no need for additional installations or setup, allowing users to troubleshoot basic network issues effortlessly.
Built right into the Windows command prompt, the ping command is free and comes with a bunch of different variables you can use to filter with.
Who is it recommended for?
Ping is ideal for network administrators and IT professionals who need a quick and straightforward way to diagnose network connectivity issues. It’s also suitable for anyone looking for a basic, no-frills tool to test latency without the need for specialized software.
Pros:
- Easily accessible and free to use
- Offers immediate latency results
- No installation or setup required
- Versatile for various network diagnostics
Cons:
- Limited in functionality compared to specialized tools
9. SolarWinds NetFlow Traffic Analyzer
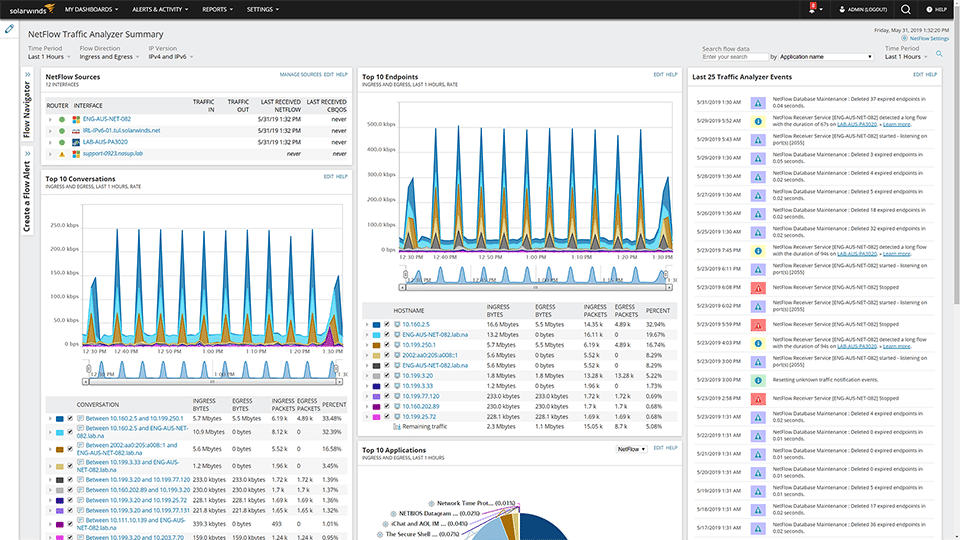
SolarWinds NetFlow Traffic Analyzer (NTA) gives you a precise breakdown of the utilization and latency for every device on your network. If you need granularity in your latency and bandwidth reporting, NTA has you covered. In addition to traditional device monitoring, you’ll have the option to dig deep and view traffic on specific source ports, destination IP, or by protocol.
Key Features:
- Precise network utilization breakdown
- Detailed traffic monitoring options
- Real-time network traffic sorting
- Customizable summary dashboard
Why do we recommend it?
SolarWinds NetFlow Traffic Analyzer provides detailed breakdowns of network device utilization and latency, giving users the granularity they need for accurate latency and bandwidth reporting. NTA offers more than just device monitoring; it allows users to delve deep into network traffic, examining specific source ports, destination IP addresses, and protocols. With the capability to set specific rules based on triggered conditions and thresholds, NTA can alert users to traffic issues, whether they are high, low, or sudden interruptions. Its advanced traffic sorting feature by application and process provides a detailed view of service performance, helping users visualize their quality of service policy on a macro level.
You’ll have the option to create monitors based on groups of devices. For example, choose to group all of your high traffic endpoints such as switches and firewalls to get an overall average of traffic flow. You can set specific rules based on triggered conditions with traffic thresholds that measure both high and low levels, as well as an alert if traffic stops completely.
Another neat feature is the ability of NetFlow Analyzer to quickly sort all network traffic by application and process. This gives you a detailed look into how your services are running, and help you visualize your quality of service policy on a macro level. Sorting traffic can be filtered by application, service, protocol, or alert status. By entering port 0 under the application filter you can bring all intrusive traffic to the top of the dashboard so you can take action to address unknown traffic or services.
While most latency testing tools fail to properly visualize this data for you, NTA brings all of this data into a cohesive real-time report that you can use to spot trends and catch speed problems in your network fast. You’ll be able to customize the summary dashboard to your liking and view your NetFlow top sources, most-used applications, and which websites are receiving the most traffic.
For larger corporate networks who need to be able to quickly identify sources of latency and get a deep understanding of what is going on in their network, SolarWinds NetFlow Traffic Analyzer not only helps you get a handle on your latency problems but gives you the tools you need to be proactive about them.
Who is it recommended for?
SolarWinds NetFlow Traffic Analyzer is highly recommended for larger corporate networks and enterprises that require in-depth insights into network latency and aim to proactively address latency-related challenges. It is an ideal choice for network administrators and IT professionals dealing with extensive and complex network environments. NTA’s capabilities are well-suited for those who need precise, real-time monitoring and reporting on network latency, bandwidth utilization, and the overall performance of their network infrastructure. With its extensive features, SolarWinds NTA empowers network professionals to efficiently manage network latency and ensure smooth network operations.
Pros:
- Offers granular latency and bandwidth reporting
- Enables monitoring traffic on various parameters
- Advanced sorting of traffic by application and service
- Customizable dashboard for tailored insights
Cons:
- May be complex for basic users
A free 30-day trial of the NetFlow Traffic Analyzer is available.
Choosing the right network latency testing tools for you
In this article we’ve reviewed some of the best ways you can detect and tackle network latency, but which latency testing tool is right for you? Do you rely on network latency testing tools to test your network? If so, which ones do you use? Let us know in the comments below.