The JBoss application server is an open-source platform created by Red Hat for implementing Java applications and a wide range of other software applications. You can develop and deploy Java services that are scalable to the size of your organization. Several fascinating features, like messaging, high-availability clustering, and distributed caching, are unlocked by integrating a JBoss application server with Wild Fly 10.
The JBoss application server is consistent with Java Enterprise Edition 7 requirements, so you should not be concerned if open-source tools make you uneasy. With a JBoss application server, you receive a free, enterprise-grade platform that is both dependable and scalable. Its service-oriented and aspect-oriented structures facilitate easy interaction with other tools. In addition, unlike most open-source tools, the JBoss application server comes with a 24/7 developer-based support system, so you’re never left in the lurch if you encounter technical issues.
List Of Best JBoss Monitoring Tools
There are numerous monitoring tools available for this JBoss server, including the following:
- SolarWinds Server & Application Monitor (FREE TRIAL) This monitoring program comprises methods for monitoring the performance of Java-based code and JBoss services. Compatible with Windows Server. Get a 30-day free trial.
- Site24x7 Application Performance Monitor (FREE TRIAL) A monitoring system that can track the performance of Java applications and other programs with which they interact. This service is cloud-based. Access a 30-day free trial.
- ManageEngine Applications Manager (FREE TRIAL) This instrument can monitor Java applications supported by JBoss. Compatible with Windows Server and Linux. Start a 30-day free trial.
- GroundWork Monitor It is a comprehensive IT infrastructure monitoring system that integrates open source and proprietary technologies inside a unified web services gateway.
- AppDynamics A monitor for applications that identify application stacks to facilitate root-cause analysis of performance issues. This service is cloud-based.
- eG Enterprise A system monitor that operates in the cloud and supports Java applications, the JBoss framework, and virtual machines.
- Dynatrace This one provides comprehensive monitoring for JBoss application servers, with its artificial intelligence understanding the complete JBoss architecture within minutes.
The Best JBoss Monitoring Tools
1. SolarWinds Server & Application Monitor (FREE TRIAL)

The JBoss Monitoring Tool from SolarWinds, which is integrated with the SolarWinds Server & Application Monitor, ensures that all Java applications operate at top efficiency. SolarWinds Server and Application Monitor’s monitoring capabilities are seamlessly extended to any homegrown or custom apps operating on the JBoss application server.
Key features:
- Monitors the availability, performance, and health of the JBoss application server and its components.
- Monitors the consumption of server CPU, memory, and disk space, and even predicts when the system will run out of these resources.
- Retrieves memory heaps and other statistics for expedited debugging.
- Monitors programs in the Java environment and assists with performance troubleshooting.
- Eliminates Java Runtime Environment memory leaks.
It employs an out-of-the-box monitoring template to monitor critical memory statistics to resolve memory leaks in the Java runtime environment. This part of the JBoss application server is responsible for monitoring heap and non-heap memory, pending and pool memory, total memory, garbage collection, and more. The examination of these statistics increases the efficiency of the discovered problem-solving activity.
SolarWinds Server and Application Monitor tracks active and current thread metrics, user time, thread CPU time, and available processes in JBoss application servers, where capacity planning is crucial. It also detects multithreading-related difficulties while monitoring the number of classes loaded and unloaded. Using this information and server hardware used for CPU, memory, and disk, it intelligently predicts when capacity will run out, enabling administrators to prepare accordingly.
SolarWinds’ ability to manage and monitor so many different parts of your IT infrastructure is, without a doubt, one of its greatest selling advantages.
You can try SolarWinds Server & Application Monitor through a free and fully functional 30-day trial.
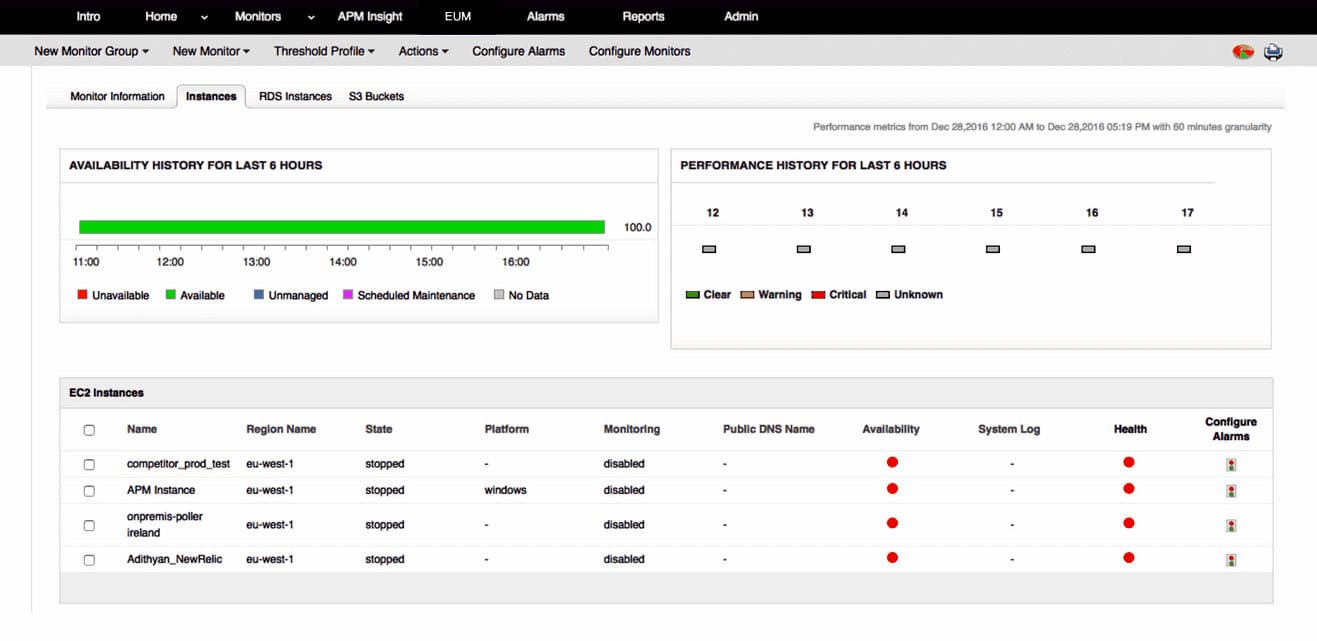
2. Site24x7 Application Performance Monitor (FREE TRIAL)

Site24x7 Application Performance Monitor is a cloud-based website and server monitoring software that allows businesses of all sizes to monitor their websites, servers, clouds, networks, applications, and real-time users. The platform enables customers to gain insight into uptime, the performance of web applications, internet services, and private networks.
Key features:
- A hosted service that eliminates the need for on-premises software and service maintenance.
- Tracing of activity across applications.
- Automatic application stack identification
- Monitoring server resource usage.
- Observes both background processes and visible activity.
- Determines all runtime exceptions for in-depth investigation and identifies memory leaks within a JVM environment.
- Notifies of performance declines.
Site24x7’s prominent features include the monitoring of website performance, web page speed (browser) monitoring, DNS servers, website availability, website defacement monitoring, File Transfer Protocol (FTP) speed, Representational State Transfer (REST) API, Secure Sockets Layer (SSL)/ Transport Layer Security (TLS) certificates, and many more. Site24x7 enables mobile access as well. The product is offered on a monthly subscription basis, with the phone, email, and online help desk support.
All processing power required to run the monitoring software is included in the price because it functions in the cloud. The service is billed on a subscription basis, so there are no significant up-front charges associated with using this monitoring tool.
The system does require the installation of an agent on the application-hosting server. This agent uploads collected statistics to the Site24x7 server over an encrypted connection for processing.
Additionally, the system console resides in the cloud and is accessible via any regular Web browser. The screens of the application can be modified using a drag-and-drop interface. The APM can monitor applications running everywhere, including those hosted by AWS, Azure, and serverless systems. You can get a 30-day free trial .
3. ManageEngine Applications Manager (FREE TRIAL)
ManageEngine Applications Manager monitors both Java heap and non-heap memory during troubleshooting, providing a heap dump to facilitate the discovery of potential issues. The automated collection of thread dumps at regular intervals aids in the detection and tracing of faulty code. With this, it is feasible to investigate the pattern of garbage collection and the dangers of deadlock, as throughput can be measured.
Key features:
- Provides precise performance indicators and statistics for continual insight into your JBoss server’s performance.
- Monitors the response time and performance of web applications installed on the JBoss server, as well as components.
- Provides quick information about the size of the connection pool and the number of new, used, and destroyed connections.
- Troubleshoots Java runtime environment memory leaks
- Includes a mobile web client, allowing you to monitor the performance of the JBoss server from your mobile device.
- Contributes to capacity planning
- Monitors the user experience of JBoss-deployed apps
- Produces straightforward reports.
Among APM tools, ManageEngine Applications Manager is ranked nineteenth. PeerSpot users have an average rating of 8 out of 10 for ManageEngine Applications Manager. The most prevalent comparison between ManageEngine Applications Manager and AppDynamics is ManageEngine Applications Manager vs. AppDynamics. The industry that is most interested in this solution is computer software, accounting for 29 percent of all views.
The performance of Java can also be fine-tuned by analyzing additional JVM parameters. This enables customization choices that would ordinarily be difficult to obtain using conventional monitoring techniques.
4. GroundWork Monitor

Groundwork monitor, a comprehensive IT infrastructure monitoring solution, blends open source and proprietary technologies under a centralized web services platform. To provide superior network, system, cloud, and application monitoring, it offers a flexible architecture that supports custom reporting and setup.
Key features:
- Monitoring of business groups, processes, and applications is the focus of its business service monitoring capabilities.
- GroundWork Monitor provides administrators with additional resources, including access to product documentation and a support site.
- The GroundWork Monitor Core version can be downloaded for free; however, it is limited to 50 nodes and lacks support.
- Request a 60-day trial for GroundWork Monitor Enterprise, which includes 250 nodes and support, or request a demonstration.
By utilizing JBoss Portal Platform 6, which acts as a portal’s Web interface and is an open-source, standards-based environment, hosted content may be published, managed, and customized. GroundWork Monitor offers both basic and bespoke dashboards, which administrators can further customize to meet their specific needs.
Dashboards provide a quick, effective, and detailed overview of data in real-time, with the opportunity to drill down into individual sub-applications, when necessary, thereby facilitating the troubleshooting process. With its NagVis presentation tool, it visualizes all collected data to make comprehension easy. Web performance control is also feasible via the dashboard, as web metrics have been included.
The auto-discovery feature of GroundWork Monitor automatically locates all visible devices on your local network and applies a set of service tests to any devices with properly configured criteria. In addition to adding and coordinating network resources with its foundation configuration database, it enables the closing of events and the cleanup of devices, services, and externals for effective maintenance.
5. AppDynamics
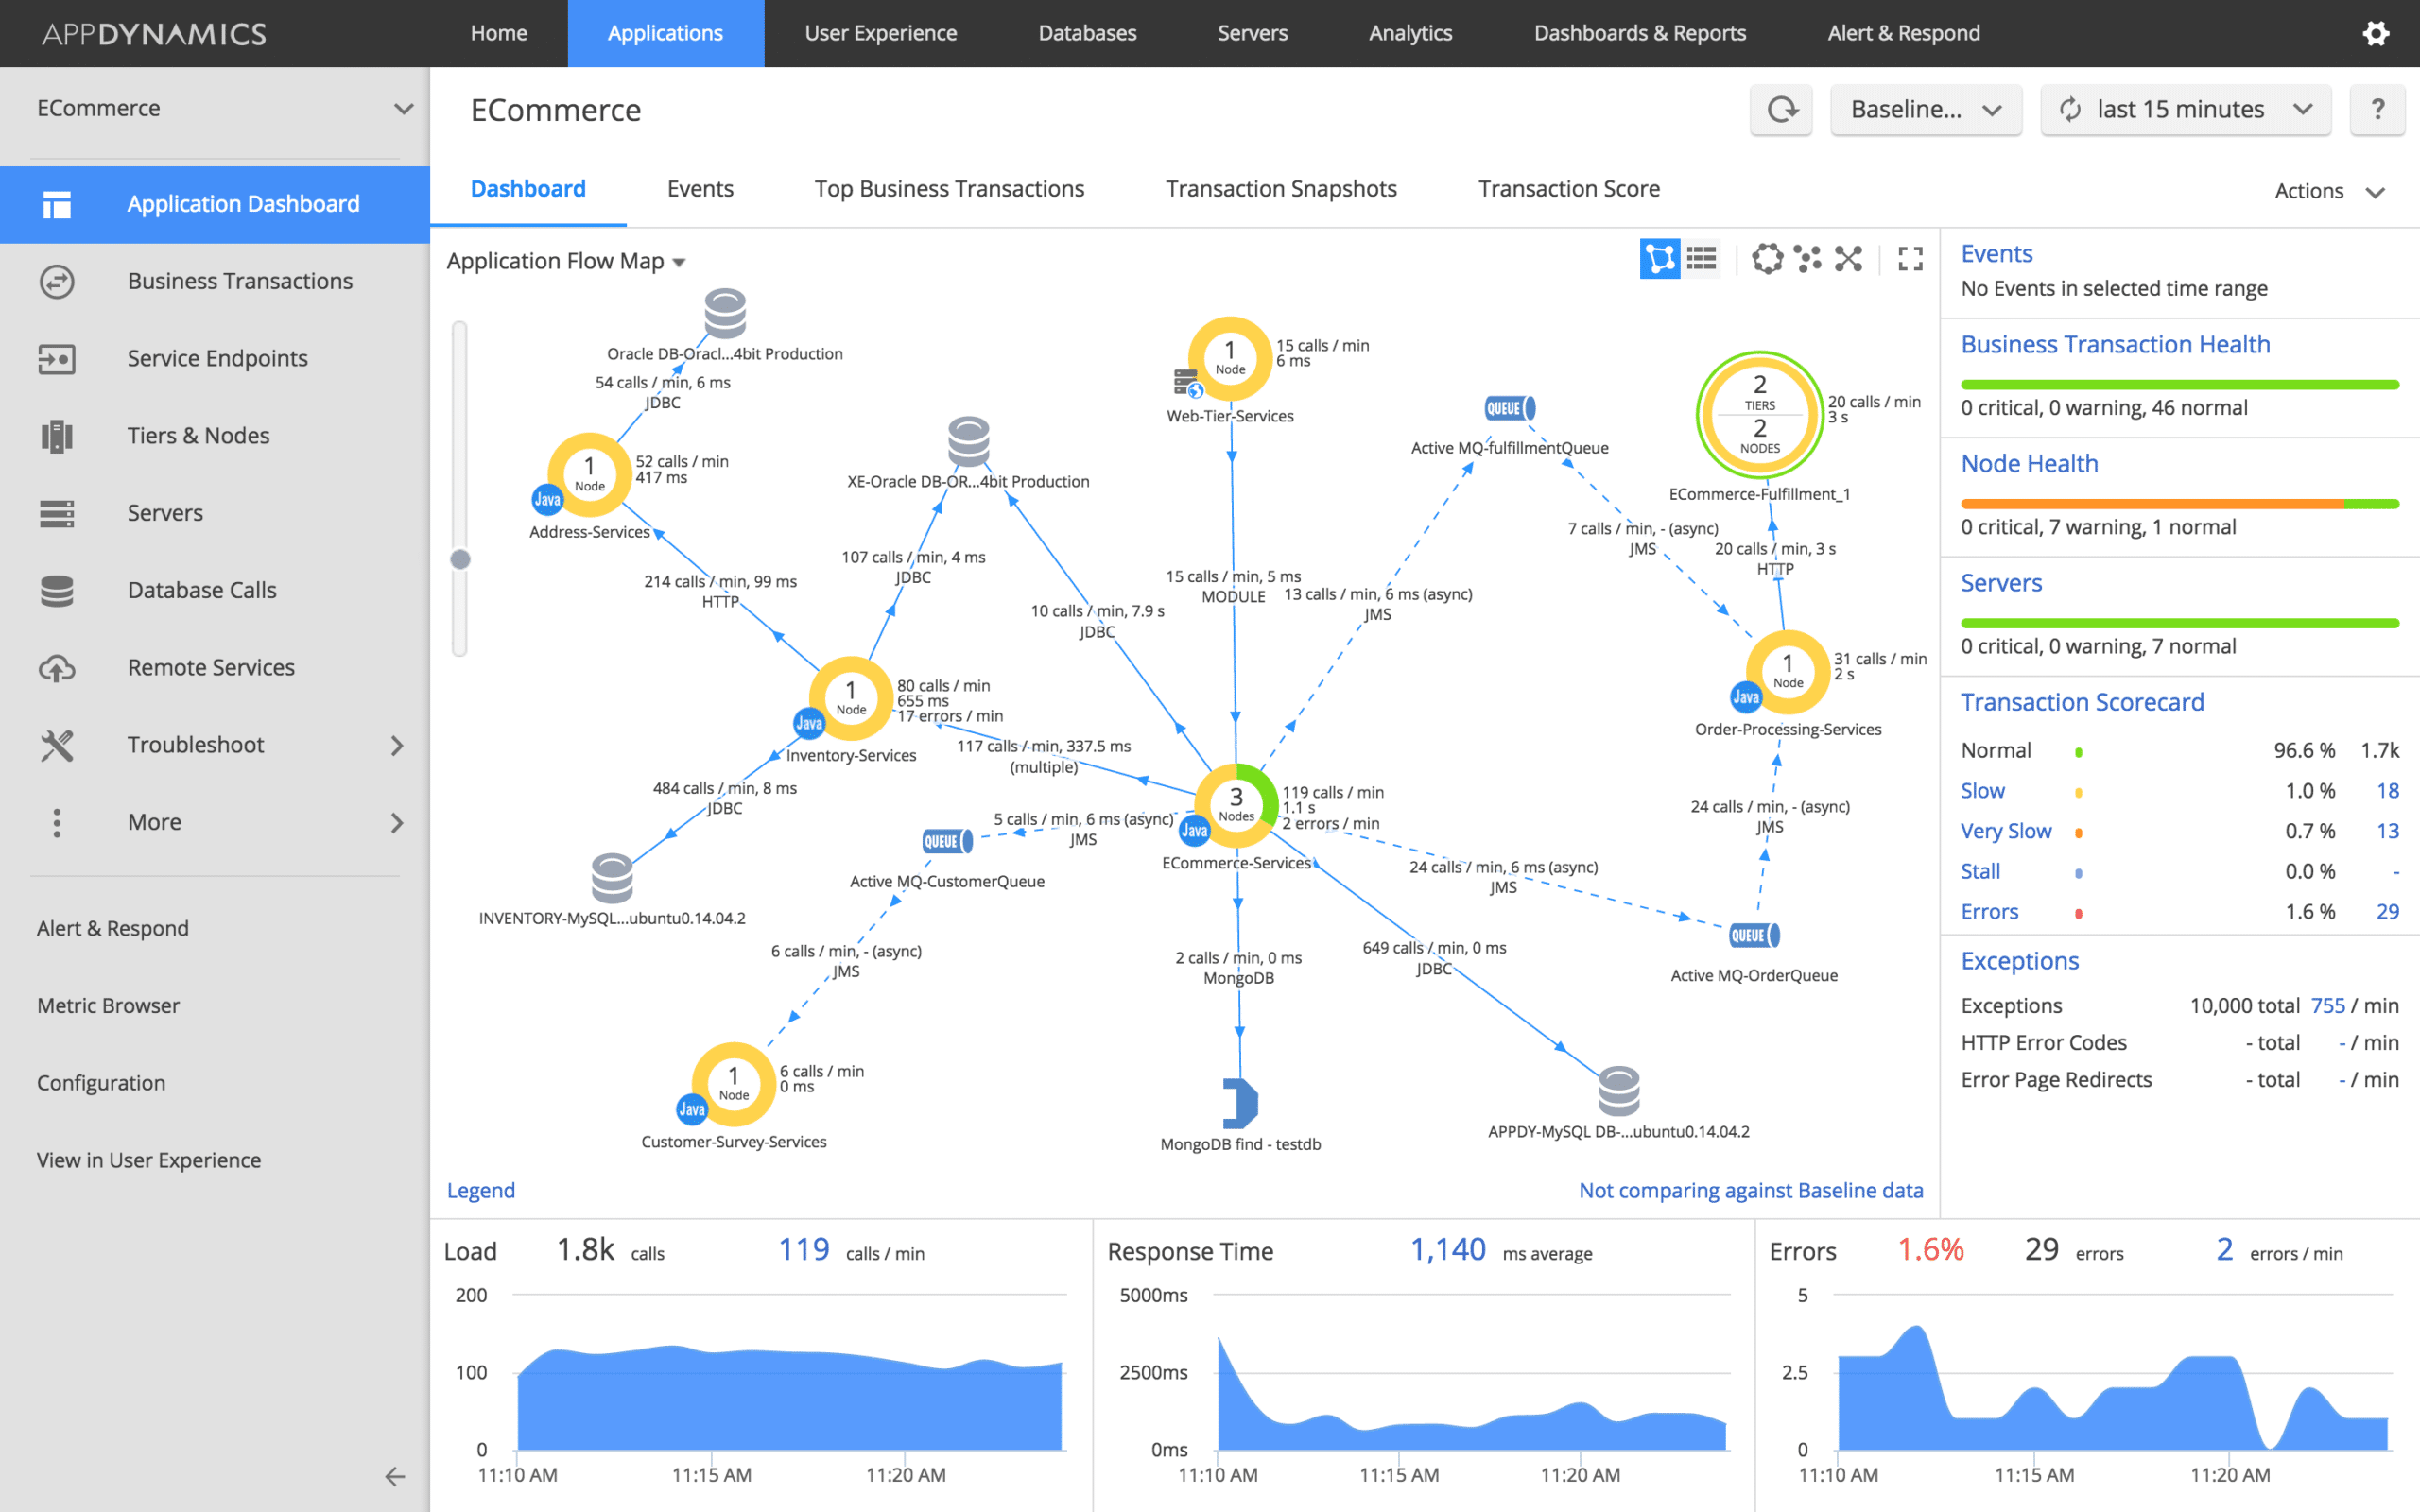
AppDynamics is an artificial intelligence (AI)-powered application performance management (APM) platform that offers enterprises complete visibility into the performance of their IT infrastructure. AppDynamics can turn IT performance into profit by offering insights and visibility over every component, from servers to cloud-native environments, by unifying full-stack performance monitoring.
Key features:
- Monitors the JBoss server’s execution and accessibility.
- Sends alerts regarding the performance of JBoss and other hosted applications.
- Identifies and resolves JBoss server memory leaks.
- Troubleshoots and resolves application performance issues.
- Presents a thorough report comparing JBoss metrics over time.
- Rapidly discovers business transactions that differ from JBoss and JVM entry points.
- Collects and reports all runtime exceptions for an in-depth examination.
- Automatically tracks memory leaks within the JVM environment.
AppDynamics can manage, monitor, and evaluate the performance of enterprise business applications through dynamic IT monitoring, application mapping, automatic problem identification, root-cause analysis, and real-time performance information. With auto-discovery functionality.
AppDynamics automates the discovery of business transactions from normal entry points in the JBoss application server and its JVM, while its engine leverages machine learning to detect anomalies in these operations.
This, in conjunction with AppDynamics’ extensive diagnostic capabilities, enables the accurate identification of fundamental issues, hence assisting administrators in effectively troubleshooting, resolving, and diagnosing possible issues. AppDynamics warns administrators of performance issues before they cause damage to the JBoss application server or application availability via its dynamic SLA baseline and its additional proactive alerting capability.
This enables administrators to prevent a possible drop in end-user service levels caused by poor performance. AppDynamics gives further visibility into stack traces, such as user request failure, timeout, and business transactions, by collecting and reporting each application’s runtime exceptions.
The primary advantages of AppDynamics are its capacity to deliver in-depth insights into your operations and the visibility it provides to project stakeholders. Here are further details:
AppDynamics provides real-time visibility into performance, user experience, goals, and business outcomes. In addition, businesses will undoubtedly value AppDynamics’ revolutionary Unified Monitoring strategy.
AppDynamics combines six monitoring programs into a single, powerful solution, allowing you total visibility and multichannel user experience management. In addition, it includes a support system, evaluation, and customized alerting function. All of them make it simple to pinpoint the exact cause of any performance issue.
The unified Monitoring also enables more precise and rapid previews. The end-to-end view of real-time application performance provided by the platform enables organizations to detect customer-impacting issues rapidly. In turn, this enables businesses to act swiftly and standardize problem resolution. It also promotes communication between Dev and Ops so that application issues can be isolated, resolved, and automated even during production.
The unified analytics capabilities of AppDynamics also ensure that businesses receive an abundance of valuable data. As a result of having access to dependable data and insights regarding application performance, user data, and business outcomes, businesses will be able to make more informed decisions. The user experience can also be enhanced, and developers can increase engagement and conversion throughout the whole user journey, whether on a website or a native mobile application.
6. eG Enterprise
eG Enterprise is a comprehensive IT infrastructure performance monitor with auto-diagnostic capabilities that delivers a single-pane view of the full JBoss architecture. It provides comprehensive visibility into the JBoss application server and the performance of all Java applications via an intuitive console.
Key features:
- Monitors the number of incoming requests by each connector, the available connections in the database connection pool, the metric of each EJB, and the thread pool size.
- Isolates business transactions impacted by JBoss’s subpar performance.
- Automatically correlates server-side problems, resource shortages, and hardware malfunctions.
- Facilitates the identification of Java code-level bugs.
- Isolates high-CPU, waiting, and root blocker threads for enhanced code optimization.
- Provides visibility into the functionality of all Java apps
- Identifies and addresses application sluggishness before it impacts end users.
- Serves as a single monitor for all Java components.
- Enhances the availability and efficiency of Java applications and servers.
eG Enterprise employs purpose-built monitoring models to monitor many aspects of the JBoss application server to maximize customer happiness and uptime. These include application code, database connections, sluggish queries, JVM, web, and EJB containers, as well as requests to external service providers.
Its proactive system of notifications allows administrators to identify and rectify issues before they impact application or system availability. eG Enterprise additionally enables comprehensive diagnostics for all JBoss performance aspects and components. These include Java transactions, DataSource connection pool connections, the number of incoming requests for each connector, JMS message queues, EJB thread pool size, JPA, and JSP.
eG Enterprise provides further information by isolating business transactions impacted by the poor performance of the JBoss application server and by identifying memory leaks and out-of-memory issues in the JVM. The tracking of each servlet’s execution time and the measuring of the execution, construction and invocation, and removal metrics for each EJB, in conjunction with the previously described elements, substantially enhances debugging.
7. Dynatrace

Dynatrace offers comprehensive monitoring for JBoss application servers, with its artificial intelligence learning the full JBoss architecture in minutes and offering visibility from browsers to individual database statements.
Key features:
- Automatic detection begins immediately after deployment, eliminating the need for manual settings.
- Dynatrace monitors and interprets end-to-end application transactions,
- It allows the observation of the execution of each service and service-request type.
- It also gives administrators a perspective from a service or service-request type if service flow is used.
This enables Dynatrace to recognize dependencies inside the JBoss environment and investigate availability and performance issues throughout the entire JBoss application server. During the monitoring process, Dynatrace analyzes the database operations of all JBoss-based apps, in addition to tracking JVM metrics and custom JMX metrics, among others.
Dynatrace conceptualizes the progression and impact of errors, performance, or application issues on the user experience through root cause analysis. This information supports administrators in identifying problematic regions that may negatively impact users, resulting in revenue loss or a mediocre reputation. Dynatrace supports all prevalent Java frameworks, and its metric monitoring features extend to include process-specific network metrics, garbage collection metrics, database statements, requests, and suspension rates.
Final thoughts
In conclusion, JBoss is a popular server used to execute Java applications. Since many of your mission-critical apps may run on this server, you must regularly monitor its performance and uptime. Not only do the aforementioned tools monitor the JBoss server, but also the entire Java environment and the applications that operate within it.
Our top pick from the list of best JBoss monitoring tools, SolarWinds Server & Application Monitor’s monitoring transactions tool properly measures database performance. It accomplishes this by tracing transaction flow and displaying method-level information, which enables the rapid detection of possible bottleneck concerns.