
Systems administrators and power users with even a few years of experience will have heard of Grafana. But, don’t worry if you haven’t – in this post, we will learn about how this powerful and versatile tool can help you and how you can leverage it to make sure you are on top of your sysad game.

What is Grafana?
Grafana is an open-source, multi-platform, analytics, and interactive data input visualization web application. Its main purpose is to create charts, graphs, and alerts for the web when connected to supported IT asset performance and health data sources. It allows users to query, visualize, receive alerts on, and understand this data – regardless of where it is stored.
It is a tool that is best suited for data analytics, extracting and rendering large amounts of data, and using it all to monitor digital resources, be they soft- or hardware, and present it all on customizable dashboards that have a futuristic appearance.

Real-life applications of Grafana
The fact that Grafana is a widely-used and popular solution is a testimony to its effectiveness. Major companies like Bloomberg, JP Morgan Chase, eBay, PayPal, and Sony use it to keep track of their systems.
In real life, these companies use it to monitor everything from weather service data processors and ISP latency, to tracking online students’ progress and wearable health device performances. It can be easily adapted into any technology platform to make the target data source a more efficient tool.
It is used to monitor Linux, MySQL, Redis, Go processes, and more, for example, once the agent has been installed, and like magic, it shows preconfigured dashboards and alerts right out of the box.
Clients that are already using Prometheus (which we will have a look at later, too), Graphite, or Loki, can start shipping data to Grafana Cloud or run the agent on Kubernetes.

In short, Grafana monitors almost anything.
Set up and installation of Grafana
Let’s look at the steps involved in adopting Grafana into your network:
Requirements:
To begin with, users can use Grafana Cloud if they choose to forgo installing, maintaining, and scaling their instances.
They can start with a Free Account which includes free-forever access to 10k metrics, 50 GB logs, 50 GB traces, and more.
For those that choose the alternative, Grafana can be installed on many different operating systems, including Windows, macOS, Debian, and Ubuntu, as well as RPM-based Linux flavors like CentOS, Fedora, OpenSuse, and Red Hat.
Although Grafana is installable on other operating systems, the company neither recommends nor supports it.
One endearing fact about Grafana is the fact that it doesn’t require too many resources and is very lightweight when it comes to the use of memory and CPU. With that being said, the minimum recommended memory is 255 MB and a minimum of 1 CPU, although additional processing power might be required for additional features like server-side rendering of images, alerting, and data source proxy.
Grafana also uses a database to store its configuration data, and the exact requirements depend on the size of the installation and the features used. By default, it installs with and uses SQLite, which is an embedded database stored in the installation location while MySQL 5.7+ and PostgreSQL 10+ are also supported.
When it comes to browsers, Grafana works well with the latest versions of Chrome/Chromium, Firefox, Safari, Microsoft Edge, and Internet Explorer 11.
Installation – cloud:
The process of implementing Grafana is straightforward:
- Sign in to Grafana. In a local installation, you can also sign in for the first time using this link:
http://localhost:3000/
- By default, Grafana listens to port number 3000 – unless you have configured it otherwise.
- Once at the sign-in page, you can enter “admin” – for both the username and password – and click “Sign In”. Once done, you should see a prompt asking you to change the password.
- Click “OK” at the prompt and change your password.
And that’s it – you’re all set to go.
Creating your first dashboard
Grafana, by default, comes with several panels that make it easy to construct the right queries and customize the visualization so that users can immediately create the perfect dashboard in the shortest amount of time. Any panel can interact with the data from any configured Grafana data source – if it is connected, it can be presented.
To create your first dashboard:

- Click the “New” button on the right of your screen – or you can also create it from the menu on the left.

- On the dashboard, click “Add a new panel”.

- Next, go to the “New dashboard/Edit Panel” view, and then the “Query” tab.
- You can configure your query by selecting “– Grafana –“ from the data source drop-down menu.
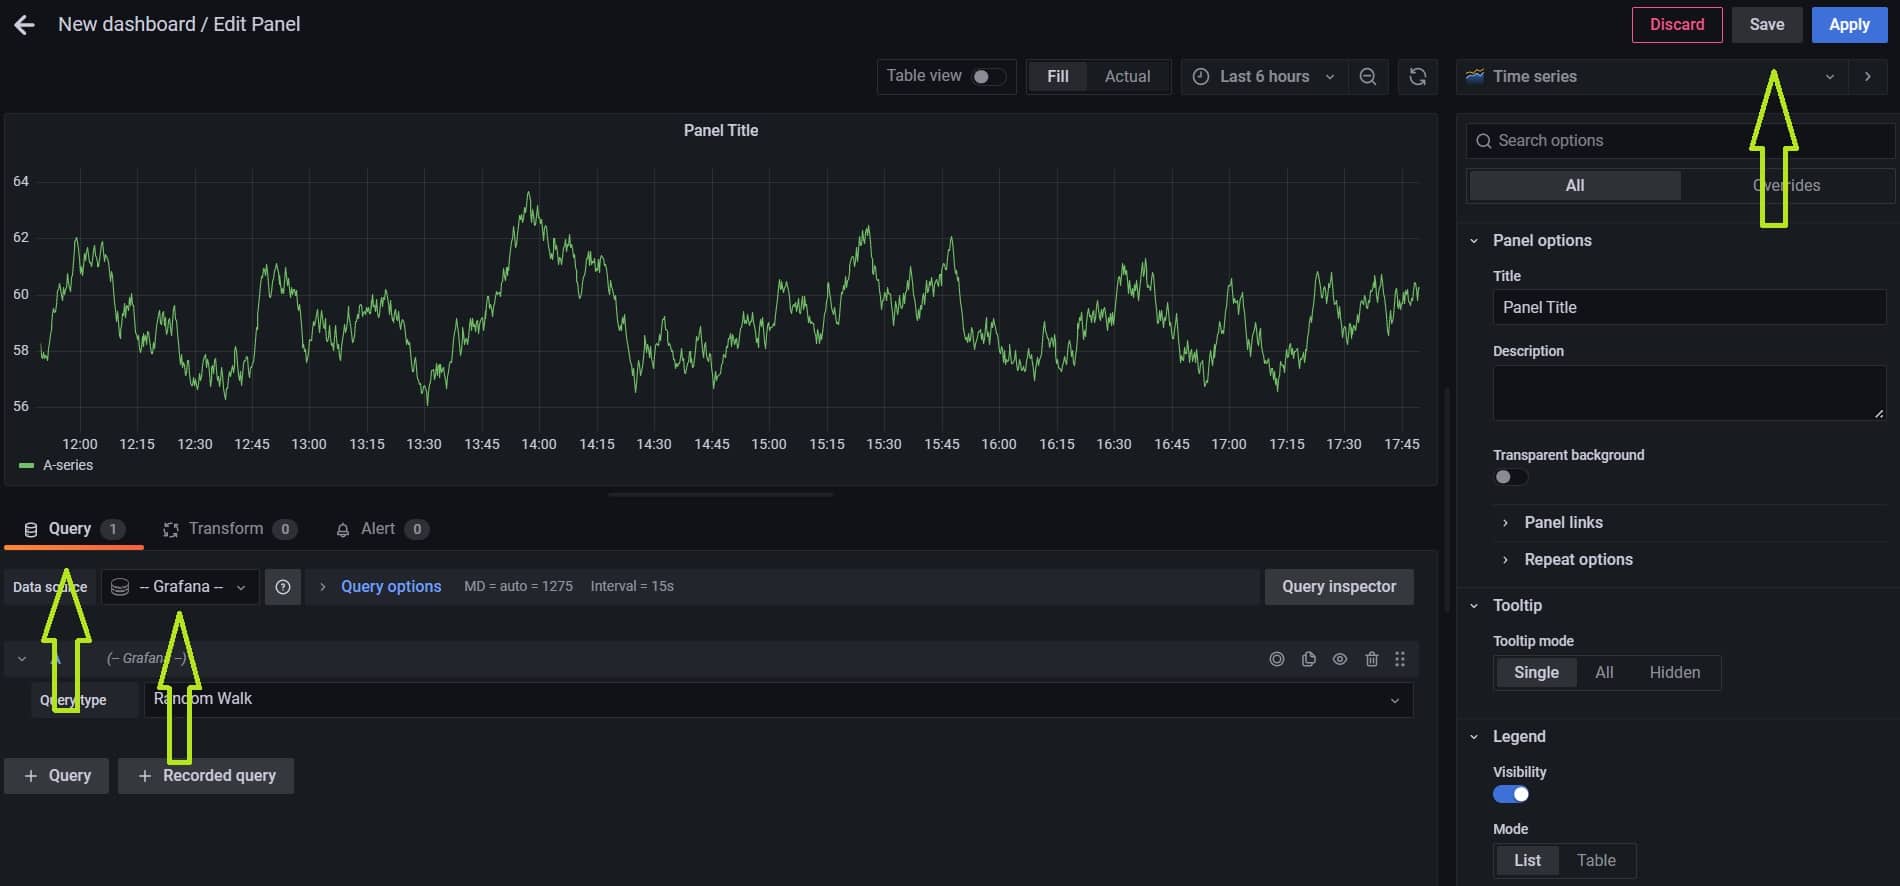
Edit the panel – Query, Data Source, and Save
- This generates the Random Walk dashboard.
- To save your dashboard, you need to click the “Save” icon in the top right corner.
- Give your dashboard a descriptive name, and click “Save” again.

That’s it! You have just created your first dashboard.
Dynamic Grafana dashboards
One thing we need to remember is that Grafana dashboard snapshots are static. This means queries and expressions can’t be re-executed from snapshots and that if any variables are updated in the queries or expressions, they will not be reflected in the dashboard.
A variable is a placeholder for a value and is used to create interactive and dynamic dashboards. Instead of hard-coding entries – like application, server, or sensor names – they can be entered during runtime as user selections. These variables are stored in drop-down menus and when a value is selected the panels’ metric queries will change to reflect this new input.
Another advantage is that administrators can allow their users to view various dashboards without granting them full editing permissions they would otherwise require to manipulate their dashboards.
In your new dashboard, you can see the variables listed in the drop-down menus at the top of your screens. You can play around with the visualizations without inputting any new value and see the changes in the main graph.
To see your variable settings, go to the ”Dashboard settings” menu in the top right-hand corner and choose “Variables”. When you click a variable in the resulting drop-down list, you can see the results reflected in your graph.
Some points to ponder:
- Variables can be applied as values for titles, descriptions, text panels, and queries.
- Queries with text that starts with the dollar ($) symbol are templates, and not all panels will have template queries.
- Variable drop-down lists are displayed in the order they are listed in the variable list in the dashboard settings. Therefore, it is best to put variables that change often at the top, so they are shown first.
Using your new Grafana installation
Let’s now move on to other features of Grafana and see how they can help with the monitoring process.
Alerts in Grafana
Grafana Alerting, a critical feature, helps us become aware of issues in our systems – moments after they have occurred.
We can create, manage, and take action on the alerts using a single consolidated view that helps cut issue resolution times.
Grafana alerting breakdown
Let’s have a breakdown of each step involved in alerting:
- Alert rules Τhese are set evaluation criteria that determine when an alert will be triggered. The triggering milestones consist of one or more queries and expressions, a condition, the frequency of evaluation, and optionally, the duration over which the condition is met – or not.
- Grafana alerts support multi-dimensional alerting, which means each alert rule can create multiple alert instances. This is exceptionally useful when observing multiple series in a single expression.
- Labels Αre used to match alert rules and their instances to notification policies and silences. They can also be used to group alerts by severity or the devices they are monitoring.
- Notification policies Τhese rules set where, when, and how alerts are routed. They each have a contact point assigned to them that consists of one or more notification targets. Also, each notification policy includes a set of label matches to show which alerts they are responsible for.
- Contact points Αre the definitions of how stakeholders are notified when an alert is triggered.
Reports and reporting on Grafana
Reporting allows users to generate PDF outputs from any dashboard and have Grafana email them to stakeholders on a schedule. This means SMTP needs to be configured for reports to be sent.

By default, only administrators can create reports. However, they can delegate the authority to other users using Grafana’s Role-based access control.
To begin, click the “Reporting” icon, and the “Reports” menu in the navigation panel on the left side of the dashboard. This will open the “Create a new report” panel.
Creating a new report on Grafana
In the “Reports” you can create, view, and update all of your reports. When you create a new report, and after selecting a reporting dashboard, you will be asked for information like
- Source dashboard Τhis is where you choose the dashboard from which you want to generate your report.
- Time range Υou can optionally use a custom time range for the report.

You can use the “Add another dashboard” button to add more than one dashboard to the report.
Once the report has been generated, you can then Format the report by clicking on the button at the bottom of the screen. Here’s how:

You can now choose the format options in which you want the report to be created and includes attaching the report as a PDF file, embedding the dashboard as an image, or attaching a CSV file of table data.
If you select the PDF format option, you can select an orientation for the report to be Portrait or Landscape. You can also select a layout for the generated report to be Simple or Grid. The simple layout renders each panel as a full-width across the PDF. Choosing the “Grid” layout renders the report with the same panel arrangement, and width, as the dashboard.
Click “Preview PDF” to view your PDF report with the options you selected.

To schedule the report, enter scheduling information depending on how often you want the report to be generated. Next, you need to name your report, enter the recipient’s email addresses, the reply address they can reply to, and the message that is encompassed in the email’s body.
You can also include a direct link to the dashboard if the users need to see it.
Finally, you can send a test message to see how the report will look and if it will reach its intended recipients.
Once you are satisfied, save your new report.
Two things to note:
- Along with your PDF report, you can attach a CSV file to the report email for each panel on the selected dashboards. By default, CSV files that are larger than 10 MB are not sent to avoid email servers from rejecting the email. Administrators can change this limit in the reporting configuration. Also, this feature is only available in Grafana Enterprise 8+ along with the Grafana image renderer plugin v3.0+, and Grafana Cloud Pro and Advanced.
- Users can generate and save PDF files of their dashboards, but this function is only available in Grafana Enterprise.
Test Grafana on their play server
A feature that endears Grafana to users, especially new ones, is that they let you play around and get a feel of their software by allowing them to “play” with their demo server on this website.
Try it out for yourself, and you will soon get a feel of how good this tool is when it comes to data presentation.
Who is Grafana for?
At this point, you are probably wondering if, indeed, this is the log monitoring tool for your network. Well, to help you make that decision, let us have a look at who exactly Grafana is for.
Companies that use Grafana utilize it to monitor their infrastructure and log analytics, with the intent to optimize their operational efficiency. The tool is used in some of the largest leading companies. Some examples are:
Hiveeyes Project
The Hiveeyes Project is an open-source project that is developing a flexible beehive monitoring infrastructure platform. They have a public Grafana that visualizes the weather in Germany.

Wikimedia
Wikipedia is perhaps one of the most widely recognized websites on the Internet today. It is a site where people come seeking knowledge and information from people who have contributed their information on almost any topic under the sun. The open-source nature of this knowledge repository is further enhanced by the site’s exposing of their Wikimedia Metrics via Grafana dashboards. The dashboards show data from their global data centers regarding HTTP 5XX error responses, successful Wiki edits, and AP request rates, to name a few dashboards that have been made public.

CERN
The CERN or the European Organization for Nuclear Research is home to the largest physics laboratory in the world. They have shared their experiment details using Grafana. Anyone that can make sense of their complicated information, is welcome to have a glimpse.

What we can understand from these examples is that Grafana is a tool that can be used to gauge, monitor, and present huge amounts of data that is in rapid motion in a way that is easy to comprehend. And this also means, anyone, including you, can use it to monitor their digital assets, regardless of the size.
Grafana industry best practices
Here are some best practices you can adopt when installing your instance of Grafana:
Dashboard
- When creating a new dashboard, make sure to give it a meaningful name so everyone knows what is included. Make it a habit to reuse dashboards and enforce consistency by using templates and variables. If you are creating a dashboard to test or experiment, you can use “DEMO” or “TEST” to indicate your intentions and avoid confusion. Better yet, remember to remove these temporary experimental dashboards when you are done with them.
- When copying a dashboard, make sure you rename it. Also, do not copy dashboard tags. You need to remember that tags are key metadata for dashboards and are used in searches. Duplicate or erroneous tags can result in false matches.
- In cases where more than one administrator department is sharing the reporting dashboard, it would make sense to add names or departments to let users know whom they were created by or who the intended audience is.
- Make sure you reduce resource hogging by reducing the dashboard refresh rate. It would make no sense to have a second-by-second refresh rate, for example, if the data is only updated every other hour.
- Care needs to be taken when stacking data graphs it is recommended to turn them off as visualizations can mislead users trying to make sense of the data that is being presented.
- Try to answer the question at hand by limiting the metrics that are included in your graphs. Wherever possible, use a single metric and try not to exceed four metrics – any more and it would start to become confusing to users trying to make sense of the correlations.
Alerts
- Make sure your alerts are triggered by the right metrics and gauge the correct thresholds or milestones. The alternative would be erroneous alerts that return false positive flags being raised – and this could lead to time and resources wasted chasing ghosts.
- Adopt a policy of creating alerts with the minimum number of conditions to make it easier to understand what happened and thus quickly resolve the issue.
- All new alerts need to be tested – preferably in a sandbox environment – and see that they perform as they should before being deployed in a production environment.
- Alerting can be automated using third-party tools like Ansible or Puppet to configure alerts based on conditions. It takes the pressure off administrators while also helping maintain configuration accuracies.
- Alerts need to be monitored to make sure that they are working as expected. Steps that can be taken include setting up notifications that indicate when an alert fails or is delayed.
- All possible notification channels should be used to ensure the right stakeholders are made aware of an issue. Those that need to be alerted immediately can be contacted via SMS, while other lesser-involved users can be alerted via email or Slack.
- This also means it is important to include all stakeholders in the company, even if it just means that they are being kept in the loop about the health of the network. Other considerations include the times the alerts are sent out and whether they are on duty at the time.
Grafana Integrations
We will now have a look at some of the popular applications that can be used with Grafana. These data storage applications, on their own, are some of the most popular and resilient solutions on the market. Combining them with Grafana makes it possible to visualize the data they hold.
MS SQL Server
Microsoft SQL Server (MSSQL) is a popular relational database management system that is widely used in development and production environments.
Grafana comes with a built-in MSSQL data source plugin that allows users to query and visualize data from any SQL Server (2005 or newer) or Microsoft Azure SQL Database.
Details on how to integrate Microsoft SQL Server can be found here.
Prometheus
Grafana also provides out-of-the-box support for Prometheus, an open-source monitoring system that offers a multi-dimensional data model of time series data that is identified by metric name and key/value pairs. It uses PromQL, a native flexible query language, to leverage this dimensionality and the data it stores can be pulled using any browser.
Details on how to integrate Prometheus can be found here.
InfluxDB
InfluxDB is another popular open-source time series database that has been optimized for fast, high-availability storage and retrieval of data in fields such as operations monitoring, application metrics, IoT sensor data, and real-time analytics.
InfluxDB Cloud is one of the most powerful time series database-as-a-service (DBaaS) platforms out there. Users can easily build real-time applications for analytics, IoT, and cloud-native services in less time with less code using InfluxDB which is available on Amazon AWS, Microsoft Azure, and Google Cloud.
Adding Grafana into the mix helps bring the data behind these applications to life.
Details on how to integrate InfluxDB can be found here.
These are just a few of many possible Grafana plugins and integrations, but we can see that it is a flexible solution that works with almost any data source.
On getting started with Grafana
We hope this post helps you learn about Grafana and how this amazing tool can help you master the monitoring of the digital assets that are on your network.
We would like to hear back from you – leave us a comment below.


