The best data center monitoring tools can not only help a business extract the optimal ROI from its digital technology investments but also help its administrators fine-tune it for peak performance. In this article, we will have a look at some of the best data center monitoring tools and how they can help an administrator take absolute control of their software, hardware, and connectivity devices.
Here’s our list of the best data center monitoring tools:
- Site24x7 (FREE TRIAL) This cloud platform provides multiple system monitoring services that offer a suitable combination of monitoring tools for data centers. Start a 30-day free trial.
- ManageEngine OpManager Plus (FREE TRIAL) Powerful and affordable monitor with a special focus on networking devices; it works well with all major brands and works well in collaborative environments. Start a 30-day free trial.
- ManageEngine OpManager Nexus (FREE TRIAL) This ITOps platform can track IT and physical infrastructure across multiple environments. Download a 30-day free trial.
- Paessler PRTG Network Monitor (FREE TRIAL) Another great data center monitoring tool that uses agents for minimal footprints but can collect metrics and events from digital assets like routers, servers, and much more. Start a 30-day free trial.
- Datadog Data Center Monitoring Dashboards SaaS-based server monitoring tool that is ideal for both administrators and IT DevOps teams that offers highly customizable web-based dashboards for better insights.
- SolarWinds Data Center Management Solutions Full control of your assets in real-time, it can be further enhanced by integrating it with other tools from SolarWinds.
- Zabbix An open-source data center monitoring tool that can scale up to cover a large number of assets; it works on all major operating systems and because it is agentless, has a tiny digital footprint.
- Device42 Free data center monitoring tool that helps with overseeing hardware, and can be used to visualize the whole architecture using digital models all of which can be controlled from an intuitive, web-based dashboard.
What is a data center?
The definition of a data center is:
A data center is a digital architecture that is used to share mission-critical applications, services, and data with the help of complex networking, compute, and storage devices. In a business setup, a data center also provides access to its users – both internal and external – in a secure, efficient way.
It is the job of the administrator to ensure that all storage, processing, and distribution of the data is done in a way that doesn’t negatively affect the business’ performance or the data consumer’s user experience (UX).
What is data center monitoring?
Data center monitoring, also known as data center management, consists of three major tasks:
- Using manual and automated tools and techniques to ensure the best operating health of a data center.
- Monitoring, managing, and operating a data center to be in compliance with operating and organizational requirements.
- Finally, ensuring mission-critical functions and services of a data center are delivered without interruptions, breaches, or abnormalities.
In general, data center monitoring is a process that provides insights and visibility into the health and status of a data center by tracking specific metrics in real-time and sending alerts or notifications when readings exceed or fall below set thresholds making it easier to quickly resolve the issues that are causing them.
What do data center monitoring tools do?
A data center monitoring tool performs the following tasks:
- Monitors switches and routers for connectivity in a data center
- Monitors critical server metrics in a data center
- Provides end-to-end visibility across all data center components including computers, storage, network, and software
- Ensures continuous power availability and optimal consumption
- Tracks data center environments for safe temperature, heating, and ventilation systems performance
- Keeps an eye on the physical data center as well as the software solutions’ security to prevent unauthorized access
The whole point of using a data center monitoring tool is to ensure nothing comes between the optimal performance of the consumption of the data, functions, and services that are being provided.
The Best Data Center Monitoring Tools
1. Site24x7 (FREE TRIAL)

Site24x7 is a cloud platform of system monitoring tools that provide the ideal combination of services for data centers. This package is available in editions for managed service providers (MSPs) and for IT departments for in-house use. You can provide centralized services and monitor all of the services of the data center and also monitor the delivery of those services to remote sites.
Key Features:
- Comprehensive Data Center Monitoring: Provides real-time visibility into servers, network devices, applications, and environmental sensors, ensuring optimal performance and uptime.
- Automated Discovery and Mapping: Automatically detects and maps data center resources, simplifying the management of complex infrastructures.
- Customizable Dashboards and Reporting: Offers flexible dashboards and detailed reports, allowing for tailored monitoring views and in-depth analysis of performance metrics.
- Integrated Alerting System: Delivers instant notifications through various channels, including email, SMS, and third-party integrations, enabling prompt response to potential issues.
- Scalability: Supports monitoring for data centers of all sizes, adapting to the evolving needs of growing organizations.
Why do we recommend it?
Site24x7 stands out as a comprehensive cloud platform for system monitoring, offering tailored editions for both managed service providers (MSPs) and in-house IT departments. In our extensive testing, Site24x7 demonstrated excellence in tracking and managing data center assets, focusing on servers, storage servers, printers, load balancers, and WAN optimizers. The platform’s ability to monitor network performance, internet connections, and VPN services, coupled with troubleshooting tools like Ping, provides a holistic view of data center operations. The inclusion of Real User Monitoring and application performance monitoring, featuring code profiling and distributed tracing, further solidifies Site24x7 as a top choice for organizations seeking efficient and versatile data center monitoring.
The main assets in a data center are its servers and the Site24x7 system includes server monitoring that will track processing activities. It monitors resource capacity island utilization and will raise an alert if any alert starts to reach its full capacity. Alerts can be forwarded to technicians by email or SMS. this is a great cost saver because it means that IT staff do not need to sit and watch the monitoring system console.
The system can track the activity and capacity of storage servers and other hardware, such as printers, load balancers, and WAN optimizers. You can watch the performance of networks and internet connections, including VPN services. The package also includes troubleshooting tools, such as Ping.
The Site24x7 platform includes a website monitoring system, so if your data center is a web hosting service, you can keep track of performance through Real User Monitoring and application performance monitoring. The APM includes code profiling and distributed tracing so you can identify which line of code or which function in your web application is causing problems.
The package of monitoring tools can be expanded by activating an integration. This term refers to a plug-in and there is a library of them to add on the ability to monitor a specific technology or product. Examples of these are database management system monitoring lug-ins for specific types of database.
Who is it recommended for?
Site24x7 is recommended for both managed service providers (MSPs) and in-house IT departments responsible for data center management. Its scalable and centralized monitoring services make it suitable for organizations of various sizes, ensuring that servers, network components, and applications are operating optimally. The platform’s versatility is particularly beneficial for web hosting services, offering Real User Monitoring and application performance insights. Site24x7 is an ideal choice for those seeking a comprehensive yet user-friendly solution to monitor and optimize data center performance, with the flexibility to integrate additional monitoring capabilities through a variety of plug-ins.
Pros:
- User-Friendly Interface: Features an intuitive design that simplifies setup and daily operations, reducing the learning curve for new users.
- Comprehensive Monitoring Capabilities: Enables monitoring of a wide range of IT infrastructure components, providing a unified view of data center health.
- Proactive Alerting: Facilitates early detection of potential issues, allowing for timely interventions and minimizing downtime.
- Customizable Dashboards: Allows users to tailor monitoring views to specific needs, enhancing the relevance and clarity of displayed information.
- Scalability: Accommodates the monitoring needs of both small and large data centers, supporting organizational growth.
Cons:
- Complex Feature Set: The extensive range of features may be overwhelming for some users, requiring time to fully explore and utilize effectively.
The modules on the Site24x7 platform are marketed in packages and you can get a 30-day free trial of any of them.
2. ManageEngine OpManager Plus (FREE TRIAL)
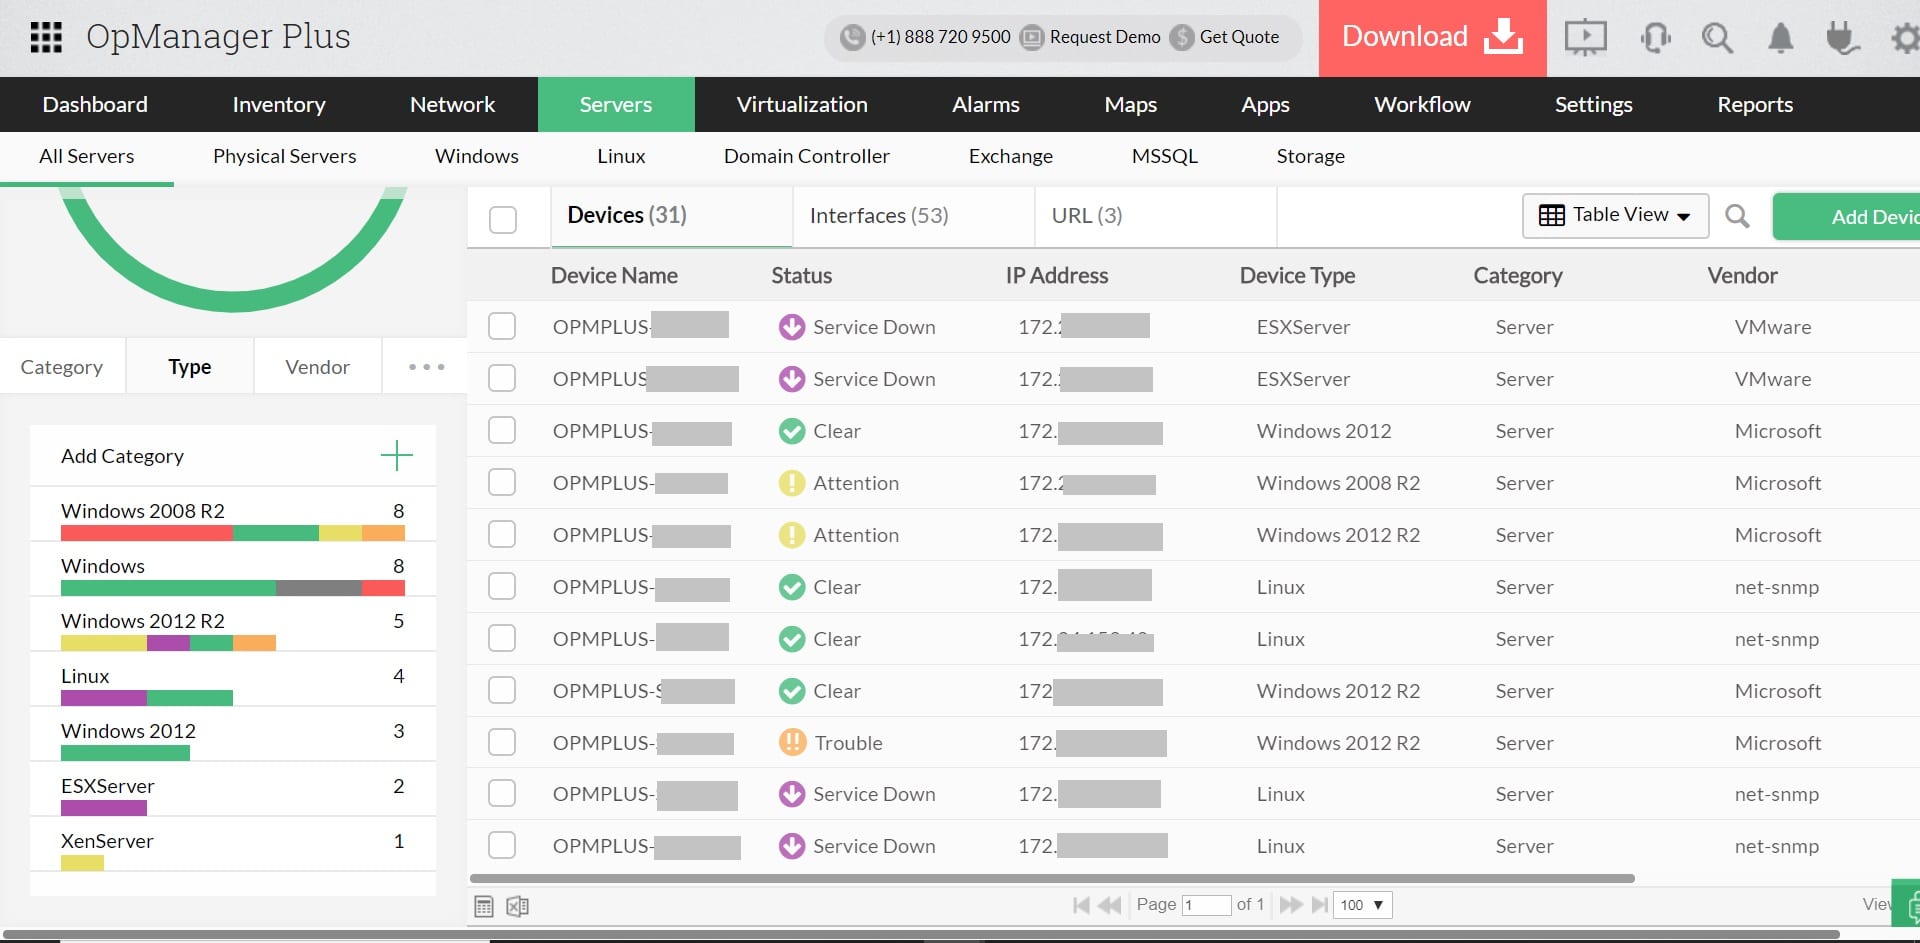
ManageEngine OpManager Plus is another tool for managing and monitoring all the different aspects – from the end users’ UX to the databases’ performance in the back – of a data center’s wellbeing; all from a central console.
Key Features:
- End-to-End Monitoring: Provides real-time monitoring of servers, applications, virtual machines, network devices, and storage systems, ensuring complete visibility into the data center’s performance.
- Automated Asset Discovery: Quickly discovers all devices in the network using pre-configured rules and templates, simplifying asset management in complex environments.
- Performance Metrics and Alerts: Tracks key performance indicators for devices and applications, sending real-time alerts when thresholds are breached, enabling swift resolution of issues.
- Customizable Reporting: Generates in-depth reports on system performance, resource usage, and uptime, providing actionable insights for optimizing infrastructure.
- Integrated Fault Management: Identifies and resolves faults across the network with root cause analysis tools, minimizing downtime and ensuring consistent operations.
Why do we recommend it?
ManageEngine OpManager Plus stands out as a robust and centralized solution for managing and monitoring diverse aspects of a data center. In our rigorous testing, OpManager demonstrated its ability to discover and associate performance monitors based on device types, providing real-time insights into both physical and virtual servers. The platform’s support for SNMP, WMI, and CLI protocols ensures comprehensive monitoring capabilities. OpManager’s over 2000 built-in monitors, covering critical metrics like packet loss, latency, and speed, enable administrators to proactively identify and address performance bottlenecks. The inclusion of WAN Link monitoring, CPU, memory, and disk utilization tracking, as well as support for various virtualization platforms, makes OpManager a versatile and comprehensive choice for organizations seeking end-to-end visibility and analytics in data center management.
Once it has discovered all the assets on a network, OpManager immediately starts to associate performance monitors based on device types. It can then be used to monitor both physical and virtual servers in a data center with the help of SNMP, WMI, and CLI protocols.
It uses critical performance metrics, which are collected in real-time, to track the performance of resources and then gauge the assets’ health at their peak levels.
With ManageEngine OpManager, administrators can get end-to-end visibility and analytics of network infrastructure including local devices, wireless networks, WAN links, and even non-computing devices like printers or access points. OpManager also provides integrated troubleshooting capabilities with planning and configuration management thrown in.
Finally, administrators can use multiple credential profiles to monitor virtual servers in a collaborative working environment.
Who is it recommended for?
ManageEngine OpManager Plus is recommended for administrators and IT teams responsible for data center management. Its broad range of features, including network performance monitoring, configuration management, and troubleshooting capabilities, makes it suitable for organizations of varying sizes and complexities. OpManager’s multi-level threshold monitoring and instant alerting system provide proactive measures against potential issues, enhancing the overall health and performance of the data center. The platform’s customizable dashboards, performance widgets, and 3D views offer a user-friendly and visually informative experience, making it an ideal choice for those seeking a comprehensive and intuitive solution for data center monitoring and management.
Pros:
- Holistic View of IT Infrastructure: Provides a unified dashboard that consolidates data from all monitored devices and applications, making it easy to track overall health.
- Pre-Built Integrations: Seamlessly integrates with other ManageEngine products for expanded capabilities, such as log analysis and IT service management.
- Automation Features: Streamlines tasks like device discovery and alerting, reducing the manual workload for IT teams.
- Multi-Vendor Support: Ensures compatibility with a wide range of network devices, storage systems, and virtual environments, making it versatile for diverse infrastructures.
- Resource Optimization Tools: Offers tools to analyze resource usage, enabling administrators to eliminate waste and improve efficiency.
Cons:
- Scalability Challenges for Large Deployments: While it supports scaling, managing a very large infrastructure can become cumbersome without optimization.
Download a 30-day FREE trial of ManageEngine OpManager.
3. ManageEngine OpManager Nexus (FREE TRIAL)
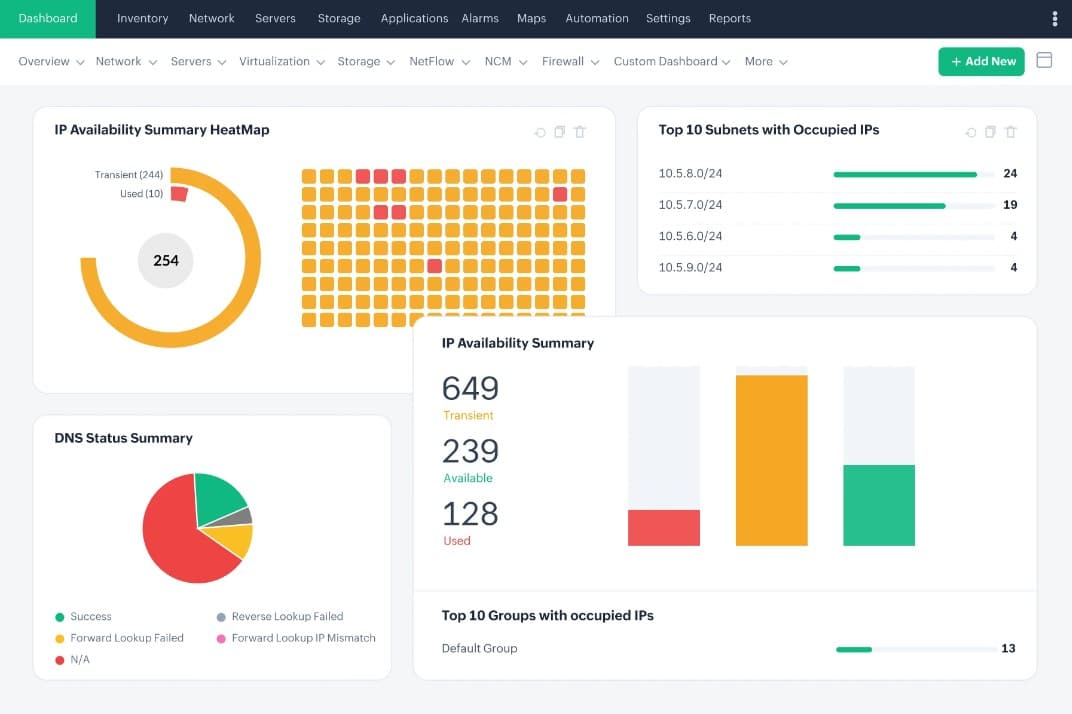
ManageEngine OpManager Nexus, formerly OpManager Plus, is a Data Center Infrastructure Management (DCIM) that can monitor, manage, and optimize every component in your data center. It works well on servers, storage devices, cooling systems, power delivery systems, and the physical floor, making it a one-stop place to know all about your data center efficiency and performance.
Key Features:
- Comprehensive Monitoring: Monitors performance across network devices with support for 200+ metrics.
- Power Usage: Manages power usage across your data center.
- Visualization: Builds 2D/3D floor views for easy understanding of the layouts.
- Reports: Generates reports to identify under- and over-utilized resources
- Security: Implements security through strategies, like firewall analysis, VPN monitoring, and user-based access controls.
Why do we recommend it?
OpManager Nexus offers real-time monitoring of your data center components, so you can detect risks early and address them. A notable aspect of this tool is its wide coverage, as it can monitor 200+ metrics in real time. Moreover, it can also track uptime through links and protocols to ensure that your data center is up and running optimally.
Besides availability, it also monitors power supply and usage to reduce power-related outages. Similarly, it uses AI-based algorithms to help forecast CPU, memory, and storage capacity.
Another useful feature is its visualization, as it can generate 2D and 3D floor views with precise device coordinates. Also, it can overlay real-time data over these floor maps for real-time visualization.
Who is it recommended for?
It is a good choice for large data centers that have thousands of servers. It is also useful for security, compliance, and operational teams that are responsible for ensuring the performance of these data centers.
Pros:
- Real-time Views: Offers real-time information about your data operations.
- Bandwidth Monitoring: Detects any anomalies in your bandwidth usage and traffic patterns to identify rogue devices.
- Storage Usage: Tracks storage across RAID, NAS, and SAN devices.
- Cost Efficiency: Improves power efficiency and reduces costs.
- Coverage: Monitors more than 200 metrics.
Cons:
- Learning Curve: Some users may face a learning curve.
The Professional edition starts at $1,233 a year for 50 devices, while the Enterprise edition starts at $19,995 per year for 1000 devices. Start a 30-day free trial.
4. Paessler PRTG Network Monitor (FREE TRIAL)
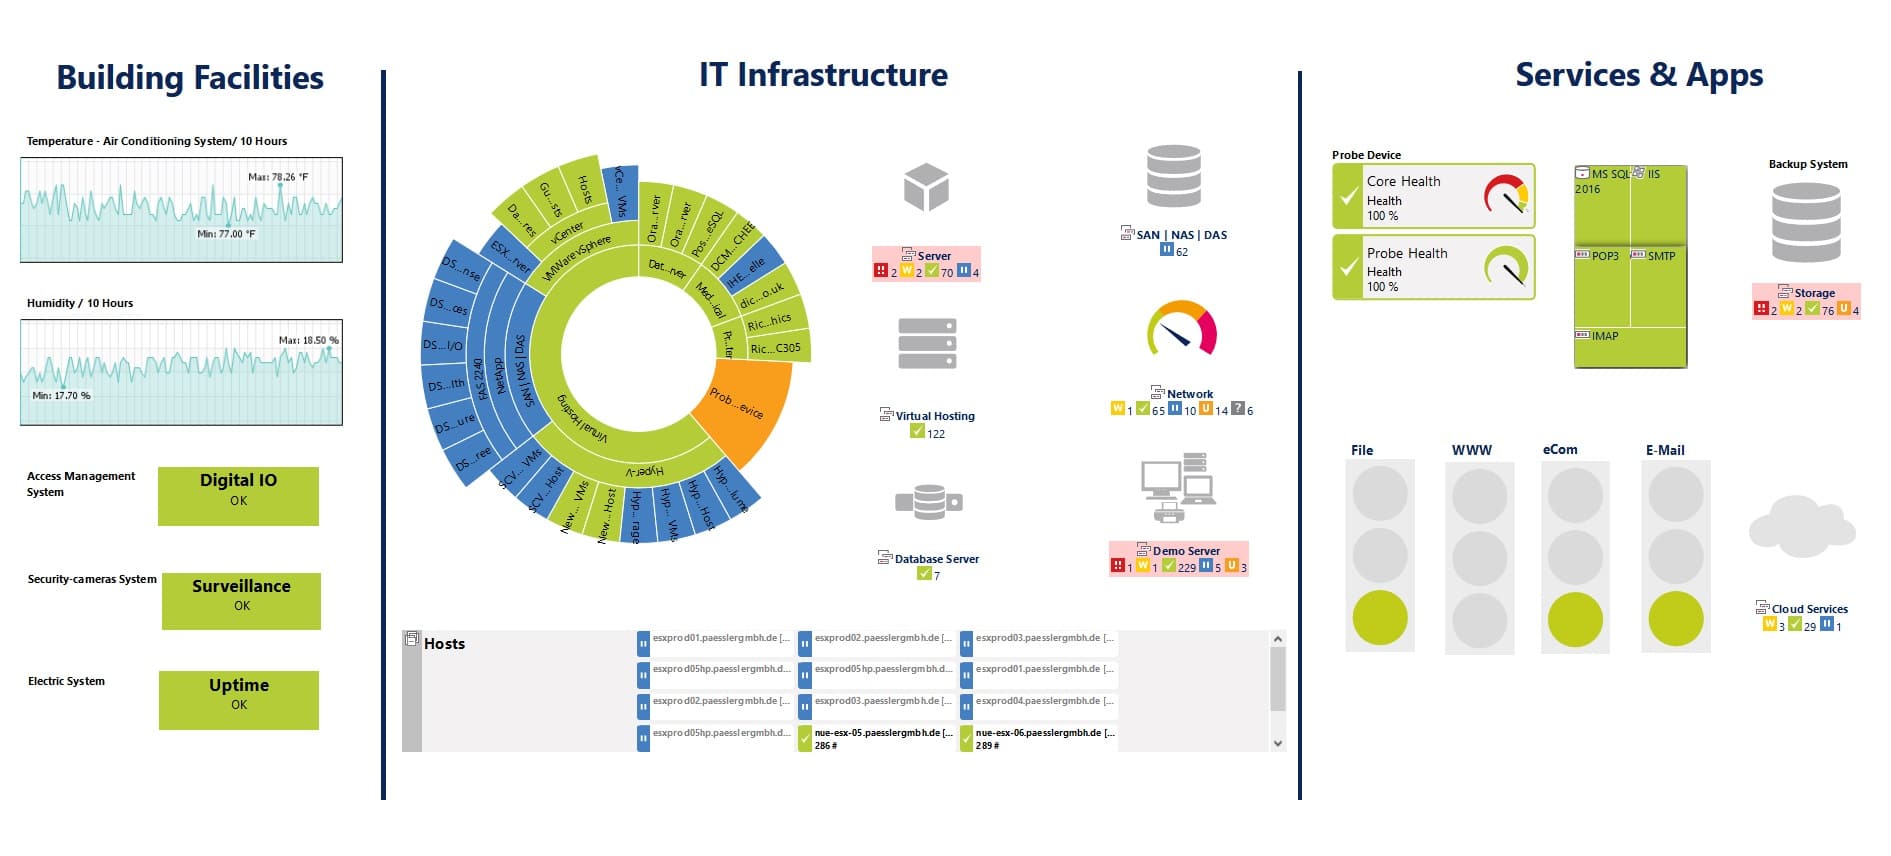 Paessler offers PRTG Network Monitor as its tool for data center monitoring. It is, in fact, a tool that takes care of data centers that, from a monitoring perspective, can be seen as an entity composed of three main blocks:
- Data Center Environment – this covers all aspects of data center facilities and includes physical sensors for monitoring temperature, humidity, smoke, and even feedback from security cameras.
- IT and Network Infrastructure – this includes connectivity devices like switches and routers, as well as servers, firewalls, load balancers, and VMs.
- Applications and Services – these are the applications and services that are hosted in a data center and include examples like web servers (IIS, Apache), database servers (Microsoft SQL Server 2005-2016, Oracle, MySQL, PostgreSQL), mail servers (Exchange, IMAP, POP3, SMTP), web applications (websites, portals), backups, security solutions (proxies, VPNs), and any other in-house custom applications.
Key Features:
- Comprehensive Data Center Monitoring: Provides real-time monitoring of servers, network devices, storage systems, and applications, ensuring optimal performance and availability across the data center.
- Automated Network Discovery: Automatically detects and maps all devices within the network, simplifying the management of complex data center infrastructures.
- Customizable Dashboards and Reporting: Offers flexible dashboards and detailed reports, allowing administrators to tailor monitoring views and analyze performance metrics effectively.
- Integrated Alerting System: With multiple built-in notification methods, including email and SMS, PRTG ensures prompt alerts to potential issues, enabling swift response and resolution.
- Scalability: Supports monitoring for data centers of various sizes, adapting to the evolving needs of growing organizations.
Why do we recommend it?
Paessler’s PRTG Network Monitor stands out as a comprehensive solution for data center monitoring, addressing the diverse aspects of data center management. Its holistic approach encompasses the entire data center environment, including facilities, IT infrastructure, and applications/services. PRTG offers a versatile set of over 250 predefined sensors, supporting devices from prominent manufacturers like Dell, Citrix, HP, and IBM. The agentless nature of PRTG simplifies integration with diverse devices, ensuring seamless monitoring within the data center. Notably, its real-time monitoring capability, coupled with a flexible notification mechanism, empowers administrators to promptly detect and address performance anomalies, such as bandwidth overuse or temperature changes.
PRTG Network Monitor covers these three blocks and takes care of the whole data center from internal software to the hardware that holds and connects it all, and onto the peripheral devices that facilitate the proper and secure delivery and usage of data.
On top of that, it offers over 250 predefined sensors – right out of the box – to cover device manufacturers like Dell, Citrix, HP, IBM, and more.
PRTG is agentless, which means that even when other brands are brought into the data center it is still easy to integrate the devices with the help of custom sensors.
It can be safely assumed that any object with an IP address – and that supports a monitoring protocol like HTTP, SNMP, or WMI – can be monitored by PRTG.
PRTG has a flexible and powerful notification mechanism that lets administrators know about issues like overuse of bandwidth or changes in the temperature in a data center. All that is needed is to set the thresholds and since the monitoring is done in real-time, the tool will automatically detect any performance anomalies and instantly send out alerts.
Finally, we have PRTG’s data reporting service which is used to not only see how a data center and the digital assets that are under it are performing at present but also serves as a platform with which administrators can spot trends and make decisions about future scaling and planned capacity enhancements.
Who is it recommended for?
PRTG Network Monitor is recommended for administrators and IT teams overseeing data center operations, covering a broad spectrum of responsibilities, from facilities management to IT infrastructure and application/service monitoring. Its versatility makes it suitable for data centers of varying sizes and complexities, catering to organizations with diverse device landscapes. PRTG’s user-friendly interface, support for industry-leading manufacturers, and real-time monitoring capabilities make it an ideal choice for those seeking a unified solution for comprehensive data center management. Whether addressing environmental factors, IT infrastructure components, or application/service performance, PRTG Network Monitor offers a scalable and efficient platform for effective data center monitoring and decision-making.
Pros:
- Ease of Use: Users appreciate the intuitive interface and straightforward setup process, which facilitate quick deployment and efficient monitoring.
- Comprehensive Monitoring Capabilities: Extensive range of sensors allows for detailed monitoring of diverse IT infrastructure components, providing a unified view of data center health.
- Proactive Alerting: The customizable alerting system enables early detection of potential issues, allowing for timely interventions and minimizing downtime.
- Customizable Dashboards: Administrators can create tailored dashboards to focus on critical metrics, enhancing the relevance and clarity of displayed information.
- Scalability: Accommodates the monitoring needs of both small and large data centers, supporting organizational growth and complexity.
Cons:
- Learning Curve for Advanced Features: While basic setup is user-friendly, mastering advanced functionalities may require additional time and training.
Try the FREE unlimited version of PRTG Network Monitor for 30 days. (After 30 days, PRTG reverts to a free version).
5. Datadog Data Center Monitoring Dashboards

Datadog Network Device Monitoring is the ideal tool to use for the collection of telemetry from SNMP-managed devices which are themselves automatically discovered by the Datadog Agent which collects their metrics and events and sends it back to Datadog, the SaaS-based data analytics platform.
Key Features:
- Real-Time Interactive Dashboards: Provides live visualization of data center metrics, enabling immediate insights into performance and health.
- Customizable Widgets: Users can tailor dashboards with various widgets, such as time series graphs, heatmaps, and top lists, to represent data in the most meaningful way.
- Out-of-the-Box Templates: Offers pre-configured dashboard templates for common data center components, facilitating quick setup and standardization.
- Collaboration Tools: Dashboards can be shared across teams with role-based access controls, promoting collaborative monitoring and troubleshooting.
- Integration with Multiple Data Sources: Integrates with over 450 technologies, allowing dashboards to display a unified view of diverse data center systems.
Why do we recommend it?
Datadog Network Device Monitoring stands out as an ideal solution for organizations seeking comprehensive telemetry collection from SNMP-managed devices. In our testing, Datadog’s seamless integration with SNMP-managed devices, automatically discovered by the Datadog Agent, showcased its efficiency in metric and event collection. The platform’s out-of-the-box dashboards provide instant visualizations of data center and device performances, empowering administrators to swiftly identify and troubleshoot issues on both on-premises and hybrid networks before they impact users. Additionally, the inclusion of predictive graphs for inbound and outbound bandwidth metrics enhances proactive monitoring, allowing administrators to anticipate potential issues and take preventive measures.
Once discovered, the metrics are instantly visualized with out-of-the-box dashboards that display data for data center and device performances. Administrators can then start identifying and troubleshooting a range of issues, whether they are on-premises or hybrid networks before they impact users.
The Data Center Overview dashboard gives a high-level bird’s eye view visibility into the health and performance of devices in any location, including data centers, and campus sites. This dashboard quickly shows how many devices are up and running and displays an inventory of all the monitored devices, sorted by device uptime or with the help of tag-based filters, for example, to zero-in on devices from any particular location.
The Data Center Overview dashboard also has graphs that display forecasts on inbound and outbound bandwidth metrics in order to predict when specific interfaces will exceed their limits based on their historical performances. This is intended to help determine whether an upcoming spike, when parameters like predicted bandwidth consumptions are taken into consideration, will negatively affect a data center’s performance. After all, an increase in usage could lead to greater network latency, which could in turn render a network unusable during this time.
Administrators can, therefore, create forecast monitors using such predictive models to make sure they are alerted ahead of time of any impending spikes and tackle them beforehand.
Who is it recommended for?
Datadog Network Device Monitoring is recommended for administrators and IT teams responsible for the effective monitoring and management of data center devices, particularly those leveraging SNMP-managed devices. Its user-friendly dashboards and forecasting capabilities make it suitable for organizations of varying sizes and complexities. Datadog’s emphasis on predictive models, and alerting ahead of potential spikes ensures proactive issue resolution, making it an ideal choice for those prioritizing performance optimization and user experience. Whether managing data centers or campus sites, Datadog’s intuitive interface and predictive analytics contribute to a comprehensive solution for organizations seeking efficient data center monitoring and proactive issue resolution.
Pros:
- Comprehensive Visibility: Dashboards consolidate metrics from various sources, providing a holistic view of the data center’s performance.
- User-Friendly Interface: Intuitive design and drag-and-drop functionality make it easy to create and modify dashboards without extensive training.
- Scalability: Handles large volumes of data, making it suitable for data centers of all sizes.
- Proactive Monitoring: Real-time data and customizable alerts enable teams to identify and address issues before they impact operations.
- Extensive Integration Capabilities: Support for a wide range of technologies ensures that all critical systems can be monitored within a single platform.
Cons:
- Complex Pricing Structure: Some users find Datadog’s pricing model to be intricate, potentially leading to unforeseen costs as monitoring needs expand.
Try Datadog Data Center Monitoring Dashboards FREE for 14 days.
6. SolarWinds Data Center Management Solutions

SolarWinds Data Center Management Solutions offers a suite of tools that help administrators monitor all aspects and features of the software and hardware in their data centers. Armed with these tools, they can gain observability into the whole domain, and get insights into every device or solution that caters to networking, data storage, and virtualization.
Key Features:
- Comprehensive Infrastructure Monitoring: Provides real-time visibility into servers, network devices, storage systems, and applications, ensuring optimal performance and availability across the data center.
- Automated Discovery and Mapping: Automatically detects and maps all devices within the network, simplifying the management of complex data center infrastructures.
- Unified Dashboard: Offers a centralized interface to monitor and manage diverse data center components, providing a holistic view of the IT environment.
- Advanced Alerting and Reporting: Delivers customizable alerts and detailed reports, enabling proactive issue resolution and informed decision-making.
- Scalability: Designed to support data centers of various sizes, adapting to the evolving needs of growing organizations.
Why do we recommend it?
SolarWinds Data Center Management Solutions, encompassing tools like Network Performance Monitor (NPM), Network Configuration Manager, Virtualization Manager (VMAN), and Storage Resource Monitor (SRM), offers a comprehensive suite for monitoring various aspects of data centers. In our thorough testing, these tools demonstrated exceptional capabilities in providing observability into networks, servers, virtual machines, and storage environments. The integration of features like PerfStack, NetPath, and Orion Maps within NPM enhances root cause analysis and issue resolution. With efficient network configuration management, VM performance monitoring, and storage resource visualization, SolarWinds Data Center Management Solutions stands out for its versatility and reliability in addressing the complexities of modern data center management.
Some of the tools in the Data Center Management Solutions include:
SolarWinds Network Performance Monitor (NPM) – this tool monitors the network. It connects to and correlates with NetFlow – a network traffic analyzer. It tracks configurations, virtual machines (VMs), servers, and applications to help diagnose and resolve complex hybrid network data performance issues.
NPM comes with its own set of tools – like PerfStack, NetPath, and Orion Maps – that can be used to correlate historical or real-time data and present it in a format that can be used to perform root cause analysis and then resolve issues quickly.
Network Configuration Manager – this tool is used for automatic network configuration management and backups. It helps save time and improves network reliability and security by managing configurations, changes, and compliance of routers, switches, and other connectivity devices. It can identify performance or configuration issues on many of the popular network devices made by the likes of Cisco Nexus, Cisco ASA, and Palo Alto network devices.
When coupled with NethPath, administrators can see any changes that have been made in the configurations of network service paths and then handle them accordingly. They can also troubleshoot performance issues caused by configuration changes when this tool is coupled with PerfStack.
Virtualization Manager (VMAN) – as the name suggests, this is a tool for monitoring and optimizing the performance of VMs.
It is an affordable, easy-to-use, and intuitive tool for VM performance management and capacity planning across platforms like VMware vSphere, Microsoft Hyper-V, and Nutanix AHV. Administrators can pinpoint if the root cause of an issue lies in an application, a virtual server, a host, or a data store – especially when it is used in tandem with Server & Application Monitor (SAM) and Storage Resource Monitor, which are SolarWinds’ other solutions for monitoring servers, applications, and storage devices.
Storage Resource Monitor (SRM) – and here, we have a storage management and performance monitoring tool.
It helps visualize storage environments by tracking volumes, RAID groups, storage pools, disks, and much more. This, in turn, helps fix storage issues faster by allowing for drilling into data store details where administrators can first spot storage issues and then use SRM to investigate each layer further.
Users can quickly understand the impact of storage issues spotted in SRM with the help of VMAN and SAM which can help to identify the dependencies between the VMs, hosts, and storage.
As we can see, SolarWinds Data Center Management Solutions are worth investing in because of their own capabilities as well as its ability to integrate and work with numerous other SolarWinds products that are used to administer applications, servers, and networks.
Who is it recommended for?
This tool suite from SolarWinds is recommended for IT administrators and organizations of varying sizes seeking robust and versatile data center management solutions. Small to large enterprises can benefit from the scalability and comprehensive insights provided by these tools. SolarWinds’ user-friendly interfaces and powerful functionalities make it suitable for both experienced administrators and those new to data center management. The suite’s ability to cater to networking, virtualization, and storage needs, positions it as an ideal choice for organizations aiming to streamline their data center operations, ensuring optimal performance, reliability, and security.
Pros:
- User-Friendly Interface: Features an intuitive design that simplifies setup and daily operations, reducing the learning curve for new users.
- Comprehensive Monitoring Capabilities: Enables monitoring of a wide range of IT infrastructure components, providing a unified view of data center health.
- Proactive Alerting: Facilitates early detection of potential issues, allowing for timely interventions and minimizing downtime.
- Customizable Dashboards: Allows users to tailor monitoring views to specific needs, enhancing the relevance and clarity of displayed information.
- Scalability: Accommodates the monitoring needs of both small and large data centers, supporting organizational growth.
Cons:
- Cost Considerations: Advanced features and scalability may come at a higher price point, which could be a consideration for budget-conscious organizations.
Register for a 30-day free trial of SolarWinds Data Center Management Solutions.
7. Zabbix
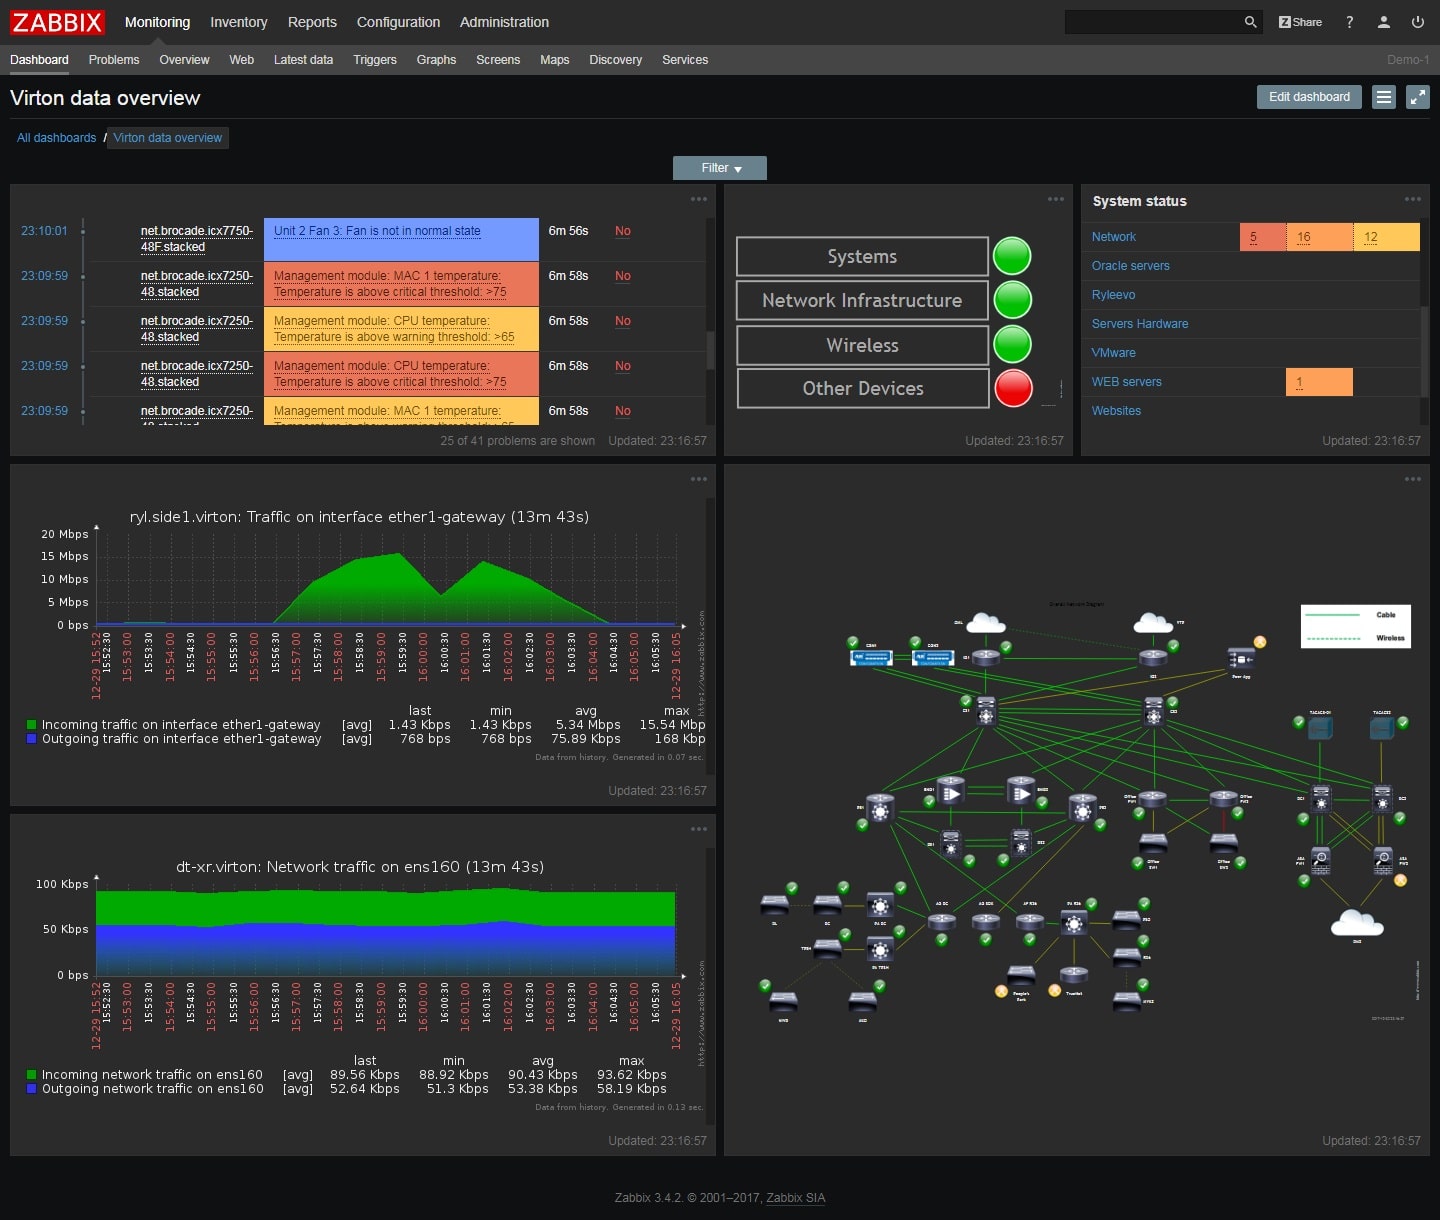
With Zabbix, we have a data center monitoring tool that can be implemented in any environment – be it big or small. This level of scalability is possible because of the algorithm that lies behind this tool which leverages modern hardware and software modularity to allow for the optimal use of modules and sub-programs.
Key Features:
- Comprehensive Monitoring: Offers real-time monitoring of servers, network devices, applications, and services, providing a unified view of the entire data center infrastructure.
- Scalability: Designed to handle large-scale environments, Zabbix can monitor thousands of devices across multiple locations, making it suitable for extensive data center deployments.
- Customizable Dashboards and Reporting: Users can create tailored dashboards and reports to visualize critical metrics, facilitating informed decision-making and efficient resource management.
- Automated Discovery: Automatically detects network devices and servers, streamlining the setup process and ensuring that all components are consistently monitored.
- Alerting and Notifications: Provides flexible alerting mechanisms, allowing administrators to receive notifications via various channels when predefined thresholds are breached.
Why do we recommend it?
Zabbix stands out for its unparalleled scalability, handling over 100,000 devices in a single installation, processing 3,000,000 checks per minute with mid-range hardware. Its adaptability to diverse environments, low-maintenance monitoring through proxies, and robust performance make it a premier data center monitoring choice. Zabbix agents enhance monitoring efficiency with minimal CPU and memory usage, ensuring compatibility with Windows, Linux, and UNIX.
The level of scalability can be further appreciated by the fact that this tool can cover over 100,000 interfaced devices monitored by one single Zabbix installation that can processes over 3,000,000 checks per minute, collecting gigabytes of historical data daily, and only using mid-range hardware.
The topography of the data center doesn’t matter because, even in a distributed architecture with branches and clients’ sites involved, the number of connections and opened ports are kept low while the monitoring still continues. Throw in low-maintenance monitoring with Zabbix proxies and it becomes clear why this is one of the best data center monitoring tools out there.
And then we have Zabbix agents which offer high performance for monitoring operating systems and application-specific metrics. These agents have a tiny digital footprint, which means they use minimal CPU resources and memory and can run on platforms like Windows, Linux, and UNIX.
Zabbix server and Zabbix proxy use various data caching solutions, giving them greater performance capabilities and reducing the load on the backend database. An interesting fact is that all components of Zabbix are immune to network and communication outages because they have efficient data buffer controls.
Who is it recommended for?
Zabbix is ideal for organizations of any size seeking scalable, versatile, and cost-effective data center monitoring. Suited for complex setups, it accommodates distributed architectures and appeals to IT teams valuing scalability, low-maintenance monitoring, and diverse platform support. From small-scale to extensive data centers, Zabbix’s feature-rich, resource-efficient, and open-source nature makes it a top choice for effective monitoring.
Pros:
- Open-Source Platform: Eliminates licensing costs, making it a cost-effective choice for organizations of all sizes.
- Extensive Community Support: A large and active user community contributes to a wealth of shared knowledge, plugins, and templates, enhancing the platform’s capabilities.
- High Customizability: Allows for extensive customization, enabling organizations to tailor the system to their specific monitoring needs and integrate with various third-party tools.
- Predictive Functions: Includes predictive monitoring features that can forecast potential issues based on historical data, allowing for proactive maintenance.
- Multi-Tenant Support: Zabbix supports monitoring multiple customer environments within a single instance, making it suitable for managed service providers.
Cons:
- Limited Official Support: While community support is robust, official support options are limited, which may be a consideration for organizations requiring guaranteed assistance.
- User Interface: Some users find the user interface to be less intuitive compared to other monitoring solutions, which can impact the efficiency of navigation and configuration.
Surprisingly, Zabbix is released under the GPL license and is thus free for commercial and non-commercial uses. There are no limitations on the number of monitored devices; you can use Zabbix to monitor any number of devices – absolutely free!
Download Zabbix for FREE.
8. Device42

Device42 is a data center and network management tool that offers inventory and asset management solutions for an efficient administration experience.
Key Features:
- Automated Asset Discovery: Continuously scans the network to identify and catalog IT assets, including servers, network devices, and applications, ensuring an up-to-date inventory without manual intervention.
- Comprehensive CMDB: Maintains a centralized Configuration Management Database (CMDB) that stores detailed information about each asset, facilitating effective change management and incident resolution.
- Application Dependency Mapping: Visualizes relationships and dependencies between applications and underlying infrastructure, aiding in impact analysis and optimizing resource allocation.
- Data Center Infrastructure Management (DCIM): Provides tools for managing physical data center components, including power, cooling, and space utilization, enhancing operational efficiency.
- IP Address Management (IPAM): Offers integrated IP address management, allowing for efficient tracking and allocation of IP resources within the data center.
Why do we recommend it?
Device42 is highly recommended for its comprehensive data center and network management capabilities. With features spanning inventory and asset management, IP address and software license administration, app dependency mapping, and more, it provides a robust solution for efficient administration. The intuitive web-based dashboard, coupled with powerful data center visualization tools, allows administrators to effortlessly replicate and model their IT environments, making it an indispensable tool for real-time insights and management.
The tool also offers administrative management features for IP addresses, software licenses, app dependency mappings, capacity and power planning, IT assets and QR codes, and much more.
In addition, Device42 comes with an audit trail, a cross-reference system, device auto-discovery, as well as data import and export features. It is all controlled from an intuitive web-based dashboard that uses powerful data center visualization tools of the monitored data and presents it as intelligent diagrams that reflect the IT environments in real time.
In fact, administrators can replicate their data centers with ease – they can simply drag and drop objects to create digital models that show their buildings, server rooms, and even individual racks. Furthermore, dependencies between applications and the infrastructures can be represented with insights into complex architectures that involve physical, cloud, and virtual platforms and taking into consideration configurations like switching, subnets, and bare metal servers, for example.
Device42 works well with legacy infrastructures and systems as it would do with modern ones thanks to its simple, out-of-the-box integrations. I can be integrated with IT service management (ITSM) and automation tools like Jira, VMWare, Zendesk, PowerBI, CloudEndure Migration, and much more.
Administrators gain access to the updated data on all deployed applications as well as their related dependencies, brand names, and version information. In the case of the hardware, Device42 documents their categories: physical, virtual, blade, clustered, etc., for example.
They can also record server processing powers and connection properties along with asset tags, serial numbers, and support information and details on the likes of CPUs, memory, HDDs, as well as IP and MAC addresses.
Who is it recommended for?
Device42 is a versatile solution suitable for a wide range of organizations seeking advanced data center and network management. Its adaptability to legacy and modern infrastructures, coupled with seamless integrations with ITSM and automation tools like Jira, VMWare, and PowerBI, makes it ideal for organizations of varying technological landscapes. IT administrators, looking for a tool that provides detailed insights into applications, dependencies, and hardware components, will find Device42 invaluable for maintaining a well-documented and organized IT environment.
Pros:
- Centralized Asset Repository: Consolidates all asset information into a single platform, improving visibility and control over the IT environment.
- Agentless Discovery: Performs asset discovery without the need for installing agents on devices, simplifying deployment and reducing overhead.
- Enhanced Compliance Management: Assists in maintaining compliance by providing accurate records of hardware and software assets, supporting audits and regulatory requirements.
- Scalability: Capable of handling large and complex IT environments, making it suitable for organizations of various sizes.
- Active Community Support: Benefits from a robust user community that shares knowledge, best practices, and solutions to common challenges.
Cons:
- Limited Reporting Flexibility: The platform’s reporting features may not meet all user needs, necessitating external tools for advanced analytics.
- Customization Constraints: While offering many features, customization options may be limited, affecting the ability to tailor the system to specific organizational processes.
Try Device42 for FREE.
Those were the best data center monitoring tools…
We have just seen the best data center monitoring tools and how they can help you master your core data storage and sharing architecture. We hope you have found it useful. Please, let us know if there is a tool you think belongs on this list. Simply leave us a comment below.