Performance testing has relied heavily on synthetic monitoring for several years now, and it seems likely that this trend will continue for the foreseeable future. This method of keeping track of the performance of your website, which is also known as proactive monitoring, is the safest bet you can make to ensure that you can live up to the standards that your visitors have set for you.
Here is our list of the best synthetic monitoring tools:
- ManageEngine Applications Manager EDITOR’S CHOICE This package provides a range of tools for monitoring different types of applications and systems such as endpoints and cloud platforms. It includes synthetic web transaction monitoring with real browsers. Runs on Windows Server, Linux, AWS, and Azure. Get a 30-day free trial.
- Site24x7 (FREE TRIAL) Provides a wide variety of synthetics, ranging from Ping-based availability checks to browser-based transaction monitoring, and does so from 110 different locations. Start a 30-day free trial.
- Datadog Offers a testing package available from a cloud platform known as Datadog Synthetic Monitoring. It monitors uptime, response time, and transaction tracking for websites from many locations.
- ManageEngine OpManager A network monitor based on SNMP and provides numerous options for organizing the network topology.
- SolarWinds Web Performance Monitor An on-premises website monitoring system that features information on uptime and response time, as well as tools for root-cause analysis linked to transaction monitoring.
- Dotcom-Monitor It provides advanced synthetic monitoring tools with a multitude of features for keeping tabs on availability, performance, and more.
- Auvik Automation and simplification of network management are the primary focuses of Auvik, helping to increase the productivity and capacity of IT departments. Additionally, it shields the company from any potential threats posed by the network.
- AlertBot An excellent option for companies of any size and in any industry. They provide cutting-edge capabilities that are accessed through an intuitive user interface, which makes their product both powerful and easy to use.
The solutions that are provided for verifying the performance, availability, reachability, and dependability of a website or application at any given moment are referred to as synthetic monitoring tools or services.
All of these aspects are validated through the simulation of user interaction. It assists in locating and fixing issues before your end-users become aware of them, which is a significant advantage. In this article, we will examine and analyze the leading synthetic monitoring tools and services to assist you in selecting the ideal synthetic monitoring tool to meet the requirements of your company:
The Best Synthetic Monitoring Tools
1. ManageEngine Applications Manager (FREE TRIAL)
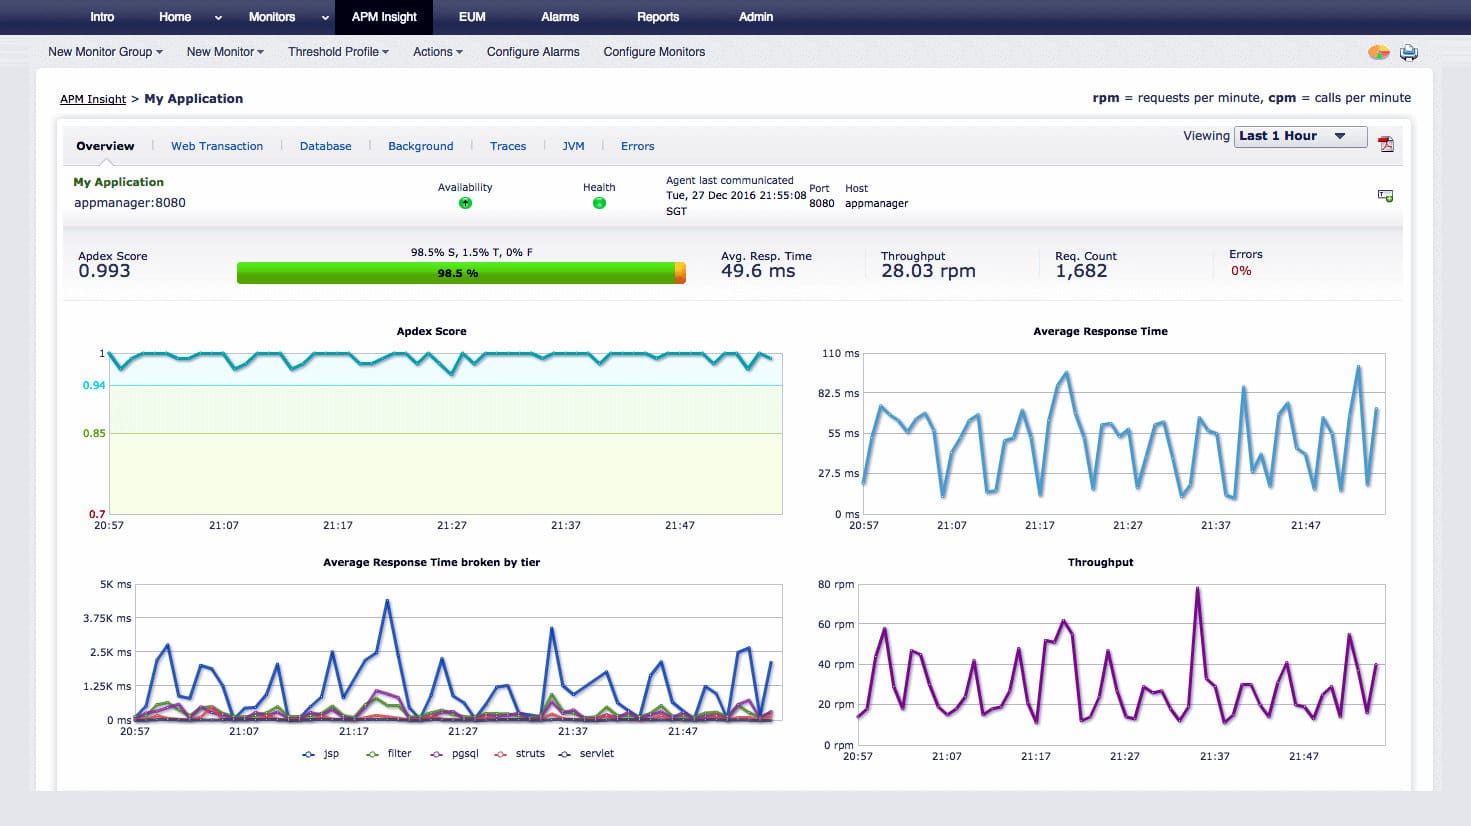
ManageEngine Applications Manager offers proactive, simulated performance insights to ensure optimal application health. By simulating user transactions and tracking performance metrics such as response times, availability, and transaction success rates, the tool will detect potential issues before they impact real users.
Key Features:
- Simulates complex user interactions like logins, form submissions, and checkouts to monitor end-to-end performance.
- Can launch tests from multiple global locations to track regional performance.
- Tests the availability and response of APIs, ensuring they meet performance standards.
- Notifies teams when response times or performance metrics exceed defined thresholds.
- Allows users to create scripts that mimic specific user interactions for tailored monitoring.
ManageEngine Applications Manager’s synthetic monitoring provides IT teams with the ability to simulate user journeys across web applications, enabling the detection of performance bottlenecks before they affect actual users. This is crucial for maintaining high service quality in environments where user experience is a top priority. The tool’s multi-step transaction monitoring feature, which simulates complex interactions such as logins and payments, ensures that critical workflows function smoothly across regions, minimizing the risk of performance-related issues.
By simulating transactions from multiple global locations, businesses can track performance for users in different regions, identifying any geographic-based latency or performance issues. This feature helps businesses ensure that their applications perform optimally for users worldwide, whether they’re monitoring websites, APIs, or other critical services.
In addition to synthetic monitoring, ManageEngine Applications Manager offers many other system monitoring services for applications and platforms. Synthetic monitoring data can be correlated with other performance metrics from databases, servers, and network infrastructure, providing a complete picture of application performance.
ManageEngine Applications Manager runs on Windows Server or Linux and it is also available on the marketplaces of AWS and Azure. There is a Free Edition, which will monitor up to five resources. You can get a 30-day free trial of the Professional Edition.
EDITOR'S CHOICE
ManageEngine Applications Manager is our top pick for a synthetic monitoring tool because it provides businesses with proactive insights into their application performance from an end-user perspective. Synthetic monitoring simulates user interactions by running pre-defined scripts to check the availability and performance of websites, web applications, and APIs. This allows businesses to detect issues before real users experience them, ensuring a seamless user experience and minimizing downtime. With ManageEngine’s synthetic monitoring, IT teams can simulate transactions across global locations to track performance metrics like response times, page load speeds, and transaction success rates. This capability helps identify potential latency or bottlenecks in different geographies, allowing teams to optimize application performance for users around the world. The tool also supports multi-step transaction monitoring, which simulates complex user journeys, such as logging in, filling forms, or purchasing, to ensure that critical workflows function properly. The package includes real-time alerts that trigger when performance deviates from expected thresholds. Its integration with other monitoring modules offers a complete, unified view of application health and user experience.
Download: 30-day FREE Trial
Official Site: https://www.manageengine.com/products/applications_manager/download.html
OS: Windows Server, Linux, AWS, and Azure
2. Site24X7 Network Monitoring (FREE TRIAL)
It is not true that the Site24x7 monitoring agent in any way compromises the safety of your server. The Site24x7 server monitoring agent solely makes use of a one-way HTTPS connection, which is compatible with firewalls and in most cases does not require you to open any new ports to the outside world.
Key Features:
- A network device inventory that is automatically discovered and kept up to date using auto-discovery is one of the key characteristics.
- The creation of an automatic map of the topology of a network.
- Includes monitoring of the performance of the internet for things like virtual private networks (VPNs).
- Each storage cluster has its own set of monitoring procedures.
- Monitors the boundary and edge services, such as load balancers, for optimal performance.
Users are granted the ability to obtain data regarding the availability and performance of web apps, internet services, and private networks through the platform. Monitoring website performance, web page speed (browser), DNS servers, website availability, website defacement monitoring, File Transfer Protocol (FTP) speed, Representational State Transfer (REST) API, Secure Sockets Layer (SSL)/Transport Layer Security (TLS) certificates, and more are some of the best features that Site24x7 has to offer.
The status of the devices is checked by Site24x7 on a minute basis using Simple Network Management Protocol (SNMP). If the answers to these questions indicate that there have been adjustments made to the infrastructure of the network, the inventory, and the topology map will be updated. The process of looking for devices that are connected to the network is the first step of the network monitoring service that is included with this package. The information technology department creates a network topology map in addition to writing down the findings of a network inventory.
Site24x7 is responsible for monitoring a wide variety of network components, including but not limited to switches, routers, firewall appliances, power supply, load balancers, wireless networks, cloud services, and WAN connections. There is no traffic monitor for the bandwidth being provided. The monitor concentrates on the hardware that is currently connected. When you consider the Site24x7 package as a whole, you will notice that the system monitors not only the endpoints and servers, but also the servers themselves. In addition to that, it monitors the performance of programs. Start with a 30-day free trial.
3. Datadog
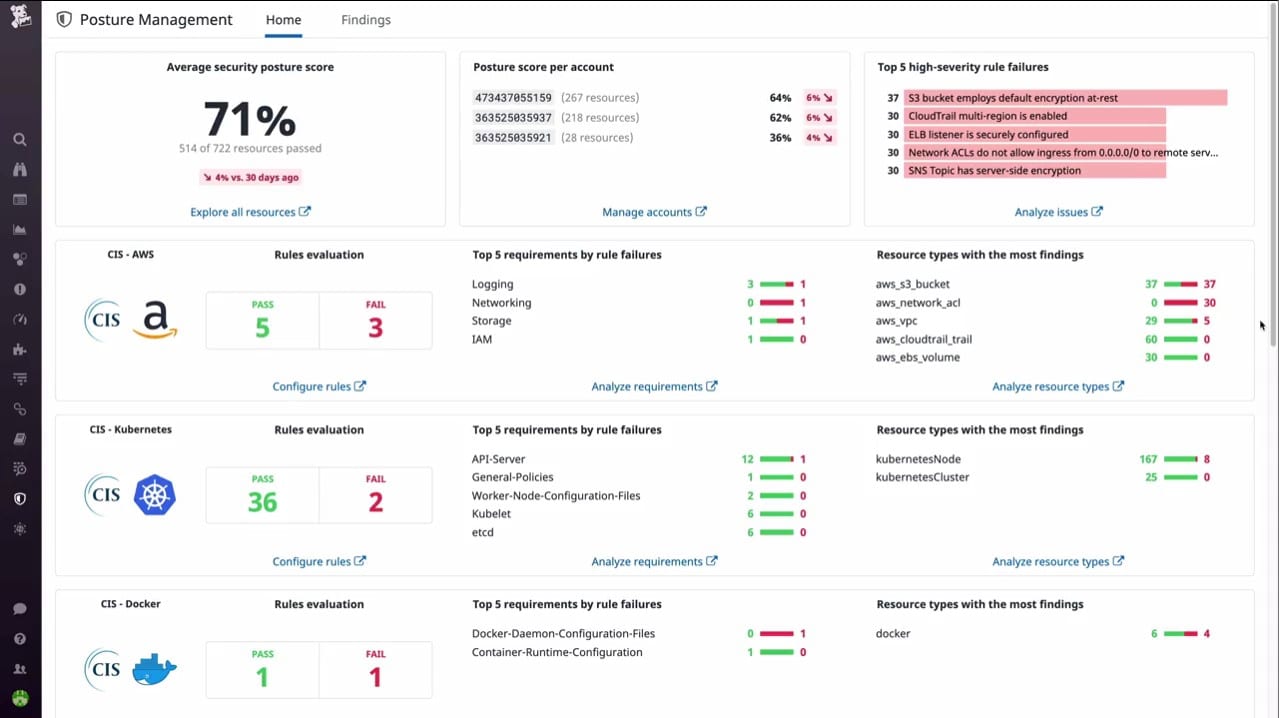
With Datadog you will be able to assure uptime, discover regional issues, and manage your SLAs and SLOs with the assistance of synthetic monitoring. You can proactively uncover problems in application endpoints using synthetic API and browser testing before those problems affect your clients. Utilize a code-free web recorder to quickly build up tests and customize them to run from any Datadog-managed location anywhere in the world. This can be done in a matter of minutes.
Key Features:
- As an illustration, the Datadog Application Performance Monitor comes equipped with both a code profiler and a distributed tracing tool. These services, when combined with the Synthetic
- A monitoring package is an excellent option for companies who need to investigate the reasons behind a decrease in the performance of their Web applications.
- The tests conducted by Datadog guarantee that end-users can carry out essential business operations. These operations include navigating to your homepage, adding products to a shopping cart, and logging in.
- Datadog offers the feature of Web-Recorder for code-free test creation.
You can choose the location of the test launch thanks to the test launcher that comes with the Synthetic Monitoring package. This allows you to monitor site performance from the perspective of users from anywhere in the world. Integration of synthetic testing into a continuous integration and continuous delivery pipeline is also a possibility in DevOps setups.
Datadog is organized as a series of modules, one of which is the Synthetic Monitoring package. Complementary modules can be combined to increase the overall value of the platform.
It has continuous, automated testing capabilities so that you can still identify issues during off-hours. Datadog has sophisticated alerting capabilities that alert team issues while minimizing false positives. It can track SLAs and SLOs. It has easy sorting and filtering with tags.
The alerting features of Datadog are quite extensive, and the platform also enables an easy setup of synthetic monitoring and tests. It can immediately monitor important user journeys and assist you in more quickly troubleshooting difficulties. It takes a proactive approach to checking the availability of the site.
4. ManageEngine OpManager
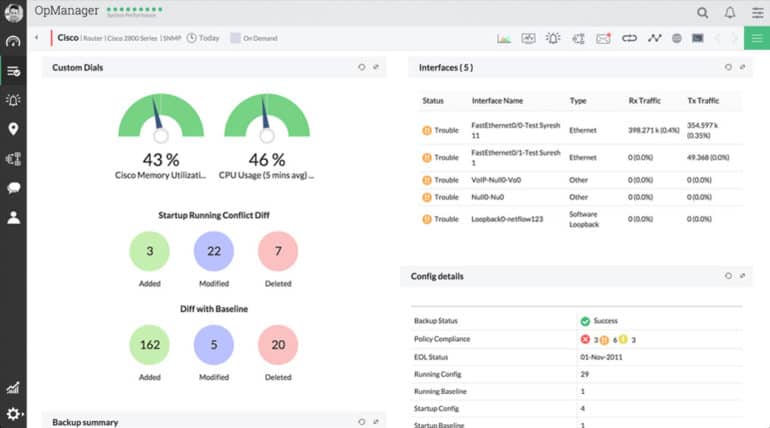
ManageEngine OpManager is an integrated solution for network management that simplifies and improves the effectiveness of network management. It gives network and IT managers the ability to monitor network performance, analyze bandwidth, manage configuration, manage firewalls, monitor storage, manage IP addresses (IPAM), and manage switch ports (SPM), among other things, all at the same time.
Key Features:
- Functions as an SNMP manager and continuously monitors the health status of connected devices.
- Obtains SNMP Traps and notifies the appropriate parties if a device experiences a problem.
- Determines where the system’s weaknesses lie and establishes performance limits.
- Maintains a watchful check on the number of available resources.
- Live data dials and graphs that may be customized to meet your specific requirements.
- Alerts can be emailed or texted to individuals.
This application provides a solid mix of functions for monitoring and analyzing networks, making it one of the better options for controlling network tools. The solution can monitor the traffic on your network in addition to taking care of your servers, network configuration, network issues, and network performance. It can also take care of all of these things. Manage Engine For users to make use of OpManager, it must first be deployed locally on their own premises.
In addition, the custom dashboard that comes with OpManager enables you to view all the most relevant metrics about your network in a single location, which eliminates the need to toggle between screens. This grants you complete control as well as complete visibility, allowing you to easily address any issues that may arise with the network.
The fact that this solution comes with network monitor device templates that have already been set up is among the most beneficial aspects of purchasing it. These have monitoring parameters and periods that have already been established for specific sorts of devices. For example, a timer may be set to check on the device every five minutes.
5. SolarWinds Pingdom
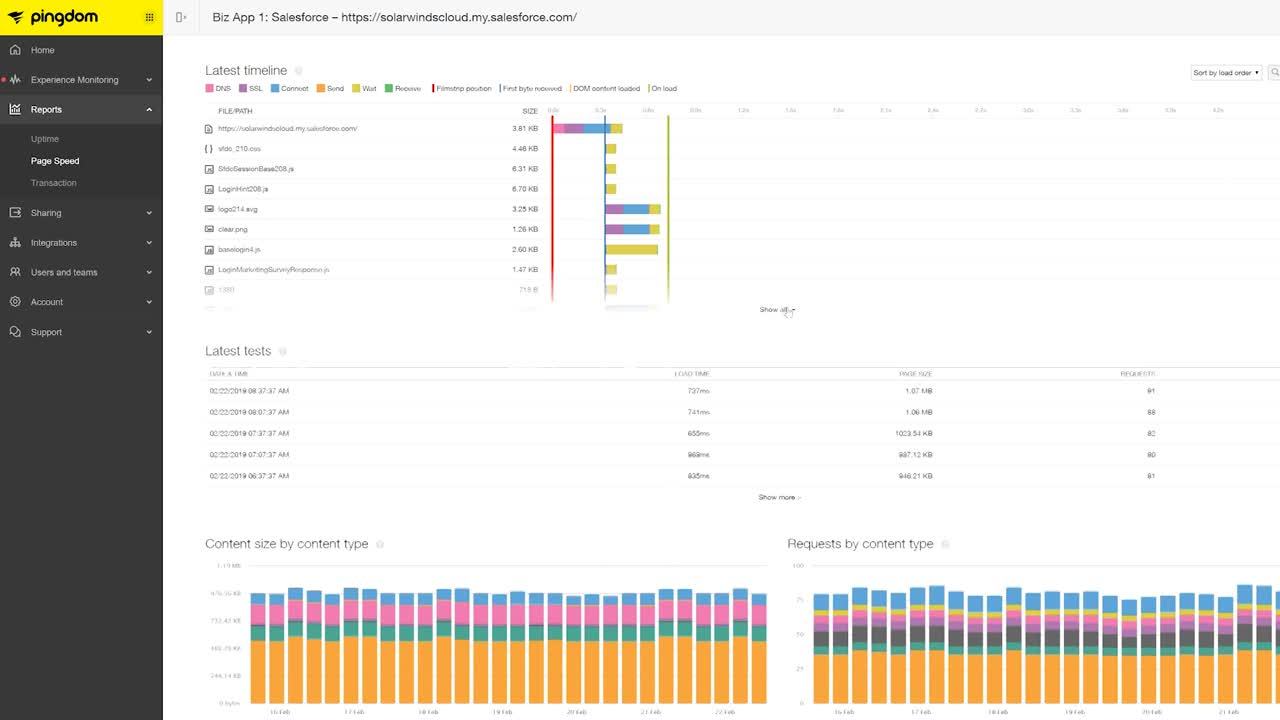
Pingdom is included in the DevOps solution that SolarWinds provides for its customers. It is a monitoring service that covers the complete stack. Pingdom offers two different kinds of monitoring services: synthetic monitoring and real-user monitoring. Synthetic monitoring and RUM working together as a solution will provide you with the highest level of visibility and make troubleshooting much simpler.
Key Features:
- Pingdom performs uptime monitoring from more than one hundred different locations across the world.
- It can examine the page’s loading speed.
- It may test straightforward as well as extremely complicated transactions for transaction monitoring.
- Pingdom RUM will provide you with real-time insights into the performance of your website or web app based on the data collected from actual users.
SolarWinds produces several infrastructure management solutions, including the Network Performance Manager. Each of these programs runs on its own instance on a platform known as Orion, which is also used by the other programs. If you buy all the Orion-based software at the same time, it will all work together because they share the same data and modules. This is only possible if you buy all the software at the same time. Directly from a web browser, users can gather and examine real-time as well as historical statistics that are generated by routers, switches, firewalls, servers, and any other devices that are enabled with SNMP, API, or WMI.
The Synthetic Monitoring Solution is capable of carrying out proactive monitoring of the availability, performance, and transactions of web applications. Real User Monitoring Solution will provide you with information regarding the performance of the web app from the point of view of the end user. Transaction monitoring, including URL hijacking, shopping cart checkout, and other similar activities can be carried out with its assistance.
Pingdom provides all the features that are necessary for digital marketers, web hosting providers, web developers, and IT/Web Ops professionals. tracking tasks such as transaction tracking, page speed monitoring, and uptime monitoring are all within the capabilities of Synthetic Monitoring Solution. Monitoring the user experience, user behavior data, and shared reports are all features that come standard with RUM.
6. Dotcom-Monitor

Dotcom-Monitor’s all-in-one monitoring tool examines the performance, functionality, and uptime of real browsers to accurately understand user interactions with your web pages, web applications, APIs, and services in real-time.
Key Features:
- Web Page Monitoring enables users to monitor the load times of individual web pages as well as element-level details using real browsers sourced from data centers located all over the world.
- Web Application Monitoring: Track the functionality, performance, and accessibility of multi-step web transactions across the world.
- Infrastructure Monitoring: This feature allows users to monitor the functionality and performance of different Internet services using a platform that may be configured in a variety of ways.
- Monitoring memory, disk utilization, and bandwidth across many locations using Linux, Windows, and user-defined performance counters is part of the performance counter monitoring service.
When viewed from the point of view of the end user, Dotcom-Monitor makes it simple to guarantee uptime, performance, and availability on a worldwide scale. Full monitoring solutions include every aspect of the process, including the following:
7. Auvik
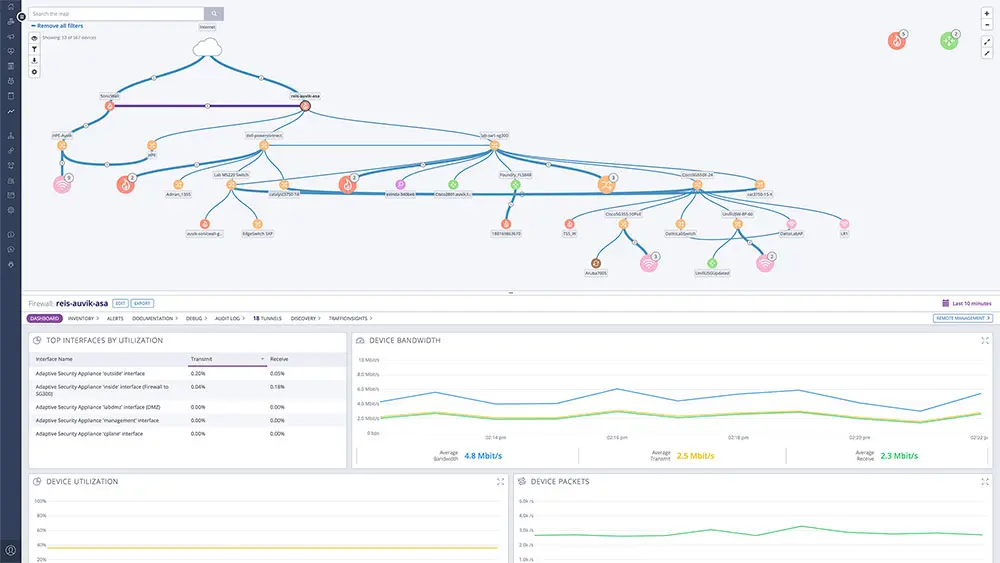
The cloud-based network management software developed by Auvik ensures the smooth operation of information technology networks located all over the world. Automating and simplifying network management are two of Auvik’s many contributions to increasing the effectiveness and capacity of IT departments and teams. Additionally, it shields the company from any potential threats posed by the network. Mapping and inventory of network nodes in real-time: Locate and investigate new networks as soon as possible. Then, ensure that you are up-to-date. You will always be aware of the location of everything, even if your users and gadgets relocate.
Key Features:
- Principal characteristics include a centralized monitoring system for networks that span several locations.
- Maintains a watchful eye on the operational state of network devices
- Offers two different plans: Both Crucial and Performance-Related
- The more comprehensive plan includes doing traffic analysis of the network.
- Capable of monitoring both physical networks and virtual local area networks
The ability for the Auvik network monitoring system to be automated is made feasible by the utilization of a threshold system. The majority of the metrics that are being monitored by the network monitor already have thresholds that are incorporated into the service. In addition to that, you have the option of customizing your thresholds.
Utilizing third-party technologies that interface with the Auvik network monitor is one way that the service offered by Auvik can be improved. Essential and Performance are the two distinct categories of plans that are offered by Auvik. The Performance plan is the more advanced one, and in addition to the network monitoring services that are included with the Essentials plan, it also offers functionality for Syslog management and traffic analysis.
8. AlertBot

AlertBot is one of the most prominent participants in the world of synthetic monitoring and is an excellent choice for businesses of any size. They conduct all of their performance testing on genuine web browsers, which enables them to assist in locating issue areas and bottlenecks on your website and ultimately enhance the user experience.
Key Features:
- The interface is straightforward to use, which makes it quick and simple to configure and monitor complex websites and online applications.
- Identify bottlenecks, localize problems, and cut downtime to provide users with a more positive experience when using the website.
- Receive alerts to you or your team through text, email, or phone calls whenever your website is slow or down.
- The team at AlertBot is working alongside you to ensure that all of your pages and recorded experiences are constantly functioning properly.
- You can keep an eye on your website from different locations all over the world, giving you comprehensive coverage.
AlertBot excels at providing customers with advanced capabilities that are very easy and intuitive to use, personally assisting customers with the setup of web transaction monitoring, and providing detailed email reports that pinpoint website problems so that you can take action promptly.
AlertBot is an excellent option for companies of any size and in any industry. They provide cutting-edge capabilities that are accessed through an intuitive user interface, which makes their product both powerful and easy to use. Their Proactive ScriptAssist function is a fantastic benefit that ensures your recorded experience will always run properly. It helps to make sure that your experience is constantly running smoothly.
AlertBot also offers an exceptional Health Map report, which is emailed to me daily and provides essential high-level performance indicators regarding my locations and processes.
