
How do you know what is wrong with your network? If you answer ‘gut feeling’ then you’re doing it wrong! Network troubleshooting tools point you in the direction of the root cause of performance issues like latency so that you can fix the problem and improve performance while speeding up your resolution time.
In this article, we’re going to look at the 9 best network troubleshooting tools.
Here is our list of the best network troubleshooting tools:
- ManageEngine OpManager EDITOR’S CHOICE Network monitoring platform that allows you to monitor your network, servers, applications, and services. It comes with an alert system and can even run scripts in response to events. Get a 30-day free trial.
- Site24x7 (FREE TRIAL) From a cloud-based platform, this service monitors network devices and traffic activity while also tracking performance across servers, cloud platforms, services, middleware, applications, and Web assets. Start a 30-day free trial.
- ManageEngine OpManager Nexus (FREE TRIAL) A comprehensive network monitoring tool that continuously analyzes the devices, traffic, configurations, and bandwidth usage in your networks. Its contextual alerts and intuitive dashboards ease troubleshooting. Download a 30-day free trial.
- Paessler PRTG Network Monitor Network, server, application, and virtualization monitoring platform with customizable alerts. It includes custom dashboards and network maps for better visibility.
- ping Command-line utility for Windows that sends ICMP echo request messages to check the availability of devices. The tool also tells you the round trip time of the packets.
- Obkio A cloud-based SaaS package that provides live network monitoring and also offers on-demand tools for troubleshooting across a network or on the internet.
- SolarWinds Network Performance Monitor A performance monitoring tool with autodiscovery and WiFi heat maps. It includes email and SMS alerts.
- tracert (traceroute) Windows-based utility that monitors the path packets take across a network and the round trip time. The user can use Tracert to monitor how much delay there is at each hop.
- Wireshark A network analyzer that can inspect network traffic in real-time. It can inspect encrypted traffic that is often used in cyber attacks. The user can filter content with display/capture filters.
- nmap A vulnerability scanner that can be used to find open ports in a network. The user can also find out additional information including the vendor of a device, the OS version, and uptime.
- ipconfig/ifconfig Command-line tool that allows you to check the IP configuration of your computer. You can view information such as IP address, subnet mask, MAC address, and the default gateway.
Our methodology for selecting the best network troubleshooting tools
We reviewed the market for network troubleshooting tools based on the following criteria:
- The tool’s ability to diagnose a wide range of network issues
- Ease of use and user interface intuitiveness
- The quality and responsiveness of automated alert systems
- The tool’s capability for in-depth network performance monitoring
- The availability of customizable visualizations and dashboards
The best network troubleshooting tools
1. ManageEngine OpManager (FREE TRIAL)

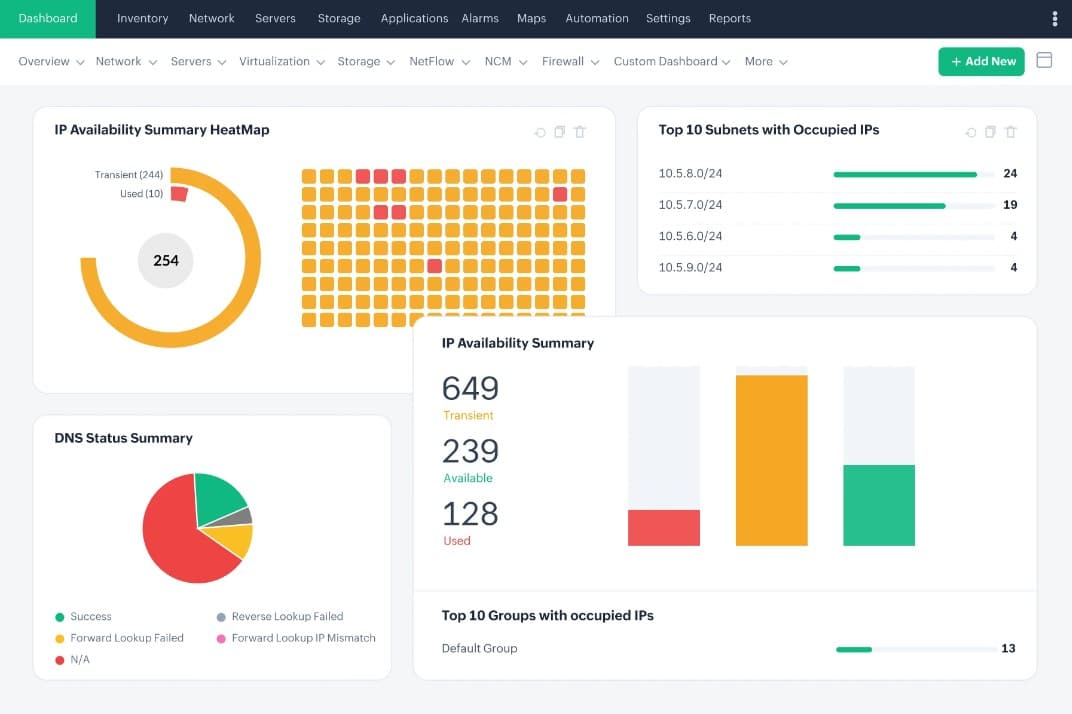
ManageEngine OpManager is a network performance monitor that can monitor devices, servers, virtual resources, and services. It has a range of network fault management capabilities to help detect and resolve performance issues. You can view real-time graphs on CPU utilization, memory utilization, disk utilization, and more.
Key Features:
- Network fault management capabilities.
- Real-time performance graphs.
- Remote process diagnostics.
- Configurable alert system.
Why do we recommend it?
ManageEngine OpManager stands out for its fault management capabilities and real-time monitoring, providing valuable insights into network performance and enabling quick diagnostics.
When you find a performance issue you can use remote process monitoring to run diagnostics. With process diagnostics, you can view the Top 10 processes by CPU and memory utilization, which helps you to diagnose the cause of the problem. You can even terminate problematic processes remotely!
The alert system notifies you the moment a fault is detected by email and SMS. Alerts can also be viewed through mobile apps for Android, iPhone, and iPad. However, if you require more action you can configure the platform to run a script. For example, the platform can automatically restart a service that meets certain trigger conditions.
ManageEngine OpManager is ideal for those users that require a network monitoring tool that can troubleshoot a range of devices and services. ManageEngine OpManager is available for Windows and Linux.
Who is it recommended for?
This tool is best suited for medium to large enterprises requiring a versatile network monitoring solution that can handle diverse devices and services, with a focus on fault management and diagnostics.
Pros:
- Effective network fault management for identifying issues.
- Real-time monitoring with detailed utilization graphs.
- Ability to remotely diagnose and address problems.
- Versatile alert system including email and SMS notifications.
Cons:
- May require a steep learning curve for new users.
You can request pricing information from the company directly. There is also a 30-day free trial.
2. Site24x7 (FREE TRIAL)

Built as a cloud-based monitoring platform, Site24x7 combines network monitoring with analysis features. Its toolkit includes a troubleshooting capability that delivers live diagnostics for network performance. By measuring bandwidth consumption, latency, packet loss, and traffic levels, it helps IT teams identify and fix network-related problems quickly.
Key Features:
- Network discovery
- SNMP-based network device status tracking
- Connection testing tools
Why do we recommend it?
Site24x7 provides detailed insight into network devices such as routers, switches, firewalls, and wireless access points. That visibility makes it easier to determine the source of performance degradation or connectivity issues. When abnormal conditions appear, network administrators are alerted so they can respond before users or business operations are affected.
Troubleshooting is strengthened by detailed diagnostics and analysis of historical data. Built-in tools such as network path analysis, traceroute, and ping tests give teams practical ways to investigate connectivity problems across different parts of the network.
SNMP-based monitoring adds deeper visibility into device health and operating status. The dashboard is structured to bring data from multiple network components into one view, giving teams a quick picture of network health and helping speed up issue resolution. With this platform, businesses can keep network infrastructure running smoothly, reduce downtime, and improve performance across all network layers.
Who is it recommended for?
This service is aimed at IT teams, network administrators, and DevOps professionals that need to monitor, troubleshoot, and optimize network performance. It is especially useful for organizations operating complex network infrastructures, including enterprise networks, cloud environments, and hybrid IT systems, where limiting downtime and maintaining smooth operations are important.
Pros:
- Cloud-hosted system
- Full-stack observability
- Traffic analysis
Cons:
- No on-premises version
Subscription plans include the full set of monitoring and system management services available on the platform. Pricing starts at $9 per month. However, that entry-level deal offers only very limited capacity. Larger organizations need to pay for capacity expansions to obtain a package that better fits the size of their IT environment. Examine Site24x7 by accessing a 30-day free trial.
3. ManageEngine OpManager Nexus (FREE TRIAL)
ManageEngine OpManager Nexus, formerly OpManager Plus, is a network monitoring and management tool that provides deep visibility into your operations. In particular, it analyzes data from your networks and devices to identify potential issues and their root causes. Using this information, you can quickly fix the issues before they impact operations. Its well-designed dashboards and meaningful alerts also speed up troubleshooting.
Key Features:
- Automatic network discovery and mapping.
- Gathers information through WMI, SNMP, and APIs.
- Leverages network path analysis to identify your network’s bottlenecks.
Why do we recommend it?
OpManager Nexus is a good choice for troubleshooting issues in your network, as it can gather data from different sources and analyze them to know the problem and its exact cause. This acts as a good starting point for further investigation. Moreover, it automatically discovers and maps devices to help understand dependencies.
One aspect that stands out for us is its dashboards. All the metrics are analyzed and displayed in a way that’s easy to understand. Furthermore, you can click on any specific metric to get more insights about it. Another notable aspect is its alerts, which are grouped together to avoid fatigue while ensuring that you are notified immediately for critical events.
OpManager Nexus is highly flexible as well. It can monitor any IP-based device, and uses SNMP, WMI, and API to gather information from them. This data is combined with bandwidth and traffic analysis for an accurate picture.
Who is it recommended for?
It is recommended for large organizations and enterprises that have thousands of devices in their networks. It is also a good choice for MSps who are responsible for troubleshooting client environments.
Pros:
- Monitors metrics like packet loss and jitter to identify congestion.
- Highly flexible
- Intuitive dashboards.
Cons:
- Learning curve for some users.
OpManager Nexus offers two plans. The annual subscription of the Professional edition is $1,233 for 50 devices and for the Enterprise edition, it is $19,995 for 1000 devices. Start a 30-day free trial.
4. Paessler PRTG Network Monitor

Paessler PRTG Network Monitor is a network troubleshooting tool that can monitor devices throughout your network in real-time. It combines SNMP monitoring with syslog monitoring to provide you with a diverse monitoring platform. You can monitor everything from nodes to servers, and virtual services.
Key Features:
- Real-time SNMP and syslog monitoring.
- Customizable dashboards and network maps.
- Diverse alert notification options.
Why do we recommend it?
Paessler PRTG Network Monitor is recommended for its versatile real-time monitoring capabilities and user-friendly customization options, making it a powerful tool for comprehensive network analysis and troubleshooting.
With PRTG Network Monitor you can create custom dashboards and network maps. The Map Designer allows you to create a map of your network, which you can use to help during troubleshooting. Looking at your network from a topical perspective can help to make sense of how systems relate to each other.
The tool has an alert system to let you know when to start troubleshooting. For example, if the network is running slower than usual then you will receive an alert notification. Notifications come in the form of emails, SMS messages, push notifications, Slack messages, and more. You can configure your own alert conditions to determine how you receive notifications.
Who is it recommended for?
This tool is especially suitable for IT teams in small to medium-sized businesses looking for a cost-effective, scalable solution to monitor various network components with real-time insights and detailed visualization.
Pros:
- Easy-to-use map designer for effective network visualization.
- Flexible alert system including emails and push notifications.
- Free version available, suitable for small-scale networks.
Cons:
- Paid versions can be costly as network size increases.
PRTG Network Monitor is available for free for 100 sensors or less. Paid versions start at $1,600 (£1,238) for 500 sensors and one server installation. There are also versions with unlimited sensors available. You can download a 30-day free trial.
5. SolarWinds Network Performance Monitor

SolarWinds Network Performance Monitor is a network monitoring tool that can monitor devices, servers, traffic, and more. The software comes with a range of diagnostic features including a Wi-Fi heat map, which allows you to see where connectivity is strongest in your network on a color-coded map.
Key Features:
- Wi-Fi-heat map for connectivity analysis.
- Automatic network element discovery.
- Customizable performance dashboards.
- Advanced automated alert system.
Why do we recommend it?
SolarWinds Network Performance Monitor is recommended for its comprehensive monitoring capabilities and user-friendly interface. Its ability to create a wifi heat-map and automatically discover network elements makes it a highly efficient tool for network troubleshooting.
When using SolarWinds Network Performance monitor you can automatically discover network elements and start troubleshooting for poor performance. You can monitor latency, availability, and performance through the platform.
You can monitor performance through the customizable dashboard with a range of graphs and visualizations you can view. For example, you can view a graph of Network Latency & Packet Loss across your network in a given time period. Controlling what issues you look for allows you to monitor for problems specific to your environment.
An automated alert system keeps you updated on changes to your environment when they occur. You can configure alert thresholds and receive alerts when they are exceeded. For example, if the CPU of a device crosses a certain level then the tool will notify you by email or SMS. The alerts themselves contain additional information that allows you to follow up easily.
SolarWinds Network Performance Monitor is a reliable network-wide troubleshooting tool. You can use it to find issues in your environment wherever they may be.
Who is it recommended for?
This tool is ideal for network administrators and IT professionals who need a robust solution for monitoring and diagnosing a wide range of network issues, from device performance to traffic analysis.
Pros:
- Intuitive Wi-Fi heat map for easy connectivity visualization.
- Automated discovery simplifies network monitoring setup.
- Customizable dashboards provide tailored monitoring views.
- Efficient alert system for timely notifications and responses.
- Broad monitoring capabilities covering devices, servers, and traffic.
Cons:
- Price point may be high for small businesses.
SolarWinds Network Performance Monitor starts at a price of $2,995 (£2,275). You can download the 30-day free trial.
6. Obkio

Obkio is a cloud-hosted network performance monitoring system that supports troubleshooting with network diagnosis options. The system operates through locally-installed data collection agents. These gather network performance metrics such as latency, jitter, packet loss, and bandwidth usage. Obkio’s diagnostic tools are based on Traceroute and Ping.
Key Features:
- Local Data Collection Agents: The user chooses where to install agents.
- Network Quality Monitoring: Tracks latency, jitter, and packet loss.
- Hybrid Monitoring: Options to monitor LAN, cloud, and external network paths.
- VoIP Connection Quality Tracking: Calculates the Mean Opinion Score to assess call quality.
- Network Device Status Monitoring: Uses SNMP to detect potential equipment failures.
Why do we recommend it?
Obkio is recommended because it implements automated network monitoring and also provides diagnostic tools. The system also gathers SNMP data from devices, which can illuminate the causes of traffic delivery irregularities. Tools include path analysis for visibility into network performance between two given points on the network and it can also span across the internet to record traffic behavior.
Obkio’s network troubleshooting system is particularly designed to examine the delivery of interactive application traffic, such as VoIP and video conferencing. The tool will calculate the Mean Opinion Score by collecting data on latency, packet loss, and jitter. The measures traffic between two data collection agents and the user decides where to place them.
Automated alerting within the package can be triggered by a test against each incoming value of a specific metric. The system can be set up to forward alerts as notifications by email, Slack, Teams, and Pagerduty. The package stores metrics so that they can be used later for historical analysis. This is useful for troubleshooting and for capacity planning.
Who is it recommended for?
Obkio is recommended for any type of business that runs a network but it is particularly suitable for those that use cloud services or operate multiple sites. The system can be used to support virtual networks, such as SD-WAN or SASE configurations. Networks that carry traffic for VoIP or other interactive applications.
Pros:
- Path Analysis: Uses Ping and Traceroute to test a specific path.
- Performance Alerts: These can be forwarded to technicians by email, Pagerduty, Teams, and Slack.
- Historical Data Analysis: Provides analysis from stored statistics for troubleshooting and capacity planning.
- Great Data Visualizations: The console presents performance data through clear graphs and charts.
- Cloud Hosted: Delivered as a cloud-based service, removing the need for installation or ongoing maintenance.
Cons:
- No Network Management Tools: Focused on network monitoring.
Obkio has four plan levels with the cheapest starting at a price of $199 per month. So, this system is probably a little too pricey for small businesses. You can experience the Premium Edition with a 14-day free trial.
7. ping

Ping is a command-line driven, network monitoring tool for Windows that network administrators use to assess the connection of other computers. The tool sends Internet Control Message Protocol (ICMP) echo Request messages. If you send a request but the recipient doesn’t return a packet then there is a fault.
Key Features:
- Command-line interface.
- Round-trip time measurement.
- Network connectivity testing.
- Simple and direct functionality.
Why do we recommend it?
Ping is a fundamental, straightforward tool recommended for its reliability in testing network connectivity and measuring the performance of network connections through round-trip time.
In addition, Ping provides you with more performance details. For example, the tool measures round-trip time so you can measure the performance of the connection. If a host or device takes a long time to respond to a request then the performance has been impaired and should be investigated. You can also view the number of hops between two points.
Ping is a reliable troubleshooting tool for users who want an affordable monitoring tool to test connectivity between computers. While it’s not a complete network monitoring platform the utility is good for seeing if computers are up.
Who is it recommended for?
This tool is ideal for network administrators and IT professionals who need a basic, no-cost option for quickly assessing network connectivity and performance between computers.
Pros:
- Highly reliable for basic connectivity testing.
- Useful for measuring connection performance.
- Simple, user-friendly command-line interface.
Cons:
- Limited in functionality beyond basic tests.
The tool is also completely free. You can download Ping from here.
8. tracert (traceroute)

Tracert or Traceroute is a Windows-based utility that monitors the path packets take across a network to the destination. With Tracert, you can not only identify performance issues like latency and packet loss but also troubleshoot for problems in the route.
Key Features:
- Path tracking for packets.
- Latency and packet loss identification.
- ICMP packet utilization.
- Default availability in Windows.
Why do we recommend it?
Tracert is recommended for its ability to track the path of packets across a network, helping to identify issues related to latency and packet loss, which are crucial for network troubleshooting.
The user sends ICMP packets to request responses from devices in the network. Through the command line, the user can monitor the path a packet takes to reach the destination. The user can then monitor how much delay there is at each hop. The round-trip-time tells you how long it took for a packet to travel from sender to recipient.
The Tracertutility is ideal for troubleshooting to find out where connection issues are originated in a network. The difference between Tracert and Traceroute is that the former is for Windows machines and the latter is for Linux based machines. Tracertis available by default on Windows operating systems.
Who is it recommended for?
Tracert is best suited for network technicians and system administrators who require a straightforward, built-in tool to diagnose route-related network problems and understand network path dynamics.
Pros:
- Effective for tracing packet routes.
- Identifies latency and packet loss issues.
- Easily accessible in Windows environments.
Cons:
- Limited to route tracing, lacking broader network diagnostics.
9. Wireshark

Wireshark is a network analyzer that can be used to monitor network traffic in real-time. Wireshark is a traffic analysis tool that can capture network packets, enabling you to troubleshoot for performance issues like latency, and packet loss.
Key Features:
- Real-time network traffic analysis.
- Packet capture and filtering.
- Encrypted traffic analysis.
- Open-source software.
Why do we recommend it?
Wireshark is highly recommended for its in-depth analysis capabilities, allowing users to capture and examine the fine details of network traffic, including encrypted communications, making it invaluable for detailed network troubleshooting and security analysis.
Monitoring network traffic can also help you to detect cyber attacks. For example, you could discover a traffic spike, a common indicator of a DDoS attack that warrants further investigation. Wireshark can even analyze encrypted TLS traffic that many attackers try to use to slip under the radar.
Capture and display filters help you to navigate the traffic and discover the root cause behind performance issues. For example, you can use Wireshark filters to only display ICMP traffic or only show LAN traffic. Filters are useful for troubleshooting because they let you take a microscope to look for the cause of specific issues.
Who is it recommended for?
Wireshark is ideal for network engineers, security analysts, and IT professionals who require a comprehensive tool for deep network analysis, especially useful in complex environments where detailed traffic inspection is necessary.
Pros:
- Detailed analysis of network packets for thorough diagnostics.
- Support for encrypted TLS traffic analysis.
- Free and open-source, with broad platform compatibility.
Cons:
- Can be complex for beginners to navigate and interpret.
Not only is it easy to use but it’s open-source and available for free. Wireshark is available for Windows, Linux, Mac OS, Solaris, FreeBSD, NetBSD, and more. You can download the program here.
10. nmap

nmap, also known as Network Mapper, is an open-source ping and vulnerability scanner available for Windows and Unix. Administrators often use nmap to find open ports. The tool sends packets to systems in the network and then awaits a response from the recipient. The recipient responds and provides an IP address with additional information. Nmap uses this information to determine whether the ports are open, closed, or filtered.
Key Features:
- Open-source network scanning.
- Port and vulnerability scanning.
- Network mapping and OS detection.
- Command-line and GUI versions.
Why do we recommend it?
Nmap is recommended for its versatility in network scanning, port analysis, and vulnerability detection, making it a crucial tool for network security assessments and infrastructure mapping.
The capabilities of nmap are vast, and the tool can also be used for network mapping and OS detection. For example, the tool can discover hosts and detect the operating system running on the device. The user can view information including the manufacturer of the device, the version of the OS, and uptime.
Nmap is a vulnerability scanner that still holds its own in modern network monitoring (although it may be showing its age!) Nmapis available as a command-line interface but it’s also available as a graphical user interface called Zenmap.
Pros:
- Comprehensive scanning capabilities for network exploration.
- Effective in identifying open ports and potential vulnerabilities.
- Useful for operating system and service version detection.
Cons:
- May require advanced knowledge to utilize its full potential.
You can download the software for free.
11. ipconfig/ifconfig
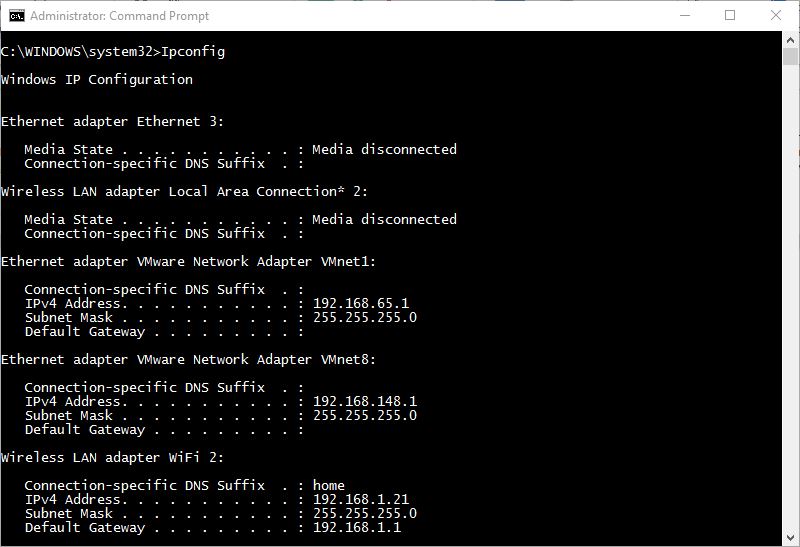
Ipconfig is a command-line tool that allows you to view information on the IP address, subnet mask, MAC address, and default gateway of network adapters. The ipconfig command’s main value lies in its ability to check your computer’s IP configuration and to update your settings if there is a problem. However, you can also use Ifconfig to refresh the Dynamic Host Configuration Protocol (DHCP) and Domain Name System (DNS) settings.
Key Features:
- IP configuration management.
- Network adapter details display.
- DHCP and DNS settings refresh.
- Built-in in Windows/Linux.
Why do we recommend it?
Ipconfig/Ifconfig is recommended for its straightforward functionality in managing and diagnosing IP configurations, which is fundamental for network troubleshooting, especially in identifying and resolving connectivity issues.
The ipconfig command is still a useful troubleshooting command because it allows you to view and update network addresses. Ipconfig is available for free on Windows and ifconfig usually comes pre-packaged in most Linux distros. You can use the tool by going through the Windows command prompt.
Who is it recommended for?
This tool is essential for IT professionals, system administrators, and anyone needing to quickly check or update their network adapter’s IP configuration, especially useful in troubleshooting connectivity problems.
Pros:
- Simple and effective for managing IP configurations.
- Facilitates refreshing DHCP and DNS settings.
- Readily available on Windows and most Linux distributions.
Cons:
- Limited to IP configuration tasks, lacking broader network diagnostics.
Network Troubleshooting Tools: Find the Root Cause of Your Network Problems!
Network troubleshooting tools are valuable because they enable you to resolve performance issues quickly. If a network device or application starts to run slowly it’s very useful to be able to hop on a monitoring platform and start searching for the root-cause. Tools with root-cause analysis help to point you towards the cause and lower your mean time to resolution.
Proprietary network monitoring tools like ManageEngine OpManager, Paessler PRTG Network Monitor, and are worth a look on account of versatility. All of these network troubleshooting tools can be used to monitor services ranging from devices to applications and servers.


