Tired of writing clunky SQL queries? Then a query optimization tool might be the solution you’re looking for. Query optimization tools offer features such as deadlock analysis, recommendations, and visual query builders, to help the user improve database performance. In this article, we’re going to look at the 7 best SQL and query optimization tools.
Here is our list of the best SQL and query optimization tools:
- Paessler PRTG Network Monitor EDITOR’S CHOICE Can monitor Microsoft SQL, MySQL, Oracle SQL, and PostgreSQL databases. Includes SQL monitoring sensors and a threshold-based alerts system. Start a 30-day free trial.
- Redgate SQL Monitor Online SQL server monitoring tool with a Top 10 Queries view and over 55 customizable alerts. It also includes custom reporting.
- Idera DB Optimizer Database optimizer that provides coding recommendations. Compatible with SQL Server, Oracle, DB2, and Sybase.
- SolarWinds Database Performance Analyzer Database monitoring tool that monitors SQL Server, Oracle, DB2, and SAP ASE. Additional features like Top SQL statements and blocking analysis help you to resolve performance issues.
- SentryOne SQL Sentry SQL server monitoring tool that is ideal for troubleshooting performance issues. Features like the Top SQL view, execution plan diagrams, and deadlock analysis allow you to find performance problems quickly.
- DbForge Studio for MySQL Database development software with intelligent code completion and formatting. Includes a query profiler and report designer.
- Toad for Oracle SQL optimizer that provides automatic coding recommendations. It comes with team coding features and query performance monitoring.
The best SQL and query optimization tools
1. Paessler PRTG Network Monitor (FREE TRIAL)

Paessler PRTG Network Monitor is a free network and database monitoring software that can monitor Microsoft SQL, Oracle SQL, MySQL, and PostgreSQL databases. With PRTG Network Monitor you can measure the performance of SQL databases and how long it takes to execute a query.
Why do we recommend it?
Paessler PRTG Network Monitor stands out as an exceptional network and database monitoring software that goes beyond traditional network monitoring to include support for databases like Microsoft SQL, Oracle SQL, MySQL, and PostgreSQL. With the Microsoft SQL v2 Sensor, users can precisely monitor SQL servers and execute predefined queries, providing crucial insights into query execution times, addressed rows, and overall performance metrics. The availability of similar sensors for various databases enhances its versatility.
Who is it recommended for?
PRTG Network Monitor is strongly recommended for enterprises seeking a comprehensive solution to monitor both databases and general network devices. Its unified approach to network and database monitoring makes it an ideal choice for organizations that prioritize a holistic overview of their IT infrastructure. The freeware version’s support for up to 100 devices makes it particularly suitable for smaller to mid-sized enterprises looking for robust monitoring capabilities without a significant financial commitment.
You can use the Microsoft SQL v2 Sensor to monitor a Microsoft SQL server and execute a defined query. The sensor displays the execution time of the request, execution time of the query, the number of rows addressed by the query, and more. The sensor allows you to measure the basic performance of queries. There are other similar sensors available for other databases.
The software is available as a web, desktop or mobile app for iOS and Android. The mobile app is worth having because you can configure push notifications to tell you when performance conditions change. Alerts that are threshold-based can also be sent by email, SMS, Slack message, and more.
PRTG Network Monitor is a good fit for enterprises searching to monitor databases and general network devices through one unified solution. The freeware version supports up to 100 devices. You can then upgrade to a paid version starting at $1,600 (£1,207) for five sensors and one server installation. You can download a 30-day free trial.
2. Redgate SQL Monitor
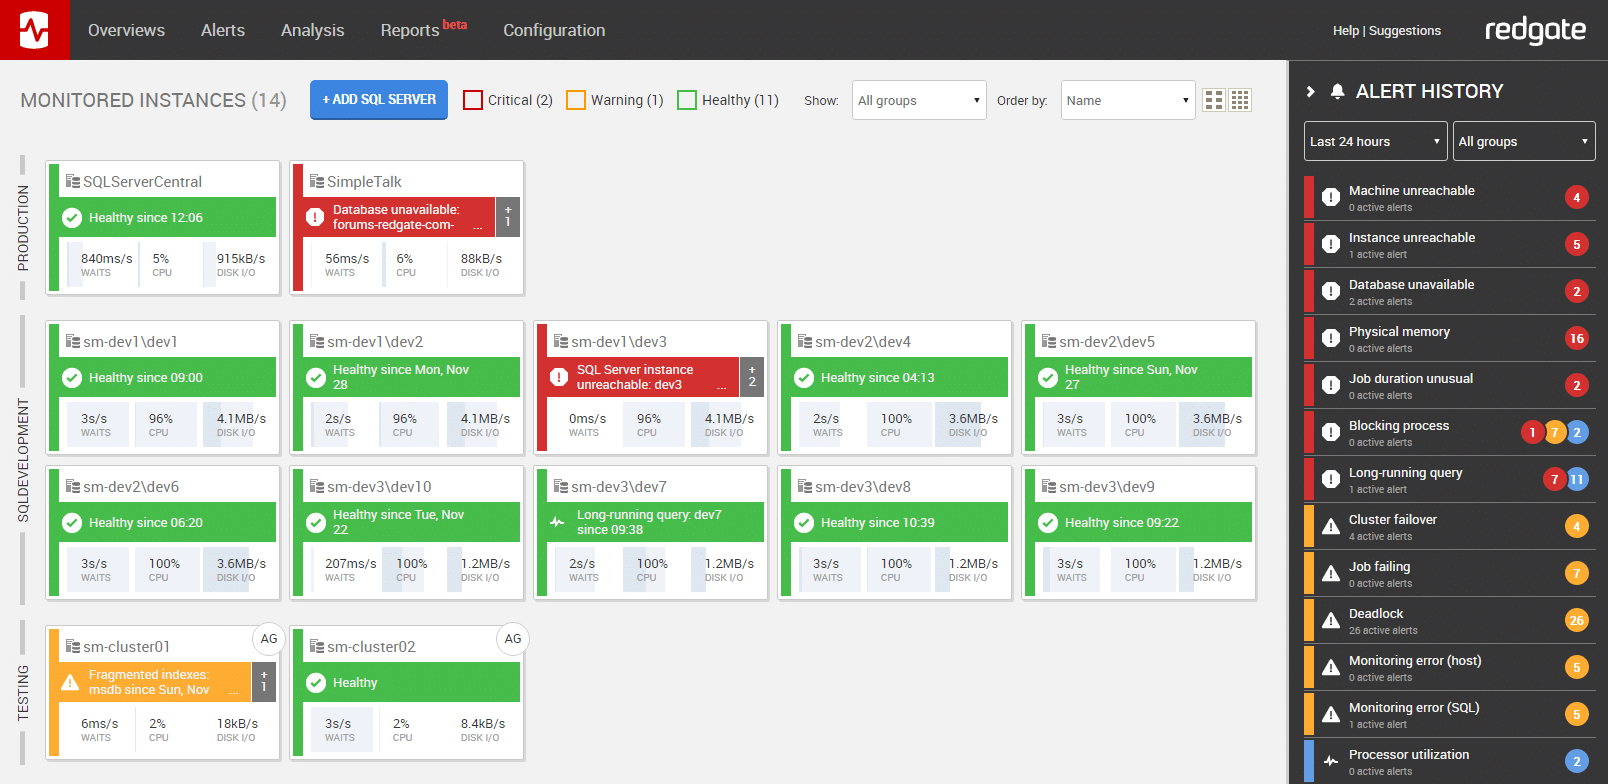
Redgate SQL Monitor is a web-based SQL Server monitoring tool that can be used to detect performance and resolve performance issues. RedGate SQL Monitor shows you SQL server instances, groups, clusters and virtual machines all in one place. View details on query performance by going to the Top 10 Queries view.
Why do we recommend it?
Redgate SQL Monitor stands out as a powerful web-based SQL Server monitoring tool that excels in performance detection and issue resolution. Its consolidated view of SQL server instances, groups, clusters, and virtual machines simplifies management. The Top 10 Queries view provides detailed insights into query performance, enabling administrators to prioritize optimization efforts effectively.
Who is it recommended for?
Redgate SQL Monitor is recommended for businesses seeking a robust and user-friendly SQL Server monitoring solution. Its extensive set of over 55 customizable alerts, responsive to specific events like long-running queries, ensures that administrators stay informed about critical issues promptly. The tool’s flexibility in notification methods, including email, Slack, PagerDuty, or SNMP traps, caters to diverse communication preferences. Additionally, the reporting feature makes it an excellent choice for organizations prioritizing long-term performance optimization and data sharing within teams.
There are over 55 customizable alerts included with the Redgate SQL monitor that respond to certain events. For example, you will receive an alert if there is a long-running query. Notifications can be sent through email, Slack, PagerDuty or SNMP traps. The alerts are color-coded so you know which ones to respond to first.
For more long-term performance optimization you can use the reporting feature. Create custom reports to share database performance data with your team. For example, you can display a list of longest-running queries to show who the worst offenders are.
RedGate SQL Monitor can be purchased as a standalone version or as part of SQL Toolbelt. The standalone version of SQL Monitor costs $1,565 (£1,115) for a single-user license. SQL Toolbelt includes 14 tools and costs $3,495 (£2,495) for a single user license. There is a discount of 15% for five licenses or more. You can download the 14-day free trial from this link here.
3. Idera DB Optimizer

Idera DB Optimizer is an SQL tuner that’s designed to improve the performance of SQL code for SQL Server, Oracle, DB2, and Sybase databases. Idera DB Optimizer has a SQL tuning wizard that provides recommendations on how to optimize poor code.
Why do we recommend it?
Idera DB Optimizer earns its recommendation as a top SQL tuner by providing an effective solution for enhancing the performance of SQL code across various databases, including SQL Server, Oracle, DB2, and Sybase. The SQL tuning wizard, a standout feature, offers valuable recommendations for optimizing suboptimal code. Additionally, the Visual SQL Tuning (VST) diagrams feature transforms SQL code into visual representations, facilitating a clearer understanding of queries’ impact on the database by displaying elements like indexes, constraints, and joins.
Who is it recommended for?
Idera DB Optimizer is highly recommended for organizations seeking a comprehensive SQL and query optimization tool that supports SQL Server, Oracle, DB2, and Sybase databases. The tool’s SQL tuning wizard, coupled with the ability to visualize SQL code through diagrams, makes it suitable for database administrators and developers aiming to improve code efficiency. Idera DB Optimizer’s affordability also positions it as an excellent choice for smaller enterprises looking for robust optimization capabilities without a hefty price tag.
With Visual SQL Tuning (VST) diagrams you can turn SQL code into diagrams. Viewing your SQL code as diagrams makes it easier to see the effect queries have on your database. Diagrams display elements such as indexes, constraints, and joins. This feature is great for editing SQL queries while having more context.
To help you to make code improvements while minimizing disruption, Idera DB Optimizer allows you to test SQL queries in a simulation before production. Running queries in a simulated environment allows you to see if there are any performance issues before you deploy them, minimizing the risk of negative repercussions for your database!
Idera DB Optimizer is one of the top SQL & query optimization tools with a low price tag, making it suitable for smaller enterprises. Idera DB Optimizer starts at $572.00 (£431.60) per user. You can register for the 14-day free trial.
4. SolarWinds Database Performance Analyzer
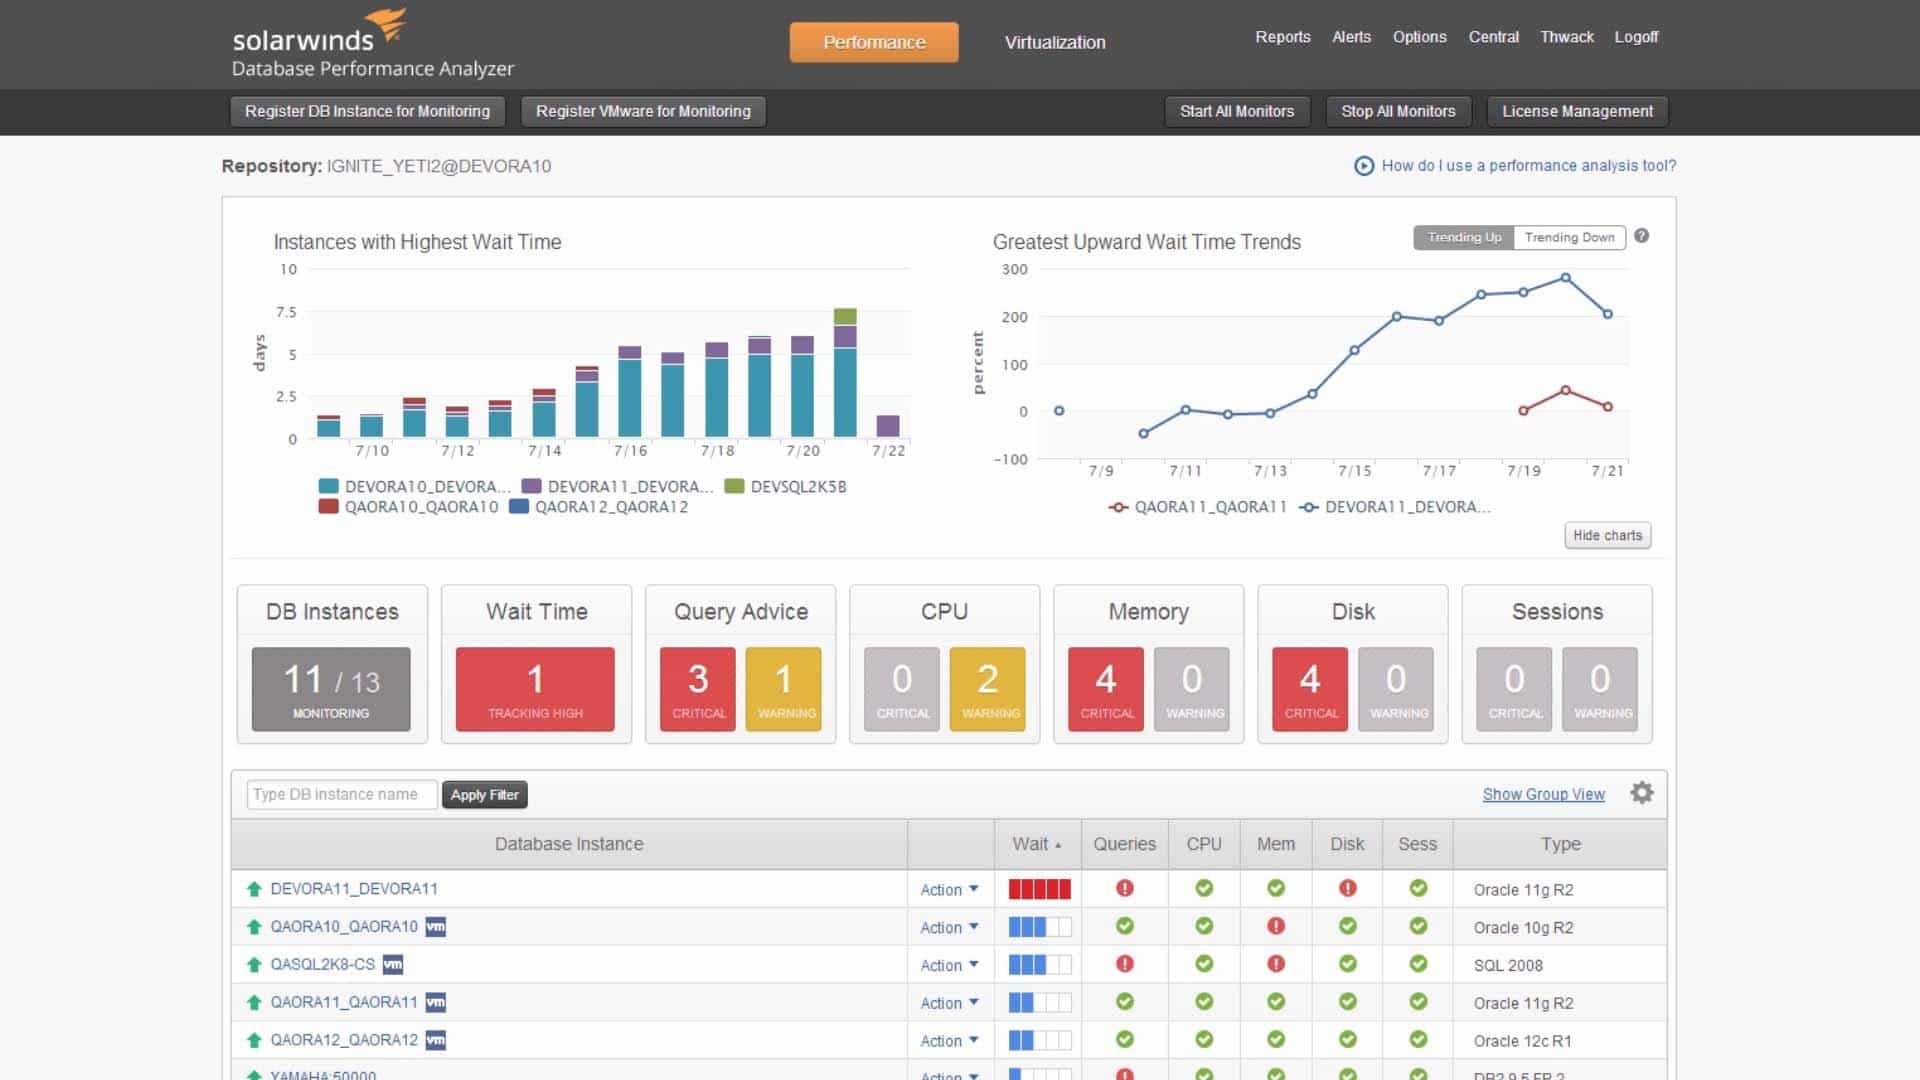
SolarWinds Database Performance Analyzer is a database monitoring tool that can monitor SQL Server, Oracle, DB2, and SAP ASE. With SolarWinds Database Performance Analyzer you can monitor information on your database including CPU, memory, and disk status. When monitoring through the dashboard you can view how queries perform in production.
Why do we recommend it?
The tool stands out with its user-friendly dashboard that provides comprehensive insights into CPU, memory, and disk status. SolarWinds DBA earns our recommendation for its robust database monitoring capabilities across SQL Server, Oracle, DB2, and SAP ASE. The performance optimization features, including Top SQL statements analysis and blocking hierarchy visualization, empower administrators to identify and prioritize SQL queries for resolution. The tool’s ability to provide real-time performance metrics and in-depth analysis makes it a valuable asset for enhancing database performance.
The performance optimization features of the SolarWinds Database Performance Analyzer are diverse. The user can view graphs on the Top SQL statements to measure response time and see how hardware resources are being consumed. Viewing the top SQL statements enables an administrator to know what SQL queries need prioritizing for fixing.
There is also a blocking analysis feature, which helps to highlight the blocking hierarchy that’s behind poor performance. Seeing the blocking hierarchy helps you to see the offending queries so you know what to fix first. Eliminating blocks stops resources from being caught in the crossfire.
Who is it recommended for?
SolarWinds Database Performance Analyzer is recommended for enterprises seeking a straightforward yet powerful solution for monitoring SQL databases and optimizing query performance. IT professionals and database administrators will find this tool particularly beneficial for its user-friendly interface and diverse performance metrics. The ability to identify and address performance bottlenecks efficiently makes it suitable for organizations aiming to ensure the optimal functioning of their databases in real-time.
SolarWinds Database Performance Analyzer is a good fit for enterprises looking for a simple tool that can monitor SQL databases and query performance. SolarWinds Database Performance Analyzer starts at $2,045 (£1,550). You can download the 14-day free trial.
5. SentryOne SQL Sentry

SentryOne SQL Sentry is a SQL server monitoring tool that allows you to monitor performance and identify problems within your database. The user can go to the Top SQL view and view execution plan diagrams to discover poorly optimized queries affecting the database.
Why do we recommend it?
SentryOne SQL Sentry stands out as a top recommendation for SQL server monitoring due to its robust performance monitoring capabilities and effective problem identification features. The tool excels in providing a comprehensive overview of database performance, allowing users to navigate the Top SQL view and analyze execution plan diagrams to pinpoint poorly optimized queries impacting the database. Notably, its deadlock analysis feature offers a visual representation of deadlocks, aiding quick diagnostics and enabling users to view statements executed during deadlock occurrences for prompt resolution.
Who is it recommended for?
SentryOne SQL Sentry is recommended for users in search of a SQL server monitoring tool with advanced capabilities for performance analysis and problem resolution. The tool’s user-friendly interface, coupled with features like deadlock analysis and automated responses to poorly performing queries, makes it ideal for both IT professionals and database administrators. Organizations looking for a solution that simplifies database monitoring with effective automated responses will find SentryOne SQL Sentry to be a valuable asset.
For faster diagnostics, SentryOne SQL Sentry has deadlock analysis. The deadlocks tab displays an overview of database deadlocks and deadlock diagrams show the processes and resources contributing to the block. You can view the statements that were executed when the deadlock was detected so you can take action to resolve the issue.
To aid the remediation of poorly performing queries, SentryOne SQL Sentry offers a mixture of alerts and automated responses. You can create custom notifications to let you know when SQL queries are running slowly. You can also configure the platform to automatically respond to the problem by executing a command.
SentryOne SQL Sentry is ideal for users that want a database monitoring tool with automated responses that’s easy to use. The SQL Sentry license starts at $2,495 (£1,882) + $499 (£376.48) per year per server instance. You can download the 14-day free trial.
6. dbForge Studio for MySQL
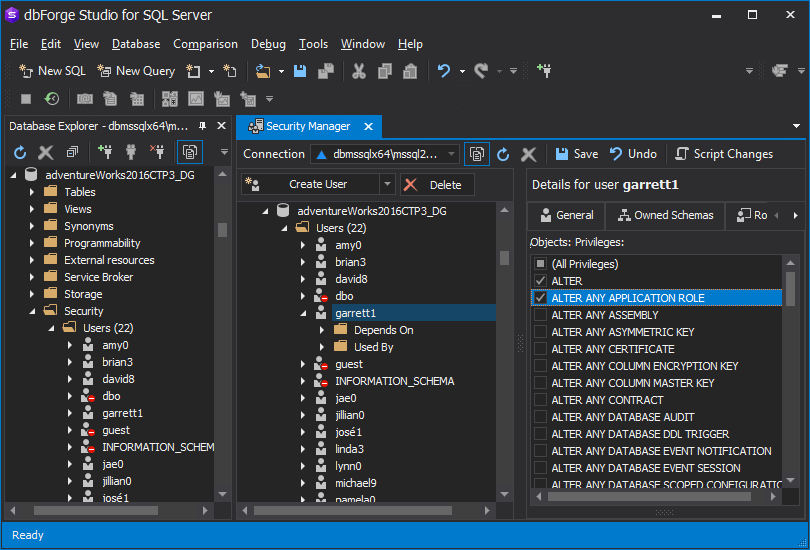
dbForge Studio for MySQL is a database development tool that can be used for SQL code creation and optimization. The platform is ideal for writing code due to its intelligent code completion and formatting. For those who want a more interactive experience, there is a visual query builder that allows you to draw your queries. You can drag-and-drop tables into a diagram and organize them as needed.
Why do we recommend it?
dbForge Studio for MySQL stands out as a comprehensive database development tool, offering advanced features for SQL code creation and optimization. Its intelligent code completion and formatting capabilities enhance the efficiency of code writing. The visual query builder provides an interactive experience, allowing users to draw and organize queries with ease. The query profiler is a valuable asset for addressing performance concerns, offering insights into query profiles, text, and STATUS variables, facilitating effective performance improvement.
Who is it recommended for?
dbForge Studio for MySQL is recommended for developers and database administrators seeking a powerful tool for MySQL database development. Its intuitive features, including visual query building and interactive code creation, make it suitable for users who prefer a flexible and efficient development environment. The query profiler’s detailed insights into query executions are beneficial for those focused on optimizing database performance. The availability of customizable data reporting and export options further enhances collaboration within development teams. With three versions—Standard, Professional, and Enterprise—it caters to varying user needs and preferences.
When you need to address performance concerns, you can use the query profiler. With the query profiler, you can view SQL query profiles and query text. You can also compare the STATUSvariables of queries before and after execution. You can compare query executions so you can verify that your changes are improving performance.
Data reporting allows you to feedback performance issues to your team. Reports can be customized with unique layouts in the Report Designer. For more of a visual touch, you can use the Chart Designer to add a chart to your report. Once you’re finished you can export your report in a variety of formats including PDF, HTML, CSV, XLS, TEXT, and more.
There are three versions of dbForge Studio for MySQL available to purchase; Standard, Professional, and Enterprise. The Standard version starts at $149.95 (£113). with the visual query builder and query profiler.
The Professional version costs $299.95 (£226) and includes additional features like schema comparison and synchronization. The Enterprise version costs $399.95 (£301) and includes a data generator. You can download the 30-day free trial from this link here.
7. Toad for Oracle

Toad for Oracle is an SQL optimizer developed specifically for Oracle databases. Toad for Oracle uses an algorithm that finds alternative ways to improve written SQL statements. Automatic recommendations provide you with support so you can choose the best alternative to your original statement.
Why do we recommend it?
Toad for Oracle stands out as an SQL optimizer designed specifically for Oracle databases. Its algorithm explores alternative approaches to enhance SQL statements, providing automatic recommendations for users to choose the most effective alternatives. The profiler feature offers a comprehensive view of query performance, allowing users to measure PL/SQL code execution time and identify potential bottlenecks through graphical representations.
Who is it recommended for?
Toad for Oracle is recommended for database developers and administrators working with Oracle databases, particularly those seeking to maximize query performance. The SQL optimization features, coupled with automatic recommendations, make it a valuable tool for enhancing SQL statements efficiently. The profiler is beneficial for users focused on identifying and addressing performance issues, offering insights through graphical representations. The team coding features cater to collaborative environments, enabling seamless collaboration among developers and facilitating source control integration. If optimizing Oracle database queries is a priority, Toad for Oracle is worth evaluating.
To measure query performance, you can use the profiler. The Profiler allows you to measure the execution time of PL/SQL code and view the results as a graph. The graph shows you if there are issues you need to be aware of, such as bottlenecks that consume resources.
The team coding features are particularly useful in collaborative environments with lots of developers. A team of users can access schema objects, make changes to SQL code, and match them with the PL/SQL code files in the source control. Team coding delivers a much smoother developing experience.
Toad for Oracle is worth evaluating if you want to maximize query performance for an Oracle database. There are a number of versions of Toad for Oracle available for purchase. Packages range from $1,023.75 (£933.60) for the Base Edition to $5,925 (£5,836) for the DBA edition. You can start the 30-day free trial from this link here.
SQL & Query Optimization Tools: Take Your Database to the Next Level
Writing solid SQL code takes time, but the right SQL & query optimization tools can help you to work much more efficiently. Knowing what SQL statements to focus on rewriting and having software provide you with recommendations can help you to increase your work rate and make your database run faster.
We’ve included a range of tools on this list. The range starts with database performance monitoring tools like SolarWinds Database Performance Analyzer that can help diagnose performance issues. It includes tools such as Idera DB Optimizer that improve the code creation experience through features like tuning wizards and tuning diagrams.