Zabbix is a popular network monitoring tool, but it’s not the only option for network monitoring on the market. There are many other compelling network monitoring tools and Zabbix alternatives that you can use to protect and manage the performance of your systems. In this article, we’re going to look at the best Zabbix alternatives.
Here is our list of the best Zabbix Alternatives:
- ManageEngine OpManager EDITOR’S CHOICE Network monitoring software custom dashboards, automated network discovery, network mapping, alerts, and more. Start a 30-day free trial.
- Site24x7 (FREE TRIAL) As a cloud-delivered monitoring platform, Site24x7 provides full-stack observability that broadly matches Zabbix in core coverage, while also adding Web application monitoring that Zabbix does not offer. Get a 30-day free trial.
- Paessler PRTG Network Monitor (FREE TRIAL) Network monitoring software with a customizable dashboard, network mapping, alerts, reports, and more. Get a 30-day free trial.
- ManageEngine OpManager Nexus (FREE TRIAL) An ITOps management and observability tool that correlates data from different sources and systems to provide deep insights into your system’s performance. Download a 30-day free trial.
- SolarWinds Network Performance Monitor Network monitoring software with SNMP monitoring, autodiscovery, network maps, alerts, reports, and more.
- Nagios XI Network monitoring software with web-based user interface with a custom dashboard, configuration wizards, user management, alerts, and more.
- Datadog Network monitoring platform with 600+ integrations, custom dashboards, alerts, Full API access, and more.
- Dynatrace Infrastructure and application performance monitoring software with network discovery, anomaly detection, and more.
- AppDynamics Application performance monitoring software with real-time monitoring, anomaly detection, dependency mapping, and more.
- Logic Monitor Cloud-based infrastructure monitoring software with a custom dashboard, 2000+ integrations, autodiscovery, dependency mapping, AI-based anomaly detection, and more
- Sumo Logic Sumo Logic – Log and cloud monitoring tool with 150+ integrations, real-time analytics, alerts, machine learning, and more.
- Icinga 2 Open source network monitoring software with network availability monitoring, reports, plugins, user access control, and more.
Our comparison will contain a mixture of tools for Windows, Mac OS, and Linux, prioritizing tools with autodiscovery features, customizable dashboards, configurable and alerts, that allow you to build a monitoring environment that highlights the metrics that are most relevant to your systems.
The Best Zabbix Alternatives
1. ManageEngine OpManager (FREE TRIAL)

ManageEngine OpManager is a network monitor that provides real-time network, server, and virtualization monitoring. With ManageEngine OpManager you can create customizable dashboards to monitor your environment, with over 200 performance widgets. There is also a network mapping feature that automatically creates network maps displaying how your devices connect together.
Key Features:
- Customizable dashboard
- Autodiscovery
- Network mapping
- Email and SMS alerts
- Alarm escalation rules
The software is easy to configure and comes with an automated network discovery tool. The network discovery tool enables you to schedule network discovery so that the platform periodically discovers new devices. You can also use the Discovery Rule Engine to create rules to dictate the post-discovery actions that will be taken, for instance, adding a newly found device to a network map.
Email and SMS Alerts keep you notified about changes to your environment. You can configure alerts with threshold-based trigger conditions so that you receive alerts when a device’s metrics go above or below a certain point. You can also set alarm escalation rules so that after an hour unaddressed alerts are reported to an individual to review.
ManageEngine OpManager is a compelling offering for organizations that are looking for a tool to monitor physical and virtual resources cost-effectively. Prices start at $245 (£172) for 10 devices. Available on Windows and Linux. You can download a 30-day free trial.
EDITOR'S CHOICE
ManageEngine OpManager is our first choice among Zabbix alternatives, combining broad monitoring capability with a more streamlined deployment and management model. It suits both smaller environments and large enterprise networks, without the operational overhead often associated with open-source platforms. While Zabbix is known for its flexibility, OpManager delivers comparable coverage with less configuration effort, supporting teams that need effective monitoring without ongoing tuning and maintenance. A key strength is the depth of functionality available out of the box. OpManager includes real-time network monitoring, fault detection, configuration management, and proactive alerting as standard, reducing the need for extensive setup. Its interface and workflow are straightforward, which shortens the learning curve and helps teams become productive quickly. Customizable dashboards and reports provide clear visibility into device health and performance, enabling IT teams to address issues before they affect users. The platform integrates natively with a wide range of infrastructure, including routers, switches, firewalls, and servers, and supports multi-vendor environments. This breadth, combined with flexible configuration options, allows it to adapt to different network structures and scale as requirements change. By reducing operational overhead while maintaining detailed insight and control, OpManager stands out as the leading choice when evaluating alternatives to Zabbix.
Download: Get a 30-day FREE Trial
Official Site: https://www.manageengine.com/network-monitoring/download.html
OS: Windows Server, Linux, AWS, and Azure
2. Site24x7 (FREE TRIAL)

Site24x7 monitors networks, servers, and applications, so its core scope is comparable to Zabbix. It also extends beyond Zabbix by including additional capabilities such as log management and Web asset monitoring. The platform automatically discovers hardware assets, builds an inventory from them, and, like Zabbix, creates a network map.
Key Features:
- Website monitoring
- Server monitoring
- Network monitoring
- Application performance monitoring (APM)
Site24x7 is built to maintain the health and performance of IT infrastructure. Its monitoring reaches across websites, servers, networks, applications, cloud resources, containers, and end-user activity, which makes it a single platform for a wide range of IT monitoring requirements. Real-time monitoring, customizable alerts, AI-powered insights, and integration with multiple tools and services help teams identify and resolve issues proactively.
The platform stands as a serious competitor to Zabbix, especially for organizations that want a monitoring system that is both integrated and easier to use. Zabbix is widely recognized for flexibility and extensive customization, whereas Site24x7 presents a more streamlined and intuitive interface that can simplify both initial setup and ongoing administration. Within one platform, users can monitor websites, servers, networks, applications, and cloud services together.
Its AI-powered insights and automated incident remediation add further value by helping IT teams respond to issues before they escalate and keep performance on track. Site24x7 also connects with a variety of third-party services and tools, which helps create a more unified monitoring ecosystem and reduces some of the complexity that often comes with managing multiple monitoring solutions. Customizable dashboards and real-time alerts further support informed, data-driven decision-making. Get a 30-day free trial.
3. Paessler PRTG Network Monitor (FREE TRIAL)

Paessler PRTG Network Monitor is a network monitoring software with network, SNMP, server, cloud, and application monitoring. With Paessler PRTG Network Monitor you can monitor your network through a customizable real-time dashboard or with a network map. The platform’s map designer enables you to design maps with over 300 different map objects that you can then share with others with a URL link.
Key Features:
- SNMP monitoring
- Application monitoring
- Cloud monitoring
- Network map
- Custom alerts
- Reports
You can create reports to check-up on specific segments of your infrastructure and export the findings as a PDF, HTML, XML, or CSV file. Run reports on-demand or set a schedule for reports to be released periodically.
The platform also comes with a highly configurable alerts system. You can set trigger conditions to notify you when the status of a sensor changes or when the value of a sensor breaches a certain threshold. Alerts are available via email, push notification (Android and iOS), Slack message, Syslog message, Microsoft teams message, and more. There is also a PRTG API that you can use to create your own integrations.
Paessler PRTG Network Monitor is one of the most affordable and formidable Zabbix alternatives on the market. Prices start at $1,750 (£1,233) per server. There is also a free version that allows you to monitor your network with up to 100 sensors. You can start a 30-day free trial.
4. ManageEngine OpManager Nexus (FREE TRIAL)
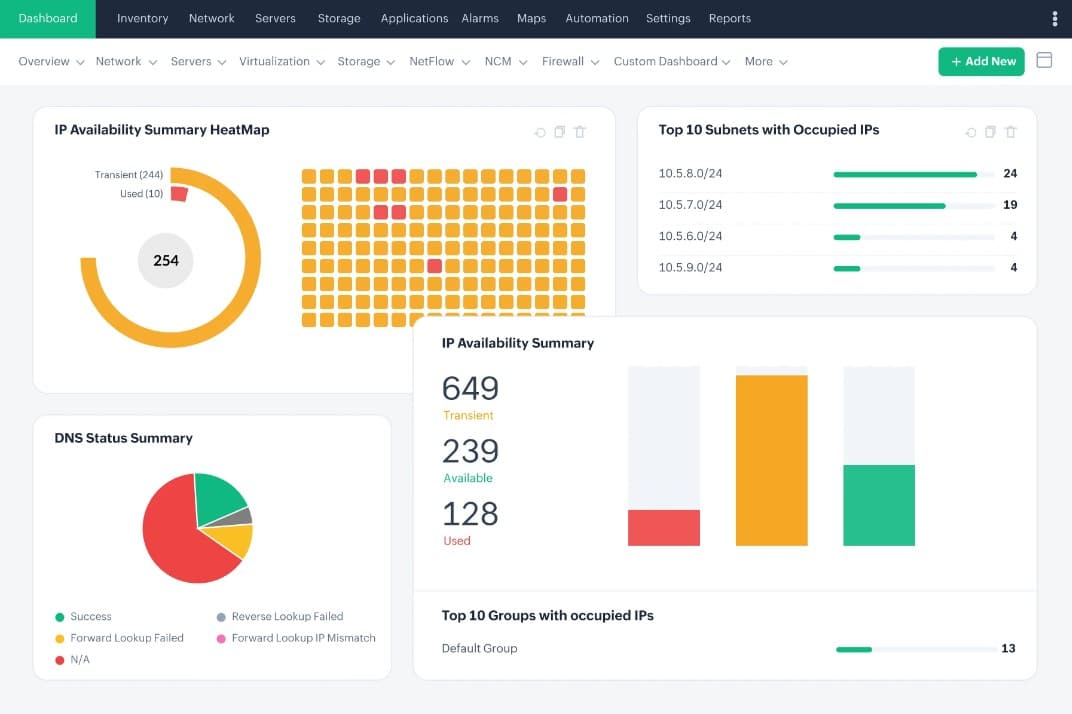
ManageEngine OpManager Nexus, formerly OpManager Plus, is a good alternative to Zabbix as it provides a 360-degree view of your IT operations management. It can monitor applications, servers, cloud resources, bandwidth usage, traffic analysis, configuration management, network devices, and more. Essentially, it correlates data from these sources and alerts you in case of any potential vulnerabilities. It even provides the required contextual data to speed up troubleshooting.
Key Features:
- Application performance management
- Infrastructure monitoring
- Bandwidth and traffic management
- Configuration management
- Network device monitoring
This platform is well-suited for large organizations and enterprises with a sprawling infrastructure. It automatically identifies, maps, and monitors devices and displays the results through a unified console in real time. Its proactive change monitoring and alerting capabilities allow you to stay on top of all the critical events happening in your network.
Its well-designed dashboards and reports make it easy to understand the metrics. It can help with auditing and compliance as well.
OpManager Nexus comes in two editions. The Professional edition starts at $1,233 for 50 devices, while the Enterprise edition starts at $19,995 for 1000 devices. Start a 30-day free trial.
5. SolarWinds Network Performance Monitor
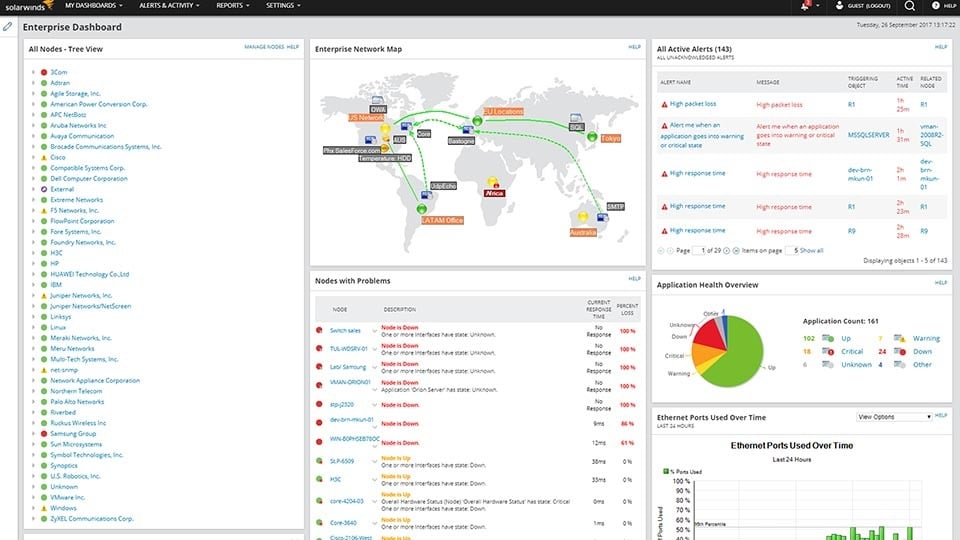
SolarWinds Network Performance Monitor is a network monitoring software that allows you to monitor the performance and availability of your network. With SolarWinds Network Performance Monitor you can conduct SNMP monitoring, hardware monitoring, traffic monitoring, and more through a customizable dashboard.
Key Features:
- SNMP monitoring
- Traffic monitoring
- Network mapping
- Custom Alerts
- Customizable dashboard
- Reports
When it comes to discovering devices, you can use the Network Sonar Wizard to automatically discover devices in your network to monitor. SNMP devices can automatically be added to a network map, so you can see how devices connect to each other topologically. Network maps are colour-coded to tell you the status of each device, which makes them great for hop-by-hop troubleshooting performance issues.
Alerts provided a heads-up on any performance issues in your network. The alert system allows you to choose between a selection of out-of-the-box alerts and or define the trigger conditions that will generate customized alerts. You can also create reports if you want to be more proactive in reviewing network performance.
SolarWinds Network Performance Monitor is a top tool for enterprises that want to manage their entire network through a single platform. Available on Windows, Mac OS, and Linux. Prices start at $1,638 (£1,154).
You can try SolarWinds Network Performance Monitor through a free and fully functional 30-day free trial.
6. Nagios XI

Nagios XI is a network monitoring tool that allows you to monitor your network through a web-based user interface with a customizable dashboard. With Nagios XI you can use configuration wizards to add new devices, servers, applications, and services to monitor. For instance, you can use the autodiscovery wizard to automatically discover new devices or monitor an Exchange server.
Key Features:
- Custom dashboard
- Configuration wizards
- Autodiscovery
- User management
- Alerts
- User management
User management allows you to configure multiple user accounts for your team. You can assign each of your team members a different role and configure security settings that configure what actions they are able to take. For instance you can determine whether they can see objects, control or configure hosts and services, access advanced features or access the monitoring engine.
The platform also comes with an alerts system. You can configure email and SMS notifications to let you know about changes in your environment such as when the status of a host changes. Notification escalations enable you to configure notifications to reroute to other users if a certain number of notifications haven’t been addressed. Nagios XI is recommended for enterprises that require a solution with detailed visualization options. Pricing starts at $1,995 (£1,405) for the Standard Edition. There is also a free edition that’s limited to monitoring up to 7 hosts. Available on Windows, Mac OS, and Linux. You can download the free trial via this link here.
7. Datadog
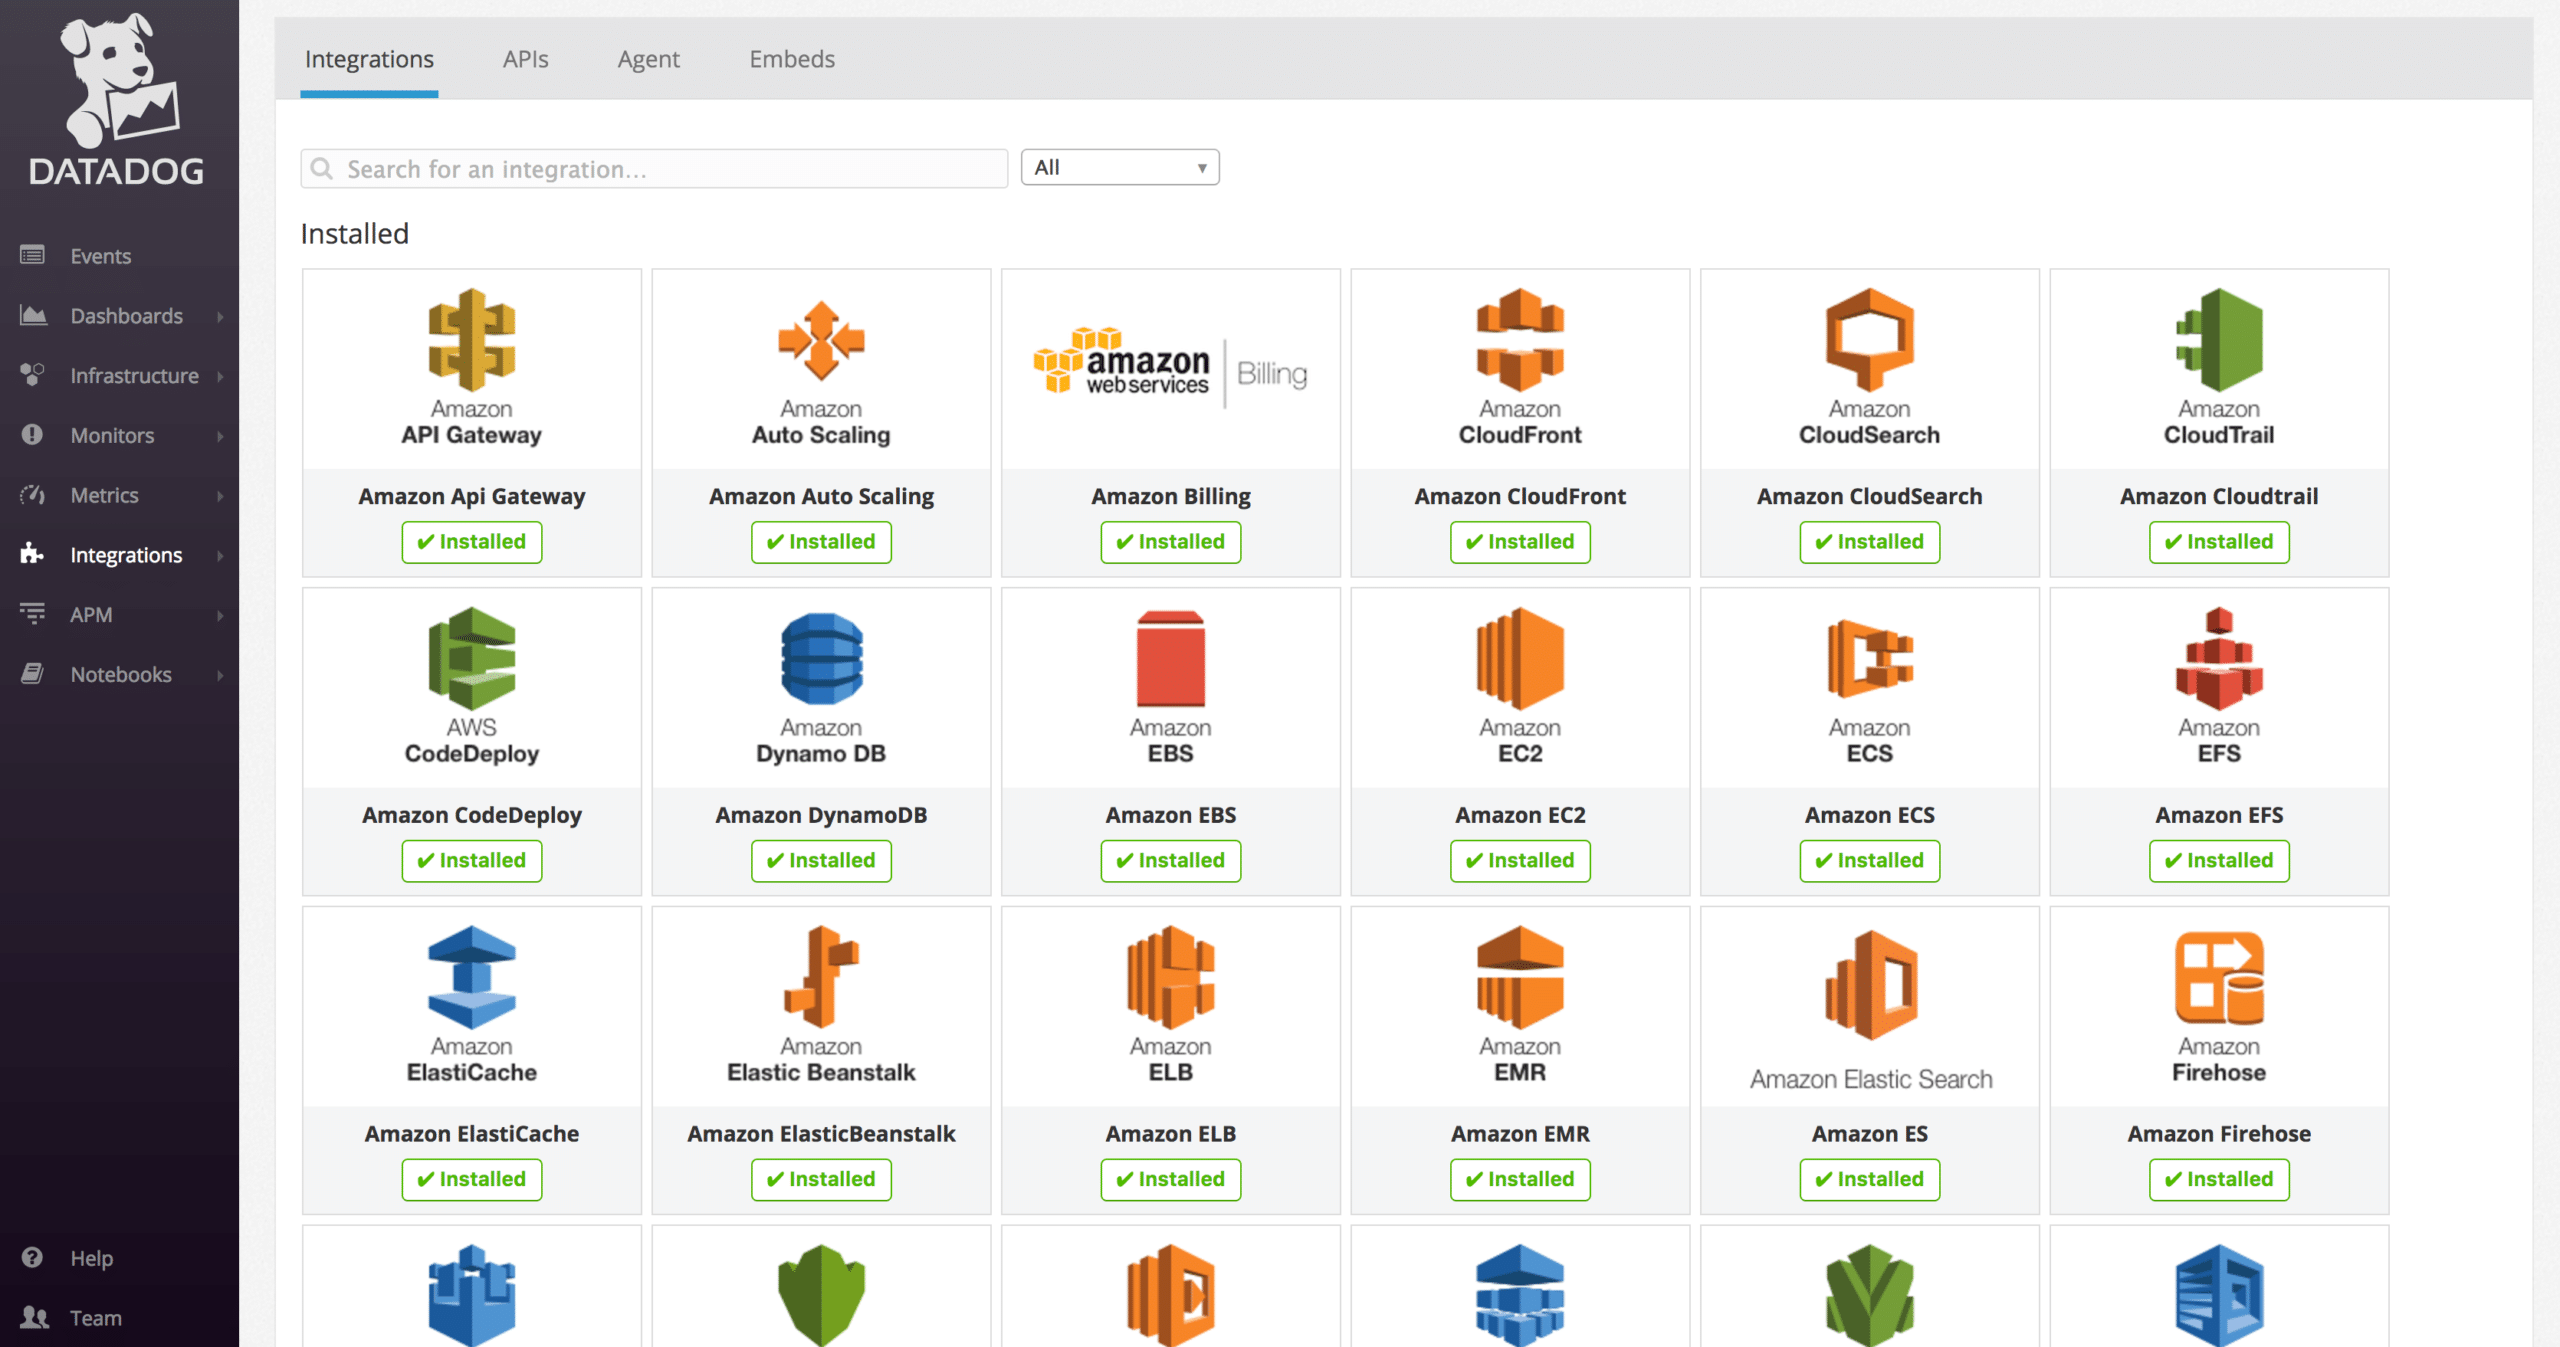
Datadog is a network monitoring platform that provides network, application, service, and cloud monitoring. With Datadog you can automatically collect logs from services and applications with over 600 out-of-the-box integrations, so you can maintain visibility over your entire network and analyze it from a single location. Search and filtering functions make it much easier to find the performance data that’s most relevant to your environment.
Key Features:
- Automatically collect service and application logs
- Search and filter logs
- Customizable dashboard
- Full API access
- Alerts
The user interface is highly configurable with a customizable dashboard, where you can monitor performance data in real-time and view data by host device or any tag of your choice. You can also use the platform’s full API access to create new integrations that can capture metrics from other applications that you rely on every day.
You can also configure the software to generate email, PagerDuty, slack, and other notifications. You have the option to set trigger conditions using the platform’s alerting logic and can see who has responded to alerts before you when you respond to a notification.
Datadog is recommended for enterprises that want to monitor a wide range of applications through a single platform. Available for Windows, Mac OS, and Linux. Pricing starts at $15 (£10.57) per host per month. There is also a free version that supports up to 5 hosts with 1-day metric retention. You can start the 14-day free trial via this link here.
8. Dynatrace

Dynatrace is an infrastructure and application performance monitoring tool that allows you to monitor network devices, services, and applications. With Dynatrace you can automatically discover hosts, applications, and dependencies and view them as part of a topological map. The map provides you with an end-to-end view of your entire application stack.
Key Features:
- Autodiscover hosts
- Dependency map
- Anomaly detection
- Alerts
- Business impact analysis
AI-driven anomaly detection identifies unusual activity in your network and provides you with alerts with and root-cause analysis so that you can address the issue that caused the problem. For example, the AI can identify deployments that cause SLA violations and roll them back. This reduces the amount of time you need to spend on manual incident management and speeds up the time to resolution of performance issues.
The AI also offers business impact analysis, which collects transactions from applications and tells you the exact number of real users who have been affected by an active performance issue. Seeing the real-time impact on users and customers enables you to prioritize which issues to remediate first.
Dynatrace is one of the top Zabbix alternatives for enterprises that require a state-of-the-art application monitoring tool. Costs $21 (£14.79) per month per host for the Infrastructure monitoring package and $69 (£48.62) per month per host for the Full-stack monitoring version. Requires a 64-bit Linux distribution as a dedicated host. You can start the 15-day free trial via this link here.
9. AppDynamics
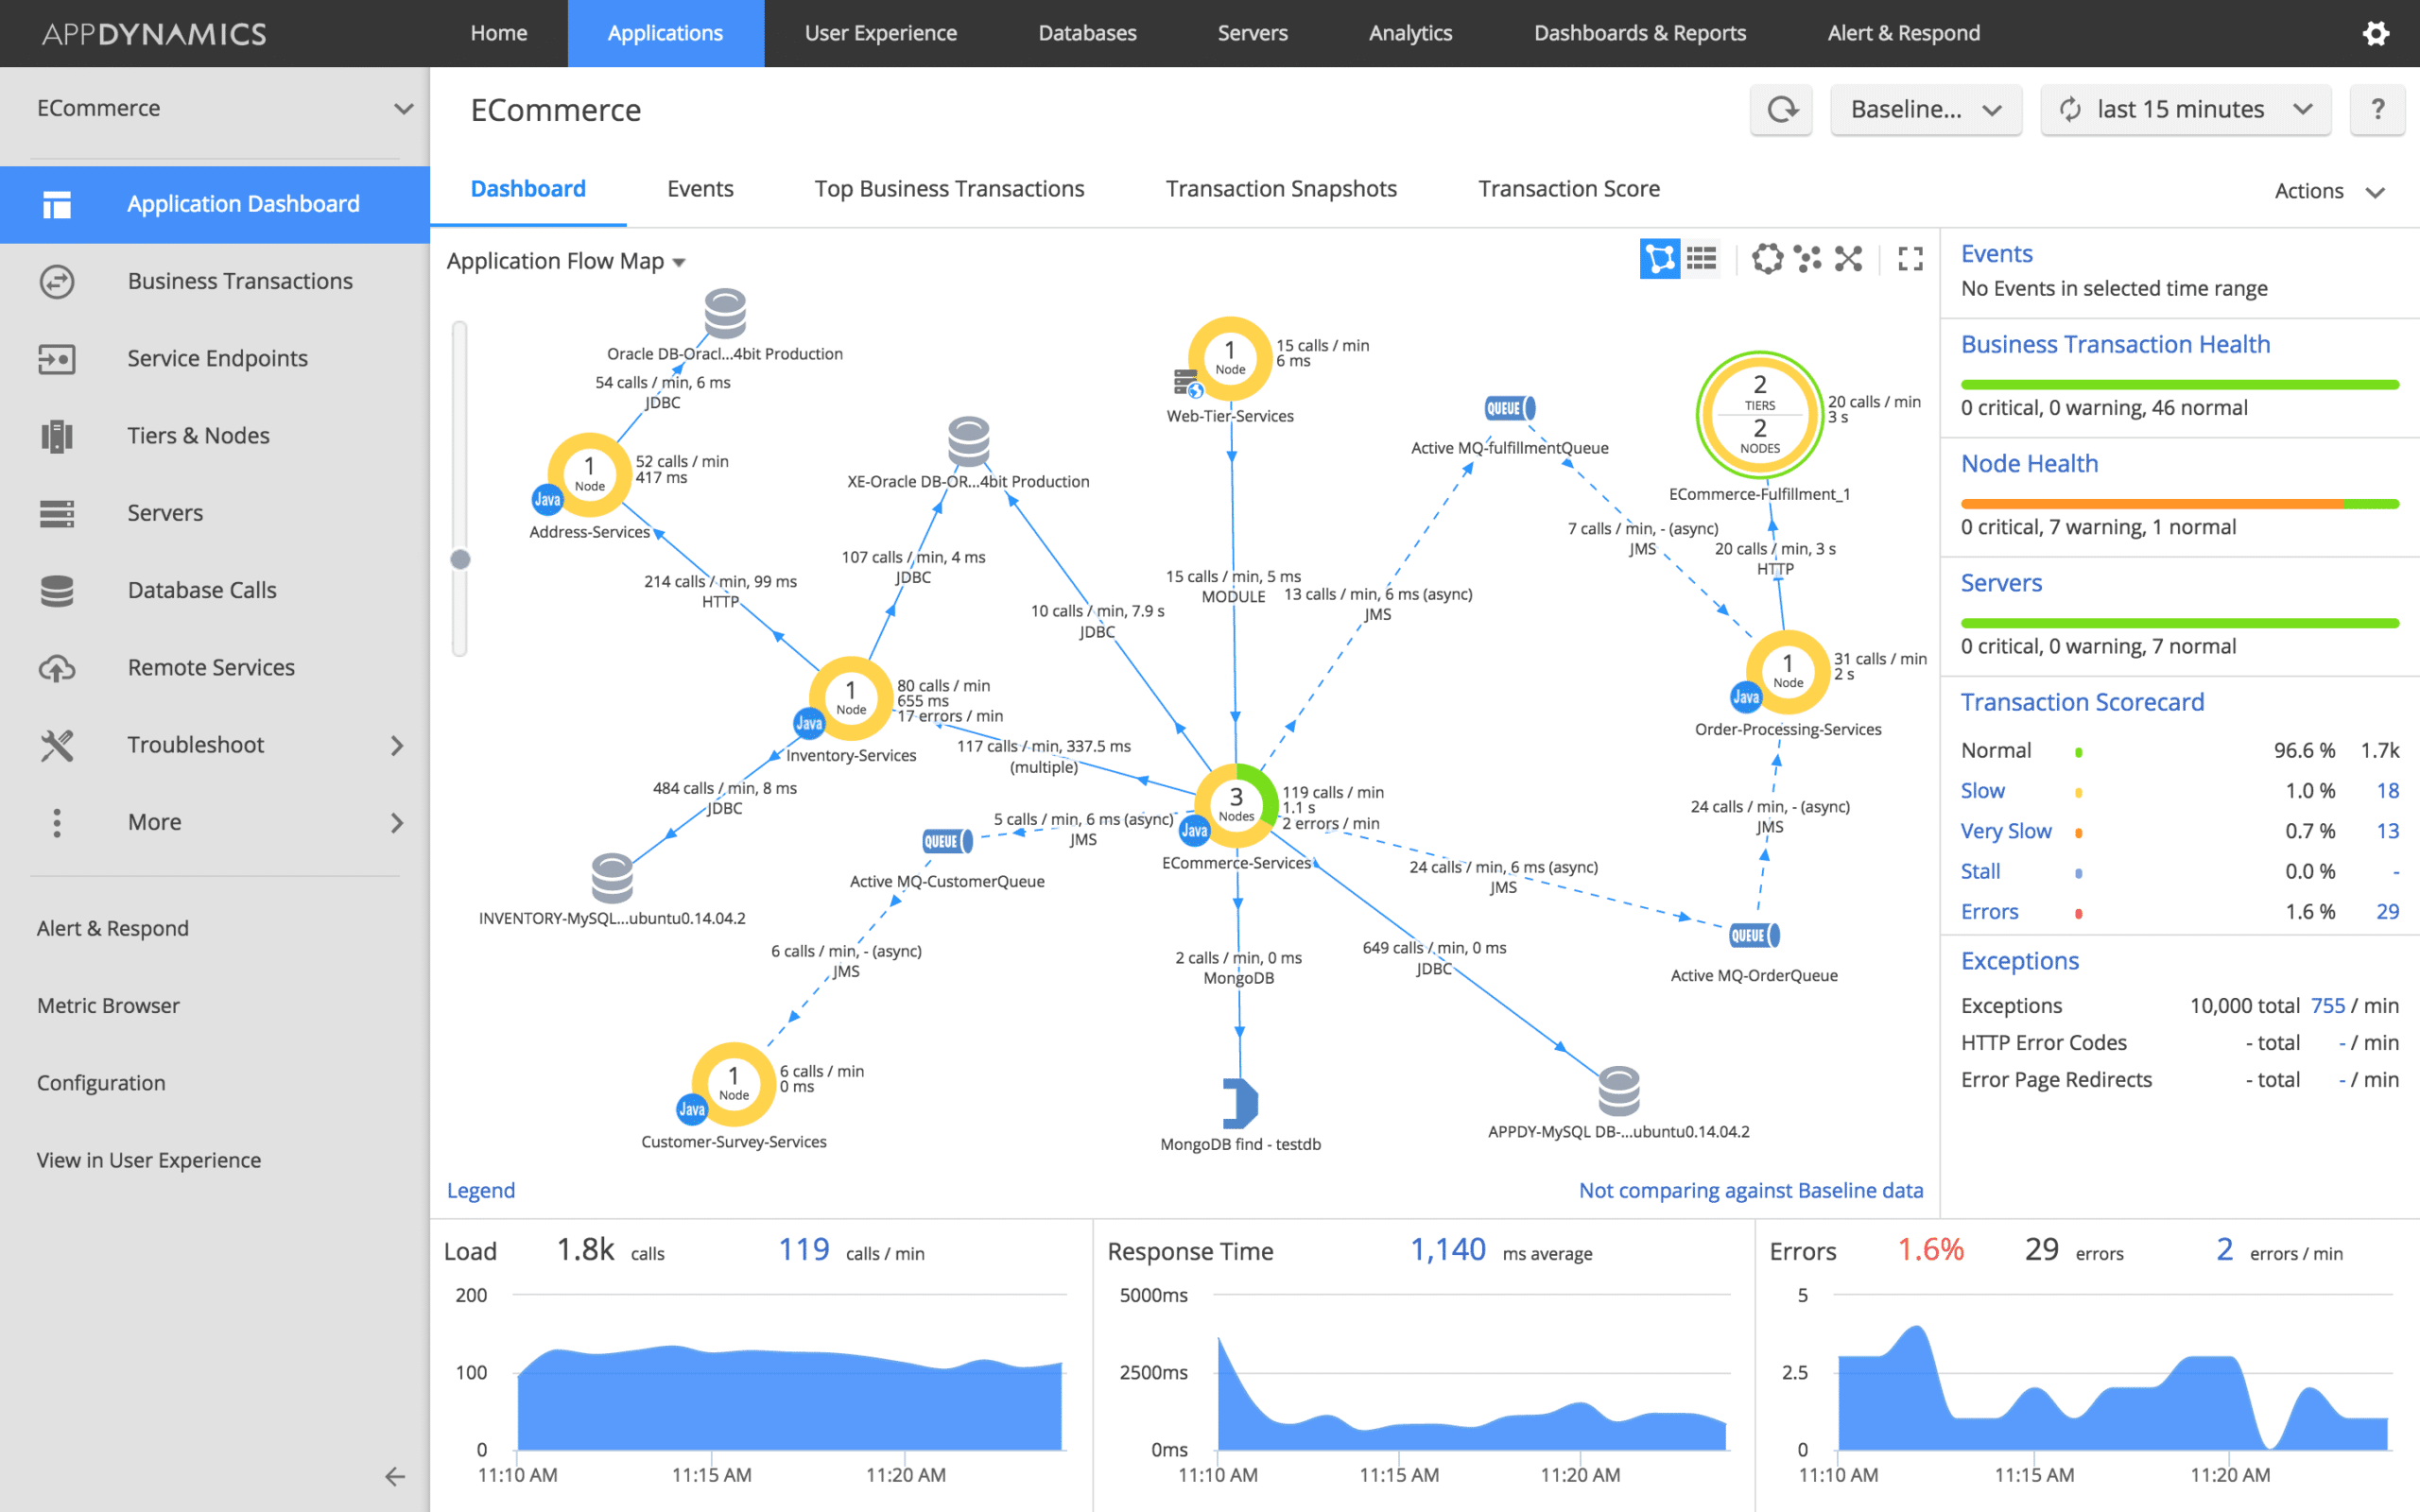
AppDynamics is an application performance monitoring solution. With AppDynamics you can monitor a hybrid cloud environment of applications and microservices in real-time. The platform can collect metrics from a range of services including Amazon Web Services, Azure App Services, IIS, Google Compute Engine, Java, Kubernetes, MySQL, NGINX, and more.
Key Features:
- Application monitoring
- Anomaly detection
- Integrations
- Dependency mapping
- Autodiscovery
An autodiscovery feature identifies traffic requests and creates a topology map to visualize their performance. Dependency mapping gives users a sophisticated view of the dependencies throughout their network, and helps to find new ways to address poor performance.
The software also includes anomaly detection, which can automatically detect performance anomalies in your network and notify you with alerts. Anomaly detection works by analyzing the normal behaviour of applications and generating a baseline and then issuing an alert when it deviates from that baseline to an extent that it can’t be considered a false positive.
AppDynamics is recommended for organizations that want to monitor the performance of applications with the assistance of anomaly detection. To view pricing information you need to request a quote from the company directly. Available on Windows and Linux. You can start the 15-day free trial via this link here.
10. Logic Monitor
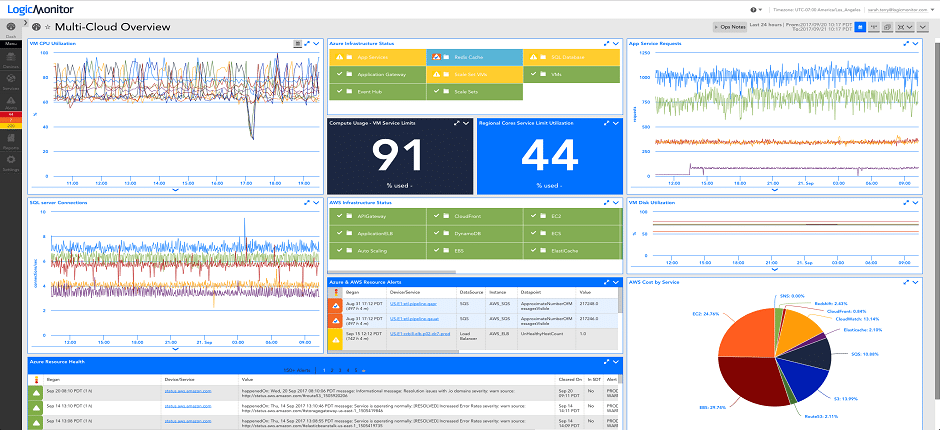
Logic Monitor is a cloud-based infrastructure monitoring platform with a customizable dashboard that enables you to monitor health, performance, resource utilization, and network usage of devices. Logic Monitor comes with over 2000 technology integrations so that it can collect metrics from a diverse range of solutions from databases to web applications.
Key Features:
- Custom dashboard
- 2000+ technology integrations
- Autodiscovery
- Topology maps
- Anomaly detection
Network autodiscovery automatically adds new devices to your monitoring environment so you don’t have to spend time adding them manually. You can also use topology maps to view your environment from a geographical perspective.
An AI solution enables the program to automatically identify performance anomalies and provide root cause analysis to help with the troubleshooting process. The AI isn’t just reactive but also proactive, forecasting and identifying future performance trends that you need to be aware of.
Logic Monitor is a solution fit for enterprises that want an AI-driven monitoring experience with minimal manual administration. To view pricing information for this product, you need to request a quote from the company directly. Requires Windows Server or Linux to install a collector. You can start the 14-day trial via this link here.
11. Sumo Logic

Sumo Logic is a log management and cloud monitoring tool that provides you visibility over your network infrastructure. With Sumo Logic you can monitor cloud applications in real-time with over 150 integrations for services like AWS, Amazon EC2, Azure, GCP, Docker, PagerDuty and MongoDB.
Key Features:
- Log management
- Cloud monitoring
- 150+ integrations
- Custom dashboard
- Analytics
- Alerts
The software comes with real-time analytics that can identify performance anomalies and point you in the direction of malicious behavior throughout your network. The dashboard is customizable so you have complete control over your perspective of the network and the metrics you see.
Machine learning powered alerts notify you when there is a problem in your network that needs addressing. Sumo Logic gives you the option to generate real-time email alerts when specific trigger conditions are met.
Sumo Logic is worth investigating if you’re looking for a cost-effective cloud monitoring and log management tool. Prices start at $277 (£195.14) for the Essentials version. There is also a free version that supports up to 500 MB per day. Collector available for Windows, Mac OS, and Linux. You can start the 30-day free trial via this link here.
12. Icinga 2

Icinga 2 is an open source network monitoring tool that you can use to monitor the availability of hosts and services such as network services, printers, switches, and temperature sensors. There is also a reporting module that allows you to generate email reports and export them to PDF, JSON, and CSV formats. You can schedule reports so you receive them periodically.
Key Features:
- Availability monitoring
- Plugins
- REST API
- Reports
- Access control
One of the biggest advantages of Icinga 2 is the diverse range of community plugins you can use to add new functions. Not only can you use plugins from the Icinga Exchange but you can also use plugins from Nagios. There is also a REST API you can use that’s compatible with any tool that can make HTTP requests.
You can keep the platform secure by using access controls. Access controls allows you to determine who has access to manage monitoring configurations and to configure rules for each user. Permissions are role-based so users are assigned permissions based on the role you assign to them.
Icinga 2 is one of the top Zabbix alternatives for enterprises in the market for an open-source network monitoring tool. The software is also completely free. Available on Debian, Ubuntu, RHEL/CentOS, OpenSUSE, and SLES. You can download the software for free via this link here.
Best Zabbix Alternatives: Editor’s Choice
Out of all the Zabbix alternatives, Site 24×7 stands out as the top offering for most enterprise users. Site24x7 offers extensive customization and flexibility. Paessler PRTG is a close runner-up as it offers an excellent sensor-driven experience with a customizable dashboard and alert options.
ManageEngine OpManager is also a great choice for smaller enterprises that require a less expensive tool that still has advanced network monitoring functionality. When searching for an alternative to Zabbix we recommend investigating multiple products and conducting your own research before making a purchase to ensure that you get the best fit for your environment.