Managing and monitoring an IIS server can be a challenge for any sized business. Keeping up with security updates, certificates, and services are all critical parts of running your web services. To make life easier, we’ve compiled nine of the best IIS server tools you can start using today.
Here’s our list of the best IIS server tools:
- Paessler PRTG – Best for Windows admins seeking built-in IIS sensors and customizable alerts
- ManageEngine EventLog Analyzer – Best for web admins analyzing IIS logs, errors, and visitor patterns
- AppDynamics – Best for .NET teams needing deep application performance and transaction insights
- Dynatrace – Best for large-scale environments requiring AI-powered IIS monitoring and auto-baselining
- SolarWinds Server Performance Bundle – Best for MSPs and enterprises monitoring 1200+ apps including IIS
- IIS Crypto – Best for Windows admins hardening IIS security and cipher settings
- Orca – Best for dev teams automating repetitive IIS configurations and workflows
- OpsView Monitor – Best for teams wanting agentless WMI monitoring of IIS and Microsoft services
Our methodology for selecting IIS server tools
We’ve broken down our analysis for you based on these key criteria:
- Comprehensive monitoring of IIS server processes and traffic
- In-depth insights into resource utilization and network traffic
- Robust security features, particularly SSL certificate monitoring
- Capability to track and view configuration changes
- Compatibility with modern Windows servers
The best IIS Server tools
1. ManageEngine Applications Manager (FREE TRIAL)

ManageEngine Applications Manager provides IIS and web server monitoring through a deployed agent on your IIS server. Applications Manager measures web service availability and response time to assure a positive experience for your end-users. Metrics such as files per second, site health, and anonymous/non-anonymous users per second are all monitored separately and displayed on a simple yet effective dashboard.
Key Features:
- Detailed web service monitoring
- Application pool health checks
- User-satisfaction Apdex Scores
- 30-day free trial option
Why do we recommend it?
ManageEngine Applications Manager provides a user-friendly dashboard displaying key metrics such as files per second, site health, and anonymous/non-anonymous users per second, allowing for easy and effective monitoring. The tool’s capability to detect application pools and set up alert templates for outage or availability issues is crucial for maintaining seamless site performance. Moreover, the inclusion of user-satisfaction Apdex Scores offers unique insights into IIS server health and transaction processing.
If your environment runs multiple services from application pools, monitoring those pools and their health is critical in keeping your sites up, and your users connected. Application Manager automatically detects these pools and sets up alert templates to keep you informed of any outages or availability issues.
Lastly, the Application Manager provides unique insights into your IIS servers’ health through user-satisfaction Apdex Scores. Each transaction is taken into account to give you a better overall look at your services’ health, as well as how individual transactions are being processed.
Who is it recommended for?
The product is particularly well-suited for environments running multiple services from application pools, where monitoring pool health is essential to ensure uninterrupted site availability. IT teams responsible for maintaining web services and IIS servers can benefit from this tool. The 30-day free trial provides an opportunity to explore the tool’s capabilities and assess its suitability for specific monitoring needs.
Pros:
- Comprehensive monitoring of web service availability and response
- Precise monitoring of multiple service metrics
- Insightful Apdex Scores for overall service health assessment
Cons:
- Might require a learning curve for full utilization
You can download a fully functional 30-day free trial from ManageEngine’s official site.
2. eG Enterprise IIS Monitoring (FREE TRIAL)

eG Enterprise, by eG Innovations, offers infrastructure and application monitoring with two modules that interact with each other to identify the root cause of a system performance problem. IIS web server is one of the applications that this system can monitor.
Key Features:
- Infrastructure and application monitoring
- Code performance insights
- Resource utilization tracking
- SaaS platform availability
Why do we recommend it?
eG Enterprise offers joined-up monitoring that traces performance issues by examining service dependencies across multiple levels. The availability of a free IIS monitoring extension, which provides detailed views of web server activity and web application code performance in Python, .NET, and Javascript, is a valuable feature.
The basic eG Enterprise system comes with a library of extensions. These add on extra screens and monitoring agents for specific third-party systems. There is a free extension available for IIS monitoring. This gives you detailed views of the activity within the web server, down to web application code performance in Python, .NET, and Javascript.
eG Enterprise is an infrastructure monitoring package that also offers an extra APM module for application monitoring. Whether you just take the base package or also use the APM, you get joined-up monitoring that traces the real cause of performance issues by examining service dependencies.
The monitor operates on multiple levels simultaneously. It tracks the user experience, looking at access requests to your web assets, it also tracks metrics within the IIS software and the code that it delivers to assemble web pages. The infrastructure module of the eG Enterprise system spots when the physical resources needed by IIS are running short. This explains the potential root cause of IIS problems, so you can make adjustments to servers to head off disaster.
Who is it recommended for?
eG Enterprise is well-suited for organizations seeking comprehensive infrastructure and application monitoring, particularly those using IIS web servers. It is beneficial for IT teams looking to identify and address performance problems, including those related to the IIS software and server resources. The availability of a 30-day free trial allows users to explore the capabilities of eG Enterprise and assess its suitability for their monitoring needs.
Pros:
- Integrated monitoring of infrastructure and applications
- Multi-level monitoring, from user experience to IIS software
- Identifies root causes of performance issues efficiently
Cons:
- Complexity may not suit small-scale deployments
The eG Enterprise software can be downloaded onto Windows Server or Linux and it is also available as a SaaS platform. Access a 30-day free trial of eG Enterprise.
3. Site24x7 Infrastructure (FREE TRIAL)

The Site24x7 IIS Monitoring system is an integration, which derives from a plugin that extends the out-of-the-box functionality of the Infrastructure module. Site24x7 is a cloud-based system that offers a suite of system monitoring and management tools. Infrastructure is one of these and it focuses on servers and the services that they offer to applications. Confusingly, those services to applications can be applications themselves. As a rule of thumb, it examines the performance of everything behind the user interface down to the operating system of the server that hosts those services.
Key Features:
- IIS integration for extended functionality
- Cloud-based monitoring console
- Memory leakage and application error tracking
- Free trial available
Why do we recommend it?
Site24x7 IIS Monitoring is recommended for its cloud-based system that offers comprehensive system monitoring and management tools. It extends the Infrastructure module, providing deep insights into IIS server performance, including memory leakage, application delivery errors, request quantification, system resource usage, and failed requests. It effectively links IIS actions to server resources, making it a valuable tool for IIS monitoring.
The IIS integration adds on screens and probes to the Infrastructure system. The console is hosted in the cloud and technicians access it through any standard browser. The service can group together the monitoring of servers located on different sites and also in the cloud.
Among the factors that the IIS monitor observes are problems of memory leakage and errors in application delivery through the IIS system. It also quantifies requests, system resource usage, and failed requests. The module links together IIS action and the server resources that support them. It also looks at the operating system services that manage the allocation of server resources to each IIS instance.
Who is it recommended for?
It is particularly useful for those who want to monitor IIS server performance, identify issues like memory leakage and failed requests, and gain insights into resource allocation. The free trial allows users to evaluate its effectiveness for their specific needs. Site24x7 IIS Monitoring is suitable for organizations and IT professionals seeking cloud-based IIS monitoring solutions.
Pros:
- Enhances Infrastructure module with IIS-specific monitoring
- Effective in identifying memory leaks and application delivery issues
- Versatile monitoring across different sites and cloud environments
Cons:
- Integration complexity could be challenging for some users
Start a 30-day free trial.
4. Paessler PRTG IIS Monitoring (FREE TRIAL)
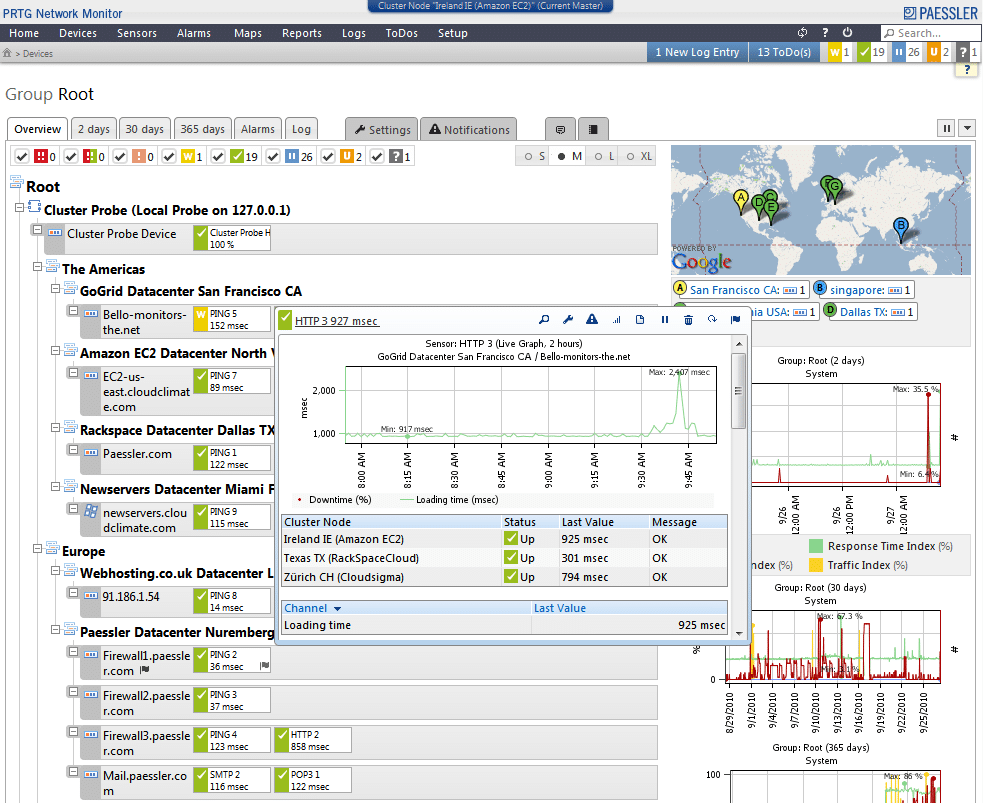
When someone says Paessler PRTG, you might just think of network monitoring. Paessler PRTG in fact has a built-in monitoring sensor that encompasses all of IIS. PRTG monitors the IIS server by utilizing the Windows Management Instrumentation. In addition to the server itself, PRTG can also monitor applications that use IIS, such as Microsoft Reporting Services or SharePoint.
Key Features:
- Windows Management Instrumentation use
- Comprehensive performance indicators
- Customizable alert configurations
- Focus on IIS server monitoring
Why do we recommend it?
Paessler PRTG is recommended for IIS server monitoring because it offers a built-in monitoring sensor that comprehensively covers IIS, including the server itself and applications that use IIS. The use of Windows Management Instrumentation allows for efficient monitoring. PRTG provides a visual overview of IIS server metrics and offers customizable alerts, making it a valuable tool for monitoring IIS performance.
On the Overview tab, you’ll get a visual representation of your IIS server metrics that are shown through a performance gauge. Here you’ll be able to monitor over eight different performance indicators such as uptime, requests per second, users per second, and the number of files sent or received.
Like any other of PRTG’s sensors, you can configure alerts based on a number of customized or preconfigured settings. While PRTG can monitor a lot of different systems, it does a solid job of monitoring IIS and is definitely worth at least testing out.
Who is it recommended for?
Suitable for organizations and IT professionals looking for a reliable tool to monitor IIS servers and related applications. It is particularly useful for those who want to track critical performance indicators, set up alerts, and ensure the optimal operation of IIS. The 30-day free trial allows users to explore PRTG’s capabilities for IIS monitoring.
Pros:
- Diverse range of performance indicators for in-depth analysis
- Flexible alert system tailored to specific needs
- Solid performance in IIS monitoring compared to other systems
Cons:
- May not be as comprehensive in other monitoring areas
You can download PRTG for your IIS server and test all of its premium features free for 30 days.
5. ManageEngine EventLog Analyzer (FREE TRIAL)

ManageEngine EventLog Analyzer offers extensive visibility into IIS web servers by collecting and analyzing the data generated by them. It also correlates the findings with data from other aspects of your network for comprehensive insights.
Key Features:
- Supports massive log volumes.
- Automatically imports your IIS web server logs based on a set schedule.
- Comes with advanced search and filtering options.
- Generates predefined alerts and reports.
Why do we recommend it?
We recommend ManageEngine EventLog Analyzer for its comprehensive approach to log monitoring and analysis. It can gather hundreds of log files from multiple web servers and analyze them to identify issues and vulnerabilities.
One of the aspects that stands out to us is its reporting capabilities. You can classify the reports into three groups – most frequent access, popularity, and errors. As the name suggests, the first category of reports provides information about the top visitors, operating systems, and browsers using your IIS web servers. Based on this information, you can improve the resource utilization, capacity planning, and bandwidth usage.
The popularity reports list the pages, images, and file types that are most popular on your website, so you can optimize the content and layout of your web pages. Lastly, the error reports list down the errors that you encounter, so you can fix them.
Who is it recommended for?
It is recommended for web server administrators and anyone who runs websites on IIS servers. It is particularly helpful for developers, testers, and teams that manage IIS server-based websites.
Pros:
- Extensive reports that can provide insights into the health, security, and performance of your web servers.
- Correlates data from multiple sources for wide visibility.
- Highly scalable.
- Offers search and filtering capabilities.
Cons:
- Integrations may require technical expertise.
Download EventLog Analyzer to try it free for 30 days.
6. AppDynamics

Another tool you may be familiar with is AppDynamics. AppDynamics is known for its application performance management and that includes monitoring IIS servers as well. AppDynamics makes IIS management easy, through a simple .NET Machine Agent the IIS server is added to the management inventory and begins reporting back data to the controller. The agent utilizes Microsoft Windows Performance Counters to gather all of the IIS metrics.
Key Features:
- Microsoft Windows Performance Counters utilization
- Comprehensive IIS-related metrics monitoring
- Free trial option
Why do we recommend it?
AppDynamics offers an easy setup using a .NET Machine Agent and leverages Microsoft Windows Performance Counters to gather comprehensive IIS metrics. AppDynamics excels in monitoring IIS shutdowns, restarts, and various application-level metrics, providing real-time and historical views. Its user-friendly interface and topographical network map simplify IIS management, making it an invaluable tool for organizations.
By default, the agent monitors IIS for shutdowns and restarts and can report back if the restart was smooth or not. On the application level, AppDynamics can pull all of the IIS related metrics you’d need to monitor. Stats such as requests queued, wait time, and requests rejected are all displayed both in real-time and as a historical view.
The monitoring dashboard shows your network and servers on a topographical level by default. Below the network map you can set three custom graphs to monitor real-time applications or processes. If IIS monitoring is critical for your environment, AppDynamics does a great job at bringing all of your critical alerts to a single dashboard for monitoring.
Who is it recommended for?
AppDynamics is well-suited for organizations and IT professionals requiring in-depth IIS monitoring. It is particularly valuable for those who need to monitor critical IIS-related metrics such as requests queued, wait time, and requests rejected. The topographical network map and customizable graphs make it a suitable choice for environments where IIS monitoring is essential. Whether you manage a complex network or a single IIS server, AppDynamics streamlines the monitoring process, making it a top choice for businesses of all sizes. Users can explore the tool further with a free trial.
Pros:
- Easy integration and management of IIS servers
- Real-time and historical data visualization for comprehensive analysis
- User-friendly dashboard for efficient monitoring
Cons:
- Pricing transparency could be improved
Accurate pricing for AppDynamics is available through request. You can start a free trial of AppDynamics on its official website.
7. Dynatrace

Dynatrace provides a power IIS monitoring tool that measures performance on both the server and the end-user level. Dynatrace positions itself as being one of the more scalable options, giving you the flexibility to manage over 100,000 hosts per cluster. Automation features like root cause analysis and auto baselining help make Dynatrace stand out. Not only are these features powerful, but they’re easy to implement. Launching the agent and getting started takes about five minutes.
Key Features:
- Scalable monitoring capabilities
- Root cause analysis automation
- Comprehensive infrastructure insights
- 15-day free trial
Why do we recommend it?
Dynatrace is recommended for its scalability, with the ability to manage over 100,000 hosts per cluster. The tool’s automation features, including root cause analysis and auto baselining, are powerful and remarkably easy to implement. Dynatrace provides essential monitoring features such as uptime monitoring and web traffic insights, with data gathered from a single probe that covers the entire application stack. The user-friendly interface, offering real-time performance charts and customizable bar graphs, enhances the overall monitoring experience.
You can expect all the basic monitoring features from Dynatrace such as uptime monitoring and web traffic insights. Data is all pulled from a single probe that monitors and reports on your entire application stack. Auto-discovery intelligently crawls your network and reports back it’s findings.
One of my favorite parts of Dynatrace is its interface, which is critical to get right for app monitors. At the top, you can toggle between analytics, servers, databases and your reports. The main page pulls a real-time chart of your server’s performance over the past few minutes. Bar graphs on the right give you quick insight into top applications, resources utilized, and transaction volume. Of course, all of these can be customized but the default view worked well during testing.
Who is it recommended for?
Dynatrace is an ideal choice for organizations that demand extensive IIS monitoring capabilities and scalability. Its capacity to handle a large number of hosts makes it suitable for enterprises and complex network environments. The tool’s ease of use, quick setup, and real-time monitoring features make it valuable for IT professionals and businesses of all sizes. Whether you’re an IT administrator or part of a large enterprise, Dynatrace simplifies IIS monitoring and delivers essential insights. Users can explore the tool’s capabilities with a free trial.
Pros:
- Automated features simplify problem resolution
- Unified monitoring of server performance and user experience
- Intuitive interface with customizable options
Cons:
- May be more than required for smaller setups
You can get your hands on a free 15-day trial to test Dynatrace for yourself.
8. SolarWinds Server Performance & Configuration Bundle

If you’re looking for a tool that can monitor IIS as well as offer other in-depth application monitoring, then SolarWinds Server Performance & Configuration Bundle (SPCB) might be a good fit for your organization.
Key Features:
- Topological network mapping
- Monitoring of 1200+ applications
- Configurable automated responses
- 30-day free trial available
Why do we recommend it?
SPCB offers a holistic approach to application monitoring, employing agents to create a topological map of network services and their dependencies. This feature helps organizations plan for contingencies, outages, and failovers, enhancing overall network resilience. With support for monitoring over 1200 applications, SPCB is particularly well-suited for MSPs and larger enterprises. The tool’s intuitive dashboard provides clear alerts and detailed information on issues, and users can easily configure alerts based on predefined or custom thresholds. Automated responses to specific conditions can also be configured from within the dashboard, allowing for efficient issue resolution.
SPCB approaches applications monitoring on a holistic level using deployed agents to map out a topological map for your network, applications, and services. This automatic probing not only builds a map of your services but highlights the connecting systems that are dependent upon them. This feature alone will help you plan for outages, failovers, and other contingencies.
In addition to IIS, SPCB can monitor over 1200 other applications making this a powerful tool for MSPs or larger enterprises. Managing these alerts from the dashboard is simple; green or red icons will alert you to problems and a dropdown menu will give you further detail as to what was responsible.
Alerts can be configured based on predefined or custom thresholds when the performance or availability of any of your applications change. On the backend, you can configure automated responses to specific conditions all from within the dashboard. You can reboot services, servers, or execute scripts based on thresholds you define.
Who is it recommended for?
Recommended for managed service providers (MSPs) and larger enterprises seeking a robust application monitoring tool with IIS support. It’s ideal for organizations requiring proactive network and application monitoring, mapping, and alerting to ensure service availability and performance. The solution is suitable for IT teams responsible for maintaining a complex network infrastructure. The 30-day free trial allows organizations to test the tool’s capabilities and evaluate its fit within their environment.
Pros:
- Intuitive alert management with visual indicators
- Versatile monitoring capabilities for various applications
- Efficiently automates responses to system conditions
Cons:
- Could be overwhelming for smaller IT teams
You can test-drive SolarWinds Server Performance & Configuration Bundle on your network free for a full 30 days.
9. IIS Crypto

IIS Crypto is truly unique among this list of tools as it solely focuses on IIS server environments, and really nothing else. If you’re running a small operation and just need an easy way to administer your IIS server, IIS Crypto might be what you’re looking for.
Key Features:
- Focus on IIS server security
- Template-based configuration
- Advanced registry settings control
- Free to use
Why do we recommend it?
IIS Crypto provides a user-friendly solution for administrators looking to efficiently manage their IIS servers. With just a single click, IIS Crypto enables the implementation of best IIS server practices, enhancing security by protecting against common vulnerabilities like logjam, FREAK, and POODLE attacks. It also allows users to disable weak protocols such as MD5 and 3DES instantly. The ability to configure templates and deploy settings across multiple IIS servers simplifies management and ensures consistent security configurations.
With implementing best IIS server practices through the IIS Crypto interface, you’ll be able to immediately benefit from protection against logjam, FREAK, or POODLE attacks, and have weak protocols like MD5 and 3DES turned off right away.
In addition to all the changes you can make, you can also configure templates. Customize the settings how you want, and easily deploy them on all on another IIS server through the templates feature. If you’re getting started from scratch you can utilize any of the ready to deploy templates. This includes PCI 3.2, Strict, and FIPS 140-2 compliant preconfigured settings.
In addition to cipher and security settings you’ll have full access to change advanced registry settings, backup registry, and revert all of your changes back to default settings if needed. CLI lovers will appreciate the command line version that comes with the standard version of IIS Crypto as well.
Finally, IIS Crypto comes with a site scanner that lets you test your sites and web assets to ensure your changes and configurations are functioning as intended.
Who is it recommended for?
IIS Crypto is highly recommended for small to medium-sized businesses and administrators looking for an easy and specialized tool to optimize and secure their IIS server environments. It simplifies the process of implementing security best practices, making it suitable for users who may not have advanced technical expertise. The tool’s compatibility with various Windows Server versions further extends its usability. Whether you’re setting up a new IIS server or managing existing ones, IIS Crypto offers a user-friendly and efficient solution for enhancing server security. This tool is a free and valuable addition to the toolkit of administrators working with Windows Server 2008, 2012, 2016, and 2019.
Pros:
- Specialized in enhancing IIS server security
- Easy implementation of best security practices
- Customizable templates for rapid deployment
- Includes a useful site scanner for configuration verification
Cons:
- Limited in scope compared to full monitoring solutions
IIS Crypto is completely free and compatible with Windows Server 2008, 2012, 2016, and 2019.
10. Orca
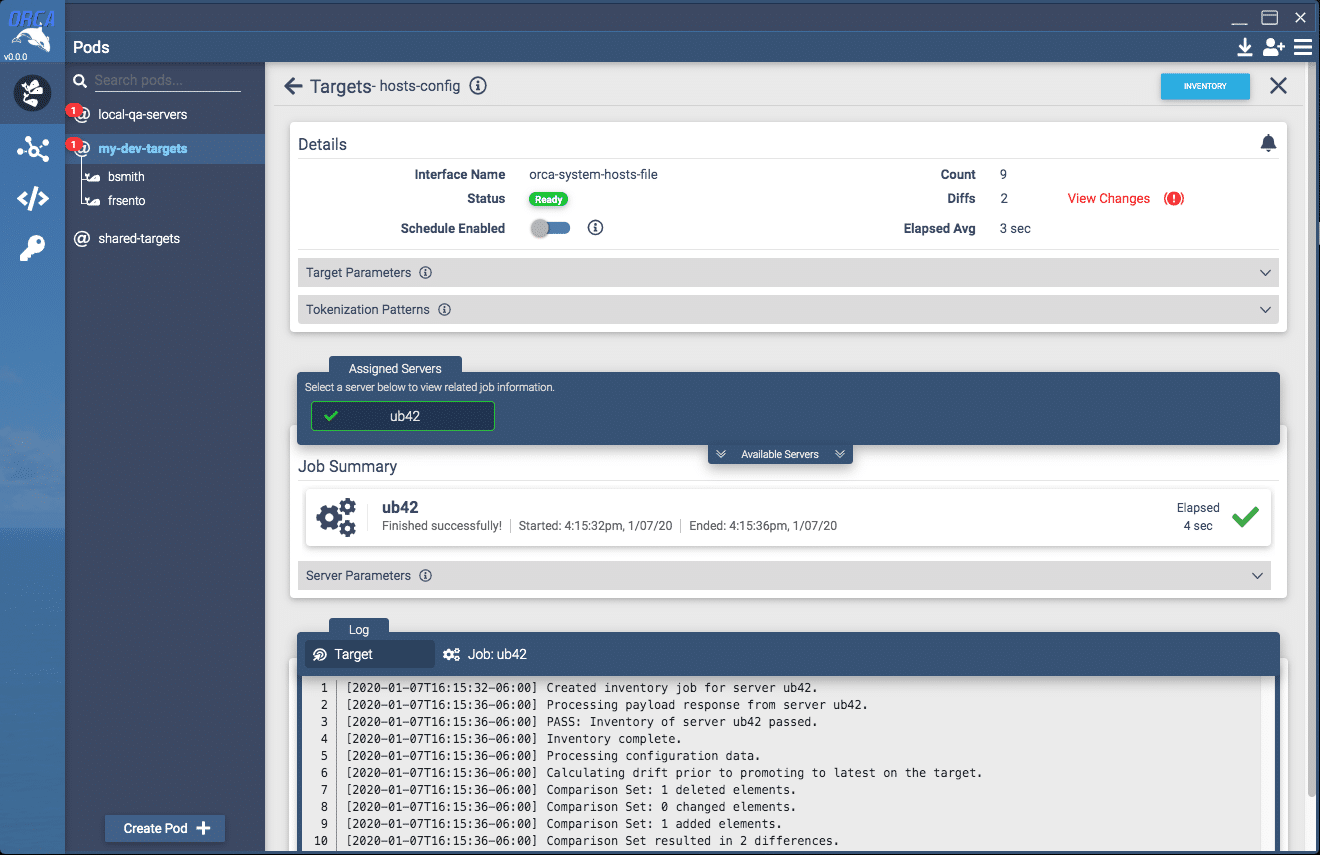
Orca focuses on making configurations to IIS servers simple through automation as well as providing IIS server monitoring and reporting. Through Orca you’ll have full control of your development environment and have the ability to create or modify virtual directories, application pools, IIS features, and websites.
Key Features:
- Simplified IIS server configurations
- Monitoring and reporting capabilities
- Automated administrative workflows
- Interactive demo available
Why do we recommend it?
Orca offers an effective solution for simplifying IIS server configurations, emphasizing automation and providing robust monitoring and reporting capabilities. With Orca, users gain comprehensive control over their development environments, enabling the creation and modification of virtual directories, application pools, IIS features, and websites with ease. The tool excels in streamlining administrative workflows while retaining advanced features and configuration options.
Creating a new IIS website or environment from an existing service is as easy as clicking copy and paste. Orca does a great job of making administrative workflow simple, while still keeping advanced features and configuration intact.
Under the Job Ecosystem tab you can create an entire workflow for the changes you’re looking to make, or the new servers you need to add. Before applying new settings live you’ll be given an overview of those changes, and what environments will be impacted before pushing out those updates.
Orca is ideal if you find yourself needing to repeat similar workflows in your IIS servers. Out of the box, Ocra provides IIS configuration, monitoring, and remediation solutions that are ready to implement in about five minutes.
Who is it recommended for?
This tool is particularly valuable for individuals or teams that frequently perform repetitive tasks or workflows on IIS servers. With Orca’s pre-configured IIS configuration, monitoring, and remediation solutions, users can expedite their workflows, making it a convenient choice for optimizing IIS server management. This tool is ready to implement in approximately five minutes, offering a convenient solution for various Windows-based environments.
Pros:
- User-friendly interface for IIS server management
- Efficient monitoring and reporting of IIS environment
- Streamlines administrative processes through automation
Cons:
- Specific focus may limit broader application monitoring
You can request an interactive demo of Orca on their official website.
11. OpsView Monitor
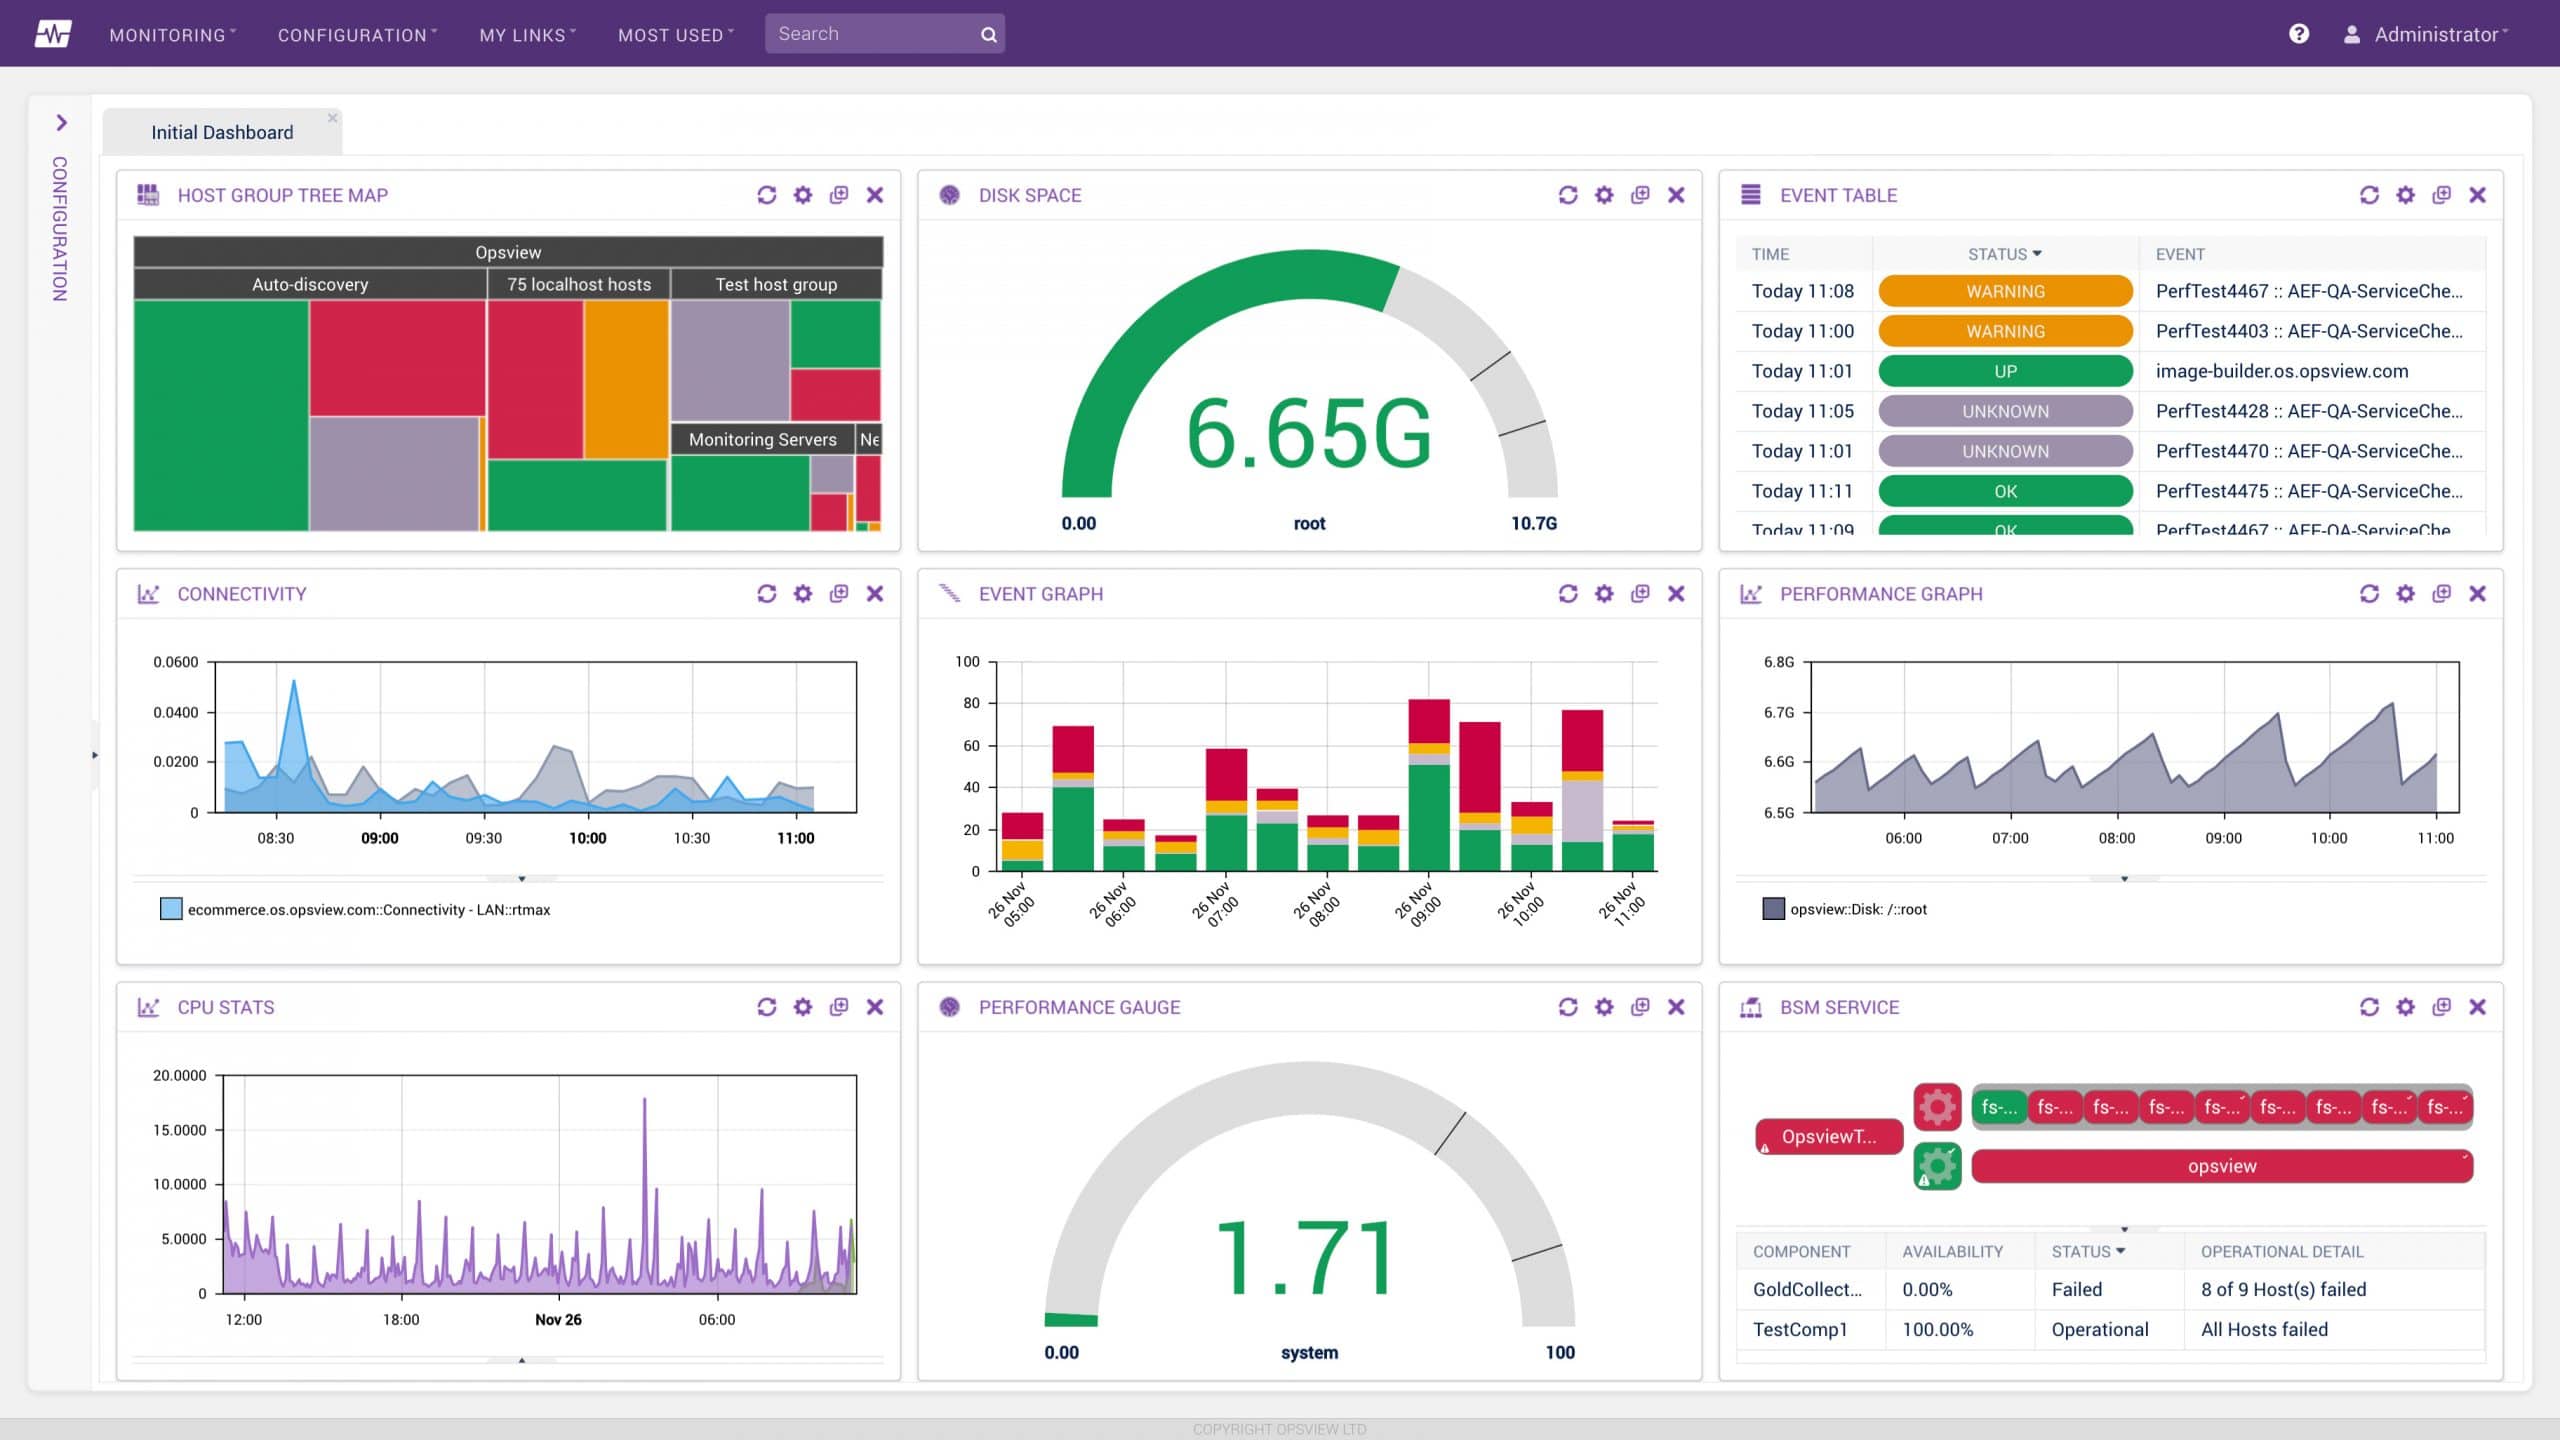
OpsView Monitor uses WMI to agentless monitor your IIS server and applications. Like other application monitors, you can use OpsView to monitor other Microsoft services such as DNS, Terminal Services, and Exchange.
Key Features:
- Agentless monitoring using WMI
- Customizable dashboard
- Comprehensive service checks
- Free cloud trial
Why do we recommend it?
Out of the box, OpsView offers a wide range of service checks, such as transfer statistics, user insights, request tracking, and connection volume within IIS applications. These predefined checks make it convenient for users to initiate monitoring without the need for extensive configuration. The tool features a simplified and customizable dashboard that empowers users to create tabs for specific metrics or application pools. This flexibility in dashboard configuration ensures that users can focus on the metrics that matter most to their IIS server and applications, enhancing visibility and ease of monitoring.
WMI can be more resource-intensive when it comes to polling data across large networks or servers, so keep this in mind if you do decide to choose an agentless option that uses WMI.
Who is it recommended for?
This tool is particularly valuable for those seeking an efficient and user-friendly solution for monitoring IIS applications and infrastructure. OpsView’s extensive predefined service checks simplify the monitoring setup process, making it suitable for both beginners and experienced users. However, users should be aware that WMI-based monitoring may consume more resources, especially in large networks or server environments. OpsView offers a free cloud trial for testing IIS server monitoring capabilities.
Pros:
- Highly customizable dashboard for tailored monitoring
- Includes a variety of service checks for thorough analysis
- Effective for monitoring Microsoft services alongside IIS
Cons:
- Resource intensity of WMI may be a drawback for larger networks
You can test out OpsView Monitor for your IIS server for free with Opsviews free cloud trial.