Struggling to monitor a network full of devices is a sticking point that many enterprises face. At the very least, monitoring multiple devices requires the right software. System monitoring software allows you to monitor the status of servers, devices, and other services that your employees use every day. The best tools will allow you to monitor the performance and health of connected devices. In this article, we’re going to look at the best system monitoring software tools.
Here is our list of the best system monitoring software platforms:
- NinjaOne EDITOR’S CHOICE Proactively monitors the health and performance of all your endpoints in real-time and generates context-rich alerts to support troubleshooting. Start a 14-day free trial.
- SuperOps RMM (FREE TRIAL)‘ This SaaS system provides device discovery and constant monitoring and it is suitable for use by managed service providers. Get a 14-day free trial.
- ManageEngine OpManager (FREE TRIAL) Network monitoring tool that can monitor network hardware, servers, and virtualized platforms. It includes customizable dashboards and alerts. Start a 30-day free trial.
- Site24x7 (FREE TRIAL) Website monitoring solution designed to monitor the availability and end-user experience. The tool also has a root-cause analysis to help the user find the cause of performance issues. Access a 30-day free trial.
- Paessler PRTG Network Monitor (FREE TRIAL) A unified network monitoring tool that can monitor network hardware, applications, servers, services, and more. It comes with a threshold-based alerts system. Get the 30-day free trial.
- WhatsUp Gold A network monitoring platform that monitors the performance and availability of network elements. It includes an autodiscovery feature that creates a topological map of your network.
- Pulseway A remote monitoring and management platform that can monitor the performance of devices and applications. The user can automate administrative tasks and patch Windows/third party applications.
- Datadog Cloud-based application and service monitoring tool with analytics. The software has integrations for all the top cloud-service and SaaS providers on the market.
The best system monitoring software
1. NinjaOne (FREE TRIAL)
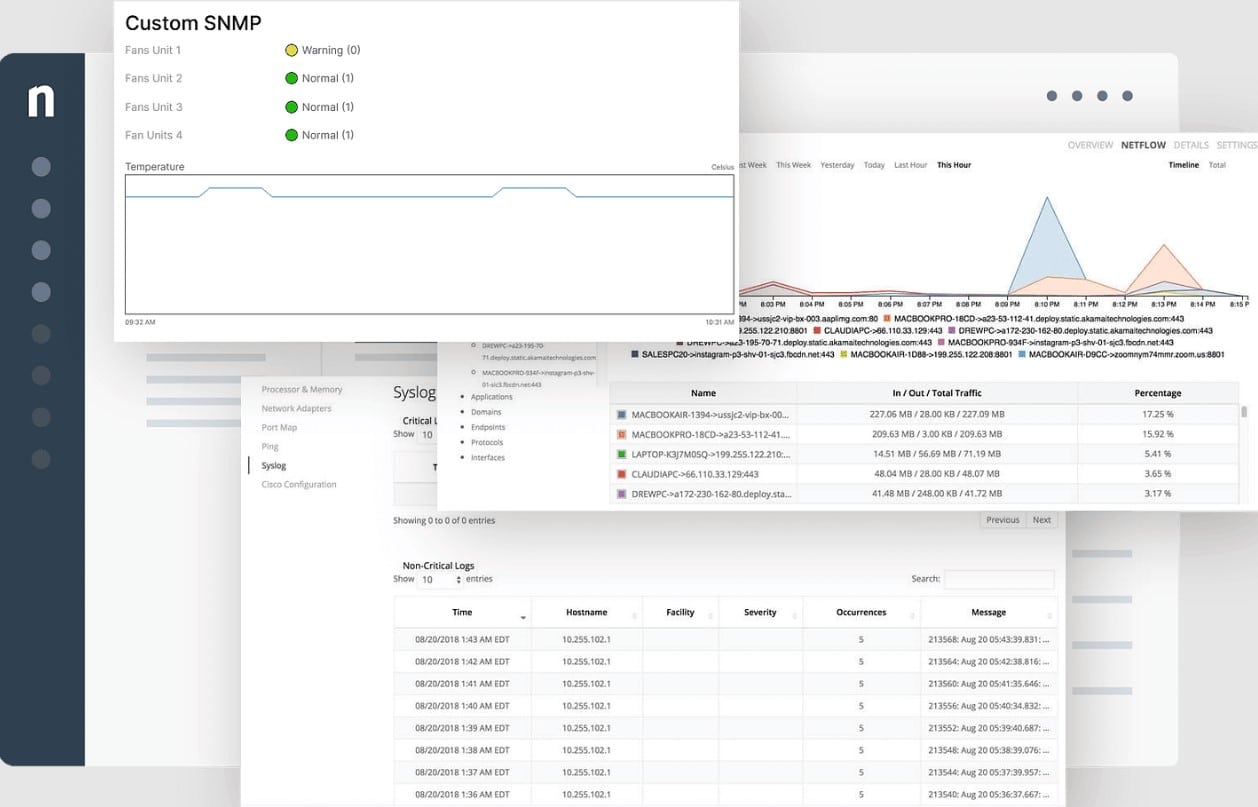
NinjaOne is a proactive IT management platform that offers real-time insights into the health and performance of your devices. It can monitor all kinds of endpoints through a single platform and can send customizable alerts when the metrics deviate from the established threshold. Along with the alerts, NinjaOne also sends contextual information to support troubleshooting. These alerts are sent through multiple channels, like email, SMS, Teams, Slack, and more.
NinjaOne comes with 100+ monitoring templates that come in handy for detecting issues and sending alerts. It also offers automated workflows to remediate the first level of issues after an alert is raised to quickly address basic issues and reduce manual intervention.
A notable aspect of this tool is its intuitive dashboard, which displays information about all endpoints in a single view. You can further drill down into the metrics as required. Such a consolidated display of information helps you better understand the relationships and dependencies, which eventually can speed up troubleshooting. Start a 14-day free trial.
EDITOR'S CHOICE
NinjaOne is our top pick for the best system monitoring software due to its wide range of capabilities that help you stay on top of the health and performance of every endpoint that connects to your network. Its monitoring templates, coupled with customizable alerts, point you to the most critical issues in your infrastructure, so you can prioritize them and use your resources effectively. At the same time, it reduces the chances of alert fatigue and false positives. Other features, like automated response management and unified dashboards, make NinjaOne our top choice.
Download: 14-day FREE Trial
Official Site: https://www.ninjaone.com/freetrialform/
OS: Cloud-based
2. SuperOps RMM – FREE TRIAL
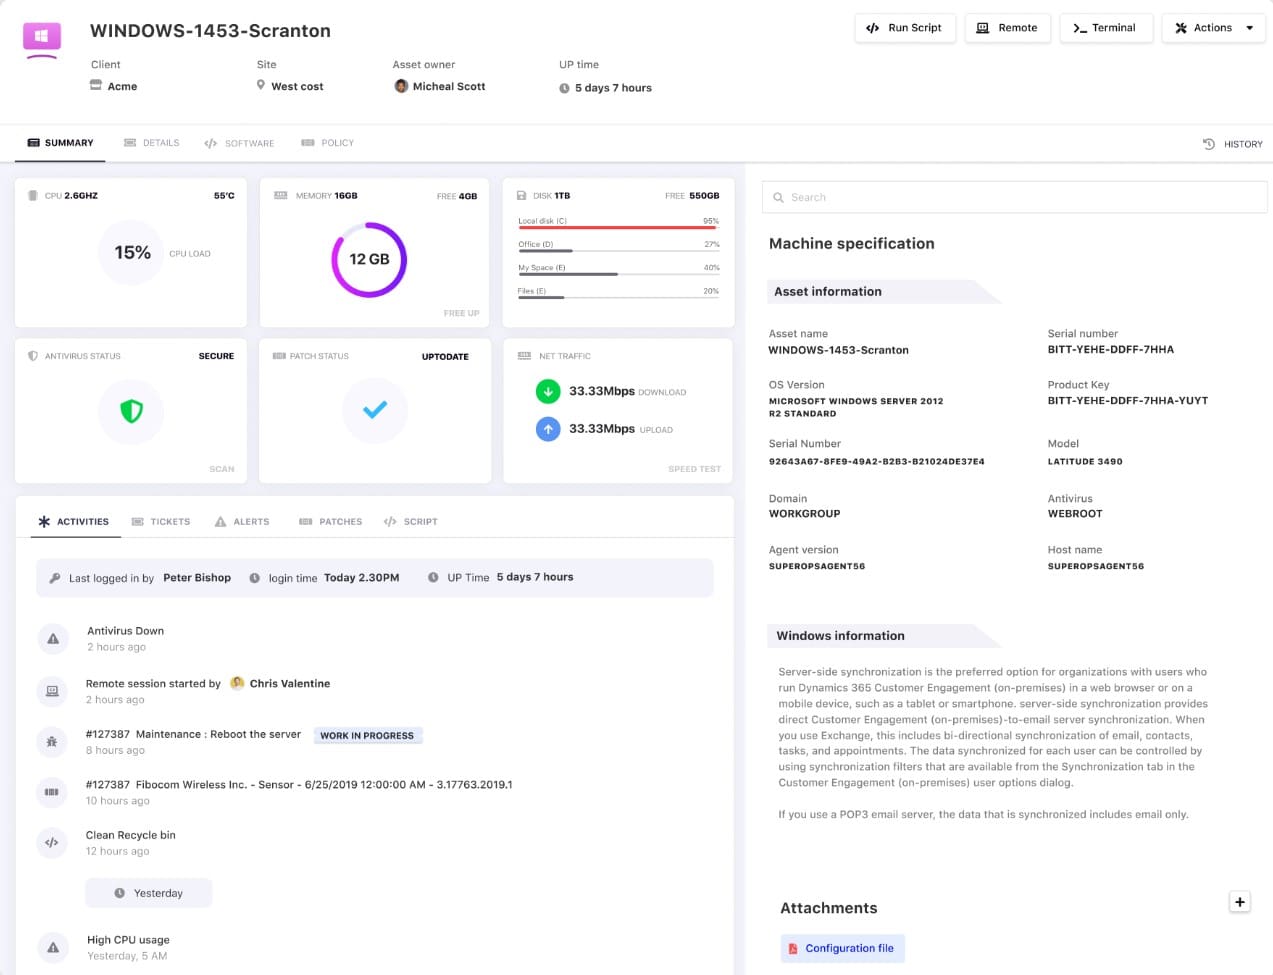
SuperOps RMM provides a remote monitoring and management service for IT assets. It is offered as a standalone package or in combination with a bundle of professional services automation (PSA) systems. The RMM and PSA systems are suitable for use by managed service providers. The RMM system on its own could be used by an IT department for in-house device management.
The RMM downloads an agent onto a server on the monitored site. This scans the network and sends back details of all of the systems connected to it. This includes network devices, workstations, and servers. The information that SuperOps gathers is compiled into a hardware inventory. This list includes information on each device.
The inventory forms the basis of continuous monitoring. The SuperOps agent repeats its network search and gathers current statuses for each device. The system compares current statuses with the record of component capacities to identify overloading. For example, the tool records current CPU usage and compares that to the known total capacity.
If full capacity utilization is approaching, the system monitoring service raises an alert. This draws the attention of technicians to that particular device so that actions can be taken to reduce stress. This mechanism means that technicians don’t have to watch all devices all of the time. With this mechanism, technician efficiency is increased. This is how managed service providers can monitor multiple sites simultaneously at a lower cost per site than their client businesses could achieve by themselves.
SuperOps is a subscription system with a rate per technician per month. There are four plans. These are Standard (PSA Only) at $79, Standard RMM ONLY for $99, Pro Unified Basic for $129, and Pro Unified Advanced at $159 per month. The system is available for a 14-day free trial.
3. ManageEngine OpManager (FREE TRIAL)

ManageEngine OpManager is a free network monitoring tool for Windows and Linux, that can monitor devices in real-time. The tool comes with more than 2000 performance monitors. It can monitor the CPU, memory, and disk utilization of physical and virtual servers.
The dashboard is where the majority of performance monitoring takes place. The dashboard is customizable with over 200 different performance widgets you can use to change your perspective. Once a metric goes beyond normal parameters then ManageEngine OpManager sends you an email or SMS alert.
ManageEngine OpManager is free for up to three devices. There are three paid versions of ManageEngine OpManager available to purchase: Standard Edition, Professional Edition, and Enterprise Edition. The Standard Edition starts at $245 (£189) for 10 devices up to 1000 devices maximum.
The Professional Edition starts at $345 (£266) for 10 devices up to 1000 devices with additional features like virtual discovery and a discovery rule engine. The Enterprise Edition costs $11,545 (£8,930) for 250 devices with a maximum device count of 10,000. You can download the 30-day free trial.
4. Site24x7 (FREE TRIAL)
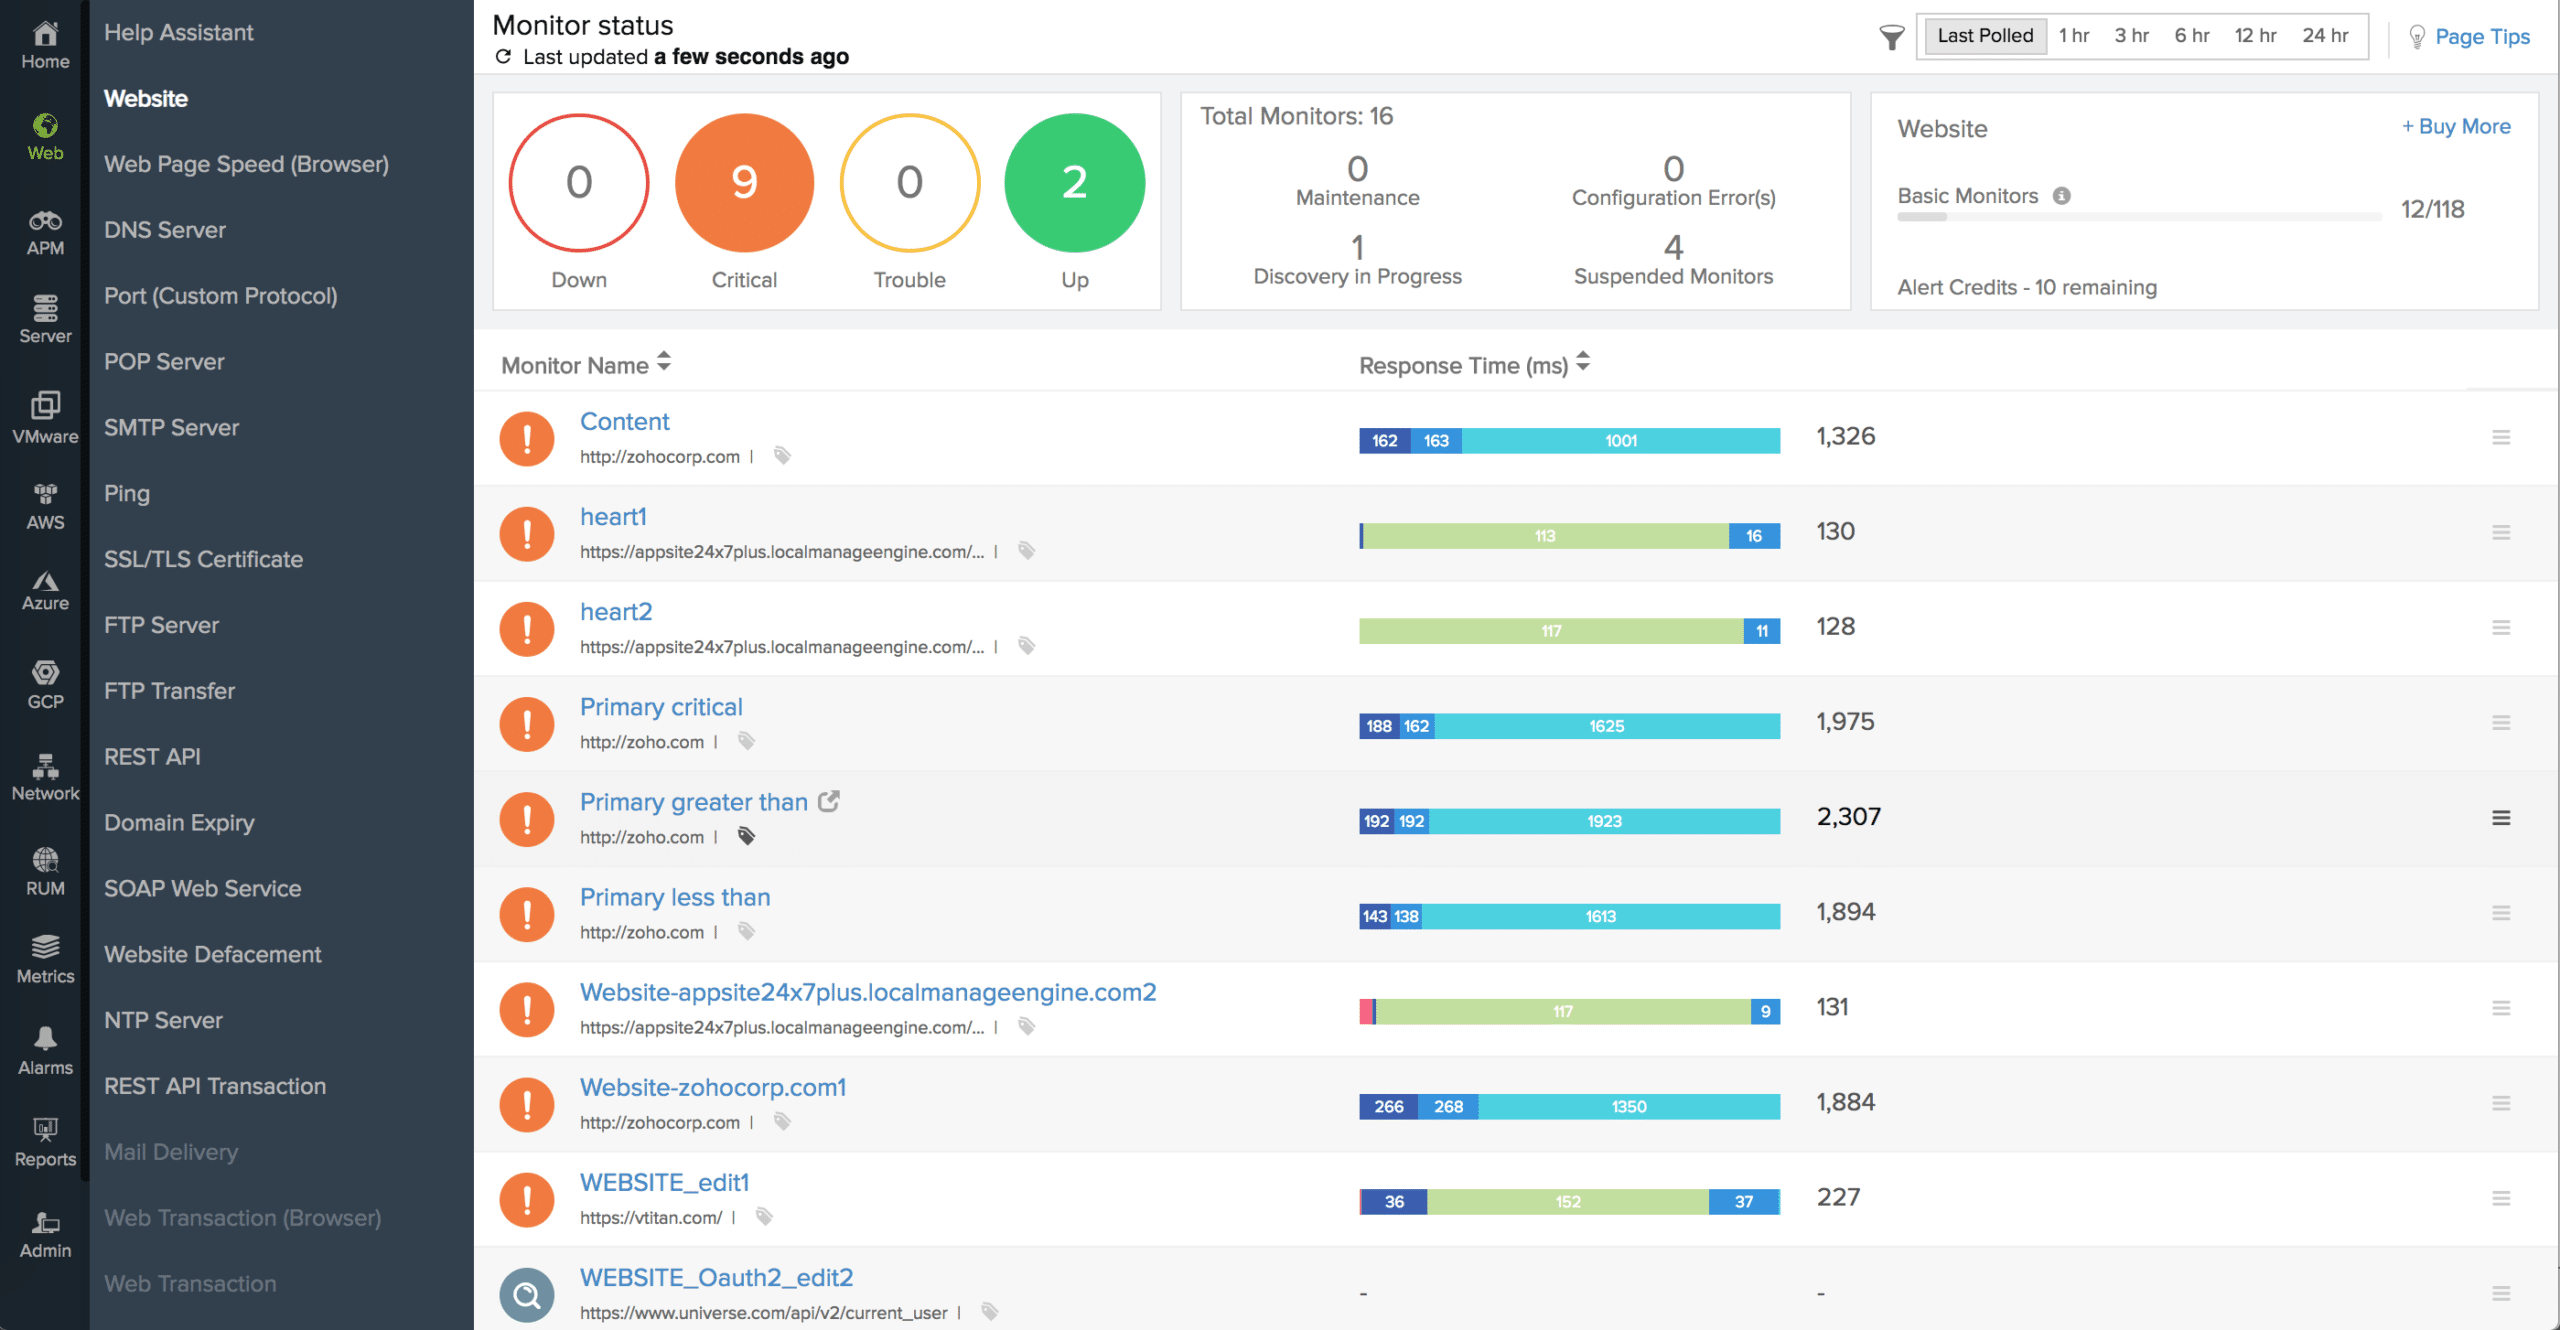
Site24x7 is a website monitoring, server monitoring, application monitoring, and network monitoring solution package. You can monitor Windows and Linux servers. There are also 50 integrations for services including MySQL, Apache, and Nagios. You can even create your own plugins with Python, PowerShell, and Shell.
For general network monitoring, it has an autodiscovery feature, which scans by IP range. You can then view the scanned devices through a map. There are over 4,000 device templates that you can use to monitor connected devices. Through the dashboard, you can monitor the health and response time of connected devices.
There are four versions of the All-in-One Site24x7 package available: Pro, Classic, Elite, and Enterprise. The Pro version costs $35 (£28) per month for 40 basic monitors and three advanced monitors. The Classic version costs $89 (£71) per month for 100 basic monitors and five advanced monitors.
The Elite version costs $225 (£180) per month for 250 basic monitors and 10 advanced monitors. The Enterprise version costs $449 (£359) with 500 basic monitors and 25 advanced monitors. You can sign up for the 30-day free trial.
5. Paessler PRTG Network Monitor (FREE TRIAL)

Paessler PRTG Network Monitor is a network and system monitoring tool that can monitor Windows, Linux, and Mac systems. It can measure SNMP, WMI, SSH, Ping, and network traffic. The software is simple to configure and you can discover devices by pinging by IP range. After discovering your devices you can view your network as a real-time map with 300 different map objects.
You can monitor your network through a web-based user interface with a dashboard, desktop app, or mobile app for iOS and Android. All versions offer alerts in the form of email, SMS, slack messages, HTTP requests, and more. There are also push notifications for iOS and Android applications.
To take a closer look at performance data you can also generate reports. You can create reports in formats including PDF, HTML, CSV, and XML. You can create reports manually or you can schedule them to run automatically daily, weekly, or monthly. Scheduling allows you to check up on progress over time.
PRTG Network Monitor is free for users monitoring with less than 100 sensors making it a great choice for smaller enterprises in the market for affordable system monitoring software. For more sensors, you can purchase a paid version, Paid versions start at $1,600 (£1,237) for 500 sensors and one server installation. You can download the 30-day free trial version.
6. Progress WhatsUp Gold

Progress WhatsUp Gold is a piece of network monitoring software that allows you to automatically discover and monitor network devices, servers, applications, and virtualized services. On the dashboard, you can switch between Wireless, Cloud, Storage, Core Network, and Wireless Network infrastructure to see which devices are Up or Down.
There is also a customizable alerts system. Through the Alert Center Dashboard, you can configure notification policies to determine when the system generates an alert. For example, you can configure alerts to trigger when interface utilization exceeds 90% or ping response time exceeds 50 ms.
WhatsUp Gold also has a range of IP address management features. You can create an inventory of all devices with an IP address and generate reports by devices based on type. IPAM is useful for discovering problem IP addresses or free addresses.
There are two versions available to purchase: Premium Edition and Total Plus Edition. The Premium Edition includes wireless and cloud storage monitoring. The Total Plus Edition also has network traffic analysis, virtualization monitoring, and application monitoring. To view the pricing information you need to contact the company directly. You can download the free trial version from this link here.
7. Pulseway
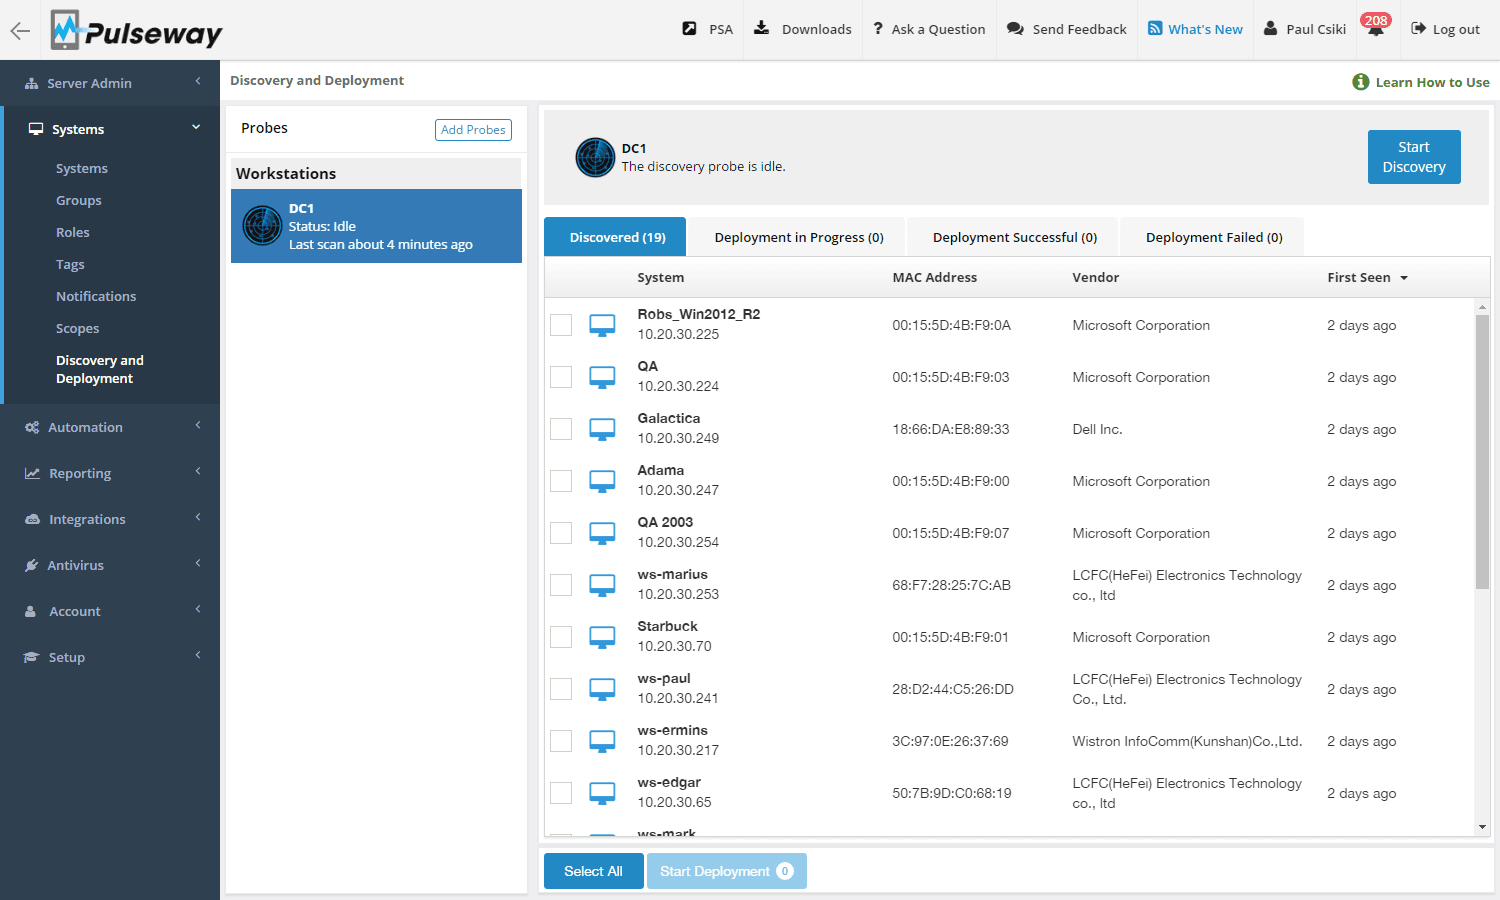
Pulseway is an IT and system management platform that can monitor Windows, Linux, and Mac. With Pulseway you can view the real-time status of devices and servers. For example, for SQL Server you can monitor the status of databases, users, processes, and more.
Customizable email notifications update you on network performance. You can choose the trigger conditions for alerts. For example, configure a rule to send an alert if the available space of a device drops below a specific percentage. You can also create a custom HTML email template with your company logo to add your branding to your alerts.
Pulseway also has a range of task management capabilities including the ability to configure tasks to run on machines. For example, you can run Windows updates or restart a computer remotely. The software is available for desktop, mobile, and tablet devices so you can monitor your network no matter where you are.
There are three versions of Pulseway available to purchase: Free, Starter, and Team. The Free version is free for two endpoints. The Starter version supports up to 19 endpoints with features including automation and OS patch management. The Team version supports over 20 endpoints with white labeling and third-party patching. You can start the free version of Pulseway from this link here.
8. Datadog

Datadog is a cloud-based system, application, and service monitoring platform with over 350 integrations out-of-the-box. There is integration for services including AWS, Azure, Active Directory, Oracle, PostgreSQL, and SQL Server. The performance data of connected services can be monitored through the dashboard. On the dashboard, you can monitor services in real-time. Dashboards are customizable and offer a range of graphs.
The application monitoring capabilities of Datadog provide in-depth visibility into performance through a service map. The service map allows you to view data flows and view interdependencies in real-time. The map makes it easier to find the root cause of performance problems when an application isn’t performing well.
The alerts system allows you to configure notifications for email, PagerDuty, Slack, and more. The configuration options also allow you to set multiple trigger conditions to fine-tune the notifications you receive. Automated outlier detection automatically detects anomalous behavior and notifies you.
There are three Infrastructure versions of Datadog available to purchase: Free, Pro, and Enterprise. The Free version supports up to five hosts. The Pro version costs $15 (£11.60) per host, per month and includes integrations. The Enterprise version costs $23 (£17.79) per host, per month with machine learning alerts and premium support. You can start the 14-day free trial from this link here.
Manage Your Network Efficiently with System Monitoring Software
Managing networks is growing more complex by the day. Modern companies aren’t just managing computers anymore but a range of physical devices and services that all need to be monitored. Adopting the right system monitoring software is critical to maintaining visibility over the infrastructure that employees depend on to do business every day.