Network administrators have access to network resources thanks to SharePoint administrator tools that include performance monitoring. This translates to better troubleshooting and a better end-user experience.
SharePoint, as one of the most extensively used website development, document management, and storage solutions, includes a staggering variety of functions.
Servers, farms, and applications all play a role in delivering the SharePoint services that modern businesses are accustomed to. However, to provide a steady service, each of these components must be controlled correctly.
You can use a SharePoint administrator tool to keep an eye on these components for issues like latency and perform more extensive troubleshooting if one is discovered. When even minor performance issues can have a significant impact on end-users, it’s even more critical to monitor SharePoint performance.
The Best SharePoint Administrator Tools
Here are the most reliable and famous SharePoint tools in the market at the moment:
1. SolarWinds Server & Application Monitor (FREE TRIAL)
SolarWinds Server & Application Monitor is an application monitoring solution for SharePoint performance management. You can use this tool to troubleshoot the reason for slow page load times and latency. SolarWinds offers a variety of different tools that help sysadmins manage their networks, monitor Microsoft products, and manually test networks.
Depending on their location, server infrastructure, and application, issues might be segregated. All of this data is presented to you in a dashboard manner, with tables and meters displaying critical parameters. Requests per second, request wait time, throughput, and refused requests are among the key metrics analyzed by SolarWinds Server & Application Monitor.
When combined, this data provides you with everything you need to assess the performance of SharePoint resources. SolarWinds Server & Application Monitor has a natural integration with SolarWinds Web Performance Monitor for the most effective troubleshooting.
Pros:
- Large and business networks are the focus of this design.
- Supports auto-discovery, which generates real-time network topology maps and inventory lists depending on devices that join the network.
- Has some of the greatest alerting tools that strike a good mix between effectiveness and usability.
- Supports both SNMP monitoring and packet analysis, offering you greater monitoring control than similar solutions.
- Customizes the look and feel of the dashboard by dragging and dropping widgets.
- Pre-configured compliance templates and a robust reporting system.
Cons:
- Because this is a feature-rich corporate application developed for sysadmins, completely exploring all options and features may take some time.
SolarWinds Server & Application Monitor is a wonderful solution if you’re searching for a lightweight and easy-to-use SharePoint monitoring tool. SolarWinds Server & Application Monitor is available for $2,995 (£2,308). There is also a free 30-day trial version available.
Website Link: solarwinds.com/server-application-monitor/
2. ManageEngine SharePoint Plus Manager Plus (FREE TRIAL)
ManageEngine SharePoint Manager Plus is a management solution for SharePoint that was created with SharePoint in mind. The user can create groups and configure individual or batch user permission modifications using this web-based tool. SharePoint Usage Analytics can be used to track SharePoint usage. Search reports and traffic reports are the two types of usage metrics.
Users can see a list of their most popular search keywords and the frequency of item searches in their search reports. Rank reports also show you the most popular sites (based on hits) and pages (by page views and unique visitors). Audit reports are available in XLS, CSV, PDF, and HTML formats, making them easy to share with others in your team.
For Windows, ManageEngine SharePoint Manager Plus is available for download. This is one of the greatest solutions on this list for SharePoint management in particular. There are many more tools that are a better match if you’re seeking a performance monitoring solution.
Pros:
- Built exclusively for SharePoint, it works nicely with current organizational structures and permissions sets in SharePoint.
- Prebuilt reports in the Usage Analytics section can be used to track SharePoint performance and usage.
- Query performance can be improved based on a user’s search history.
- The web portal can be accessed from anywhere.
Cons:
- Infrastructure monitoring and baseline analysis are missing from some performance monitoring tools.
- The UI, particularly around the permissions section, might be modified to make it easier to browse.
ManageEngine SharePoint Manager Plus comes in three flavors: Trial Edition, Standard Edition, and Professional Edition. The Trial Edition has all of the features of the Professional Edition and is available for 30 days.
The Standard Edition is a limited edition that costs $945 (£728) and comes with 50 reports out of the box. For $1195 (£921), the Professional Edition has all of the functionality of the Standard Edition plus permissions management. You can access a 30-day free trial.
Website Link: https://www.manageengine.com/sharepoint-management-reporting/download.html
3. Paessler PRTG Network Monitor (FREE TRIAL)
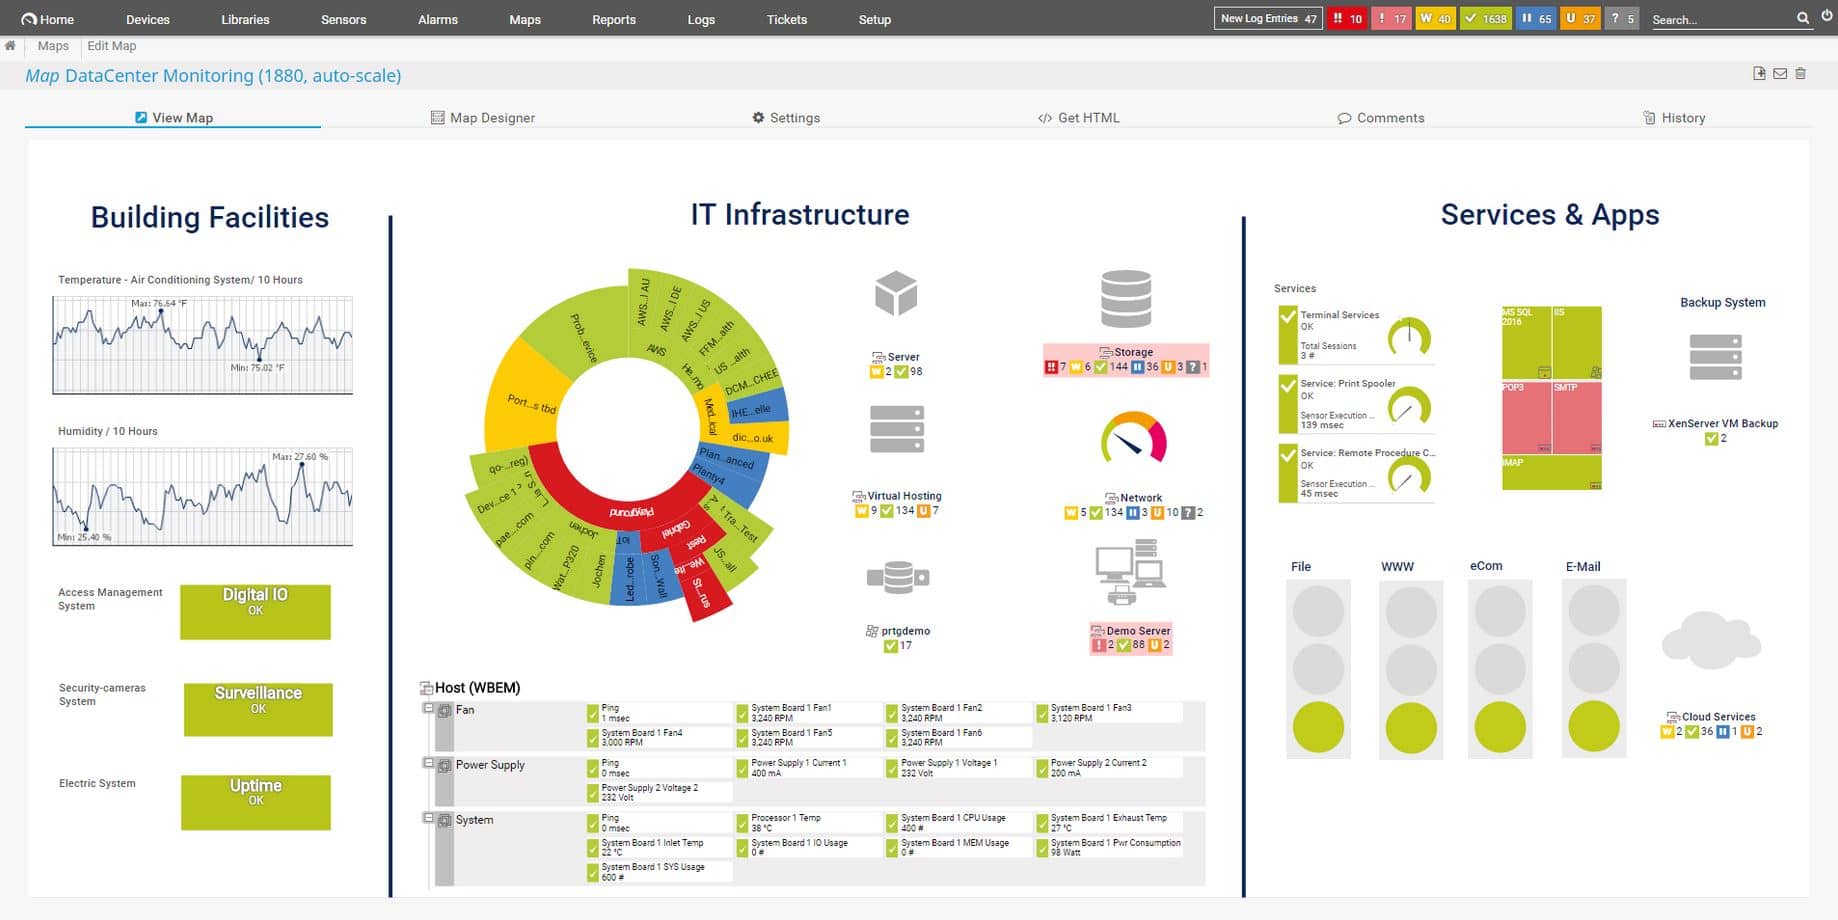
PRTG Network Monitor is a monitoring platform for infrastructure that can track SharePoint servers and apps. PRTG Network Monitor comes with SharePoint Server sensors that may be adjusted to measure the performance of linked servers.
The WMI SharePoint Process Sensor, for example, is a sensor that is specifically built to monitor SharePoint servers. The WMI SharePoint Process Sensor allows you to keep track of the number of current page requests, active threads, SQL queries executed, CPU usage, global heap size, template cache size, and more.
Other preset sensors that can monitor SharePoint resources include the Windows IIS Application Sensor and the PerfCounter IIS Application Pool Center.
Alerts are also monitored for each sensor. One of PRTG Network Monitor’s best features is the alerts system. When a sensor’s predefined threshold is exceeded, the user receives an alert. For example, if a SharePoint server’s CPU use exceeds a specified threshold, the user is notified via email, SMS, or push notification. You may customize all thresholds so you can choose when and how you want to be notified.
Pros:
- To report network performance metrics, it employs a combination of a packet sniffer, WMI, and SNMP.
- Both lone administrators and NOC teams will benefit from the fully customized dashboard.
- It’s simple to create custom views and reports with the drag and drop editor.
- Supports a variety of alert methods, including SMS, email, and third-party connections to platforms such as Slack.
- Each sensor is tailored to monitor a certain application; for example, there are sensors made expressly to capture and monitor VoIP activities.
- Supports the use of a freeware version.
Cons:
- Is a large platform with a lot of features and moving pieces that take some time to learn.
PRTG Network Monitor is free for up to 100 sensors, making it an excellent choice for small businesses. PRTG Network Monitor’s paid versions start at $1600 (£1,233) for 500 sensors. The pricing structure is flexible and can be scaled up or down based on the number of sensors and server installations you need. A 30-day free trial edition is also available.
Website Link: https://www.paessler.com/download
4. SPDocKit

SPDoCK It’s a SharePoint administrative tool that includes auditing and analytics. This program can create SharePoint documentation, best practice reports, audit reports, analytics reports, and rights management.
You can eliminate the requirement to manually paste data into the platform by creating farm documentation. This is accomplished by scanning your network and extracting configuration settings from SharePoint resources. All of this data is then compiled into a Word, Excel, or PDF document.
SPDocKit gives you a real-time view of user permissions when it comes to managing them. This is displayed in a table that includes the names of users as well as the rights they have. In just a few clicks, you may create and delete SharePoint groups as needed.
SharePoint Analytics and Usage Reports are the capabilities that allow you to keep track of your SharePoint usage. You can view usage data such as the number of hits per farm, site, or subset, the time of last assessment, and the list of site visitors using SharePoint analytics. This data is presented to you in the form of tables and meters.
Farm and Consultant are the two major pricing categories for SPDocKit. Farm packages are designed for people in charge of on-premises farms. Consultant packages, on the other hand, are for businesses that work with clients.
Pros:
- Designed primarily for SharePoint audits and management.
- Best-practice reports, permission audits, and analytics insights are all pre-installed.
- Designed for enterprise use and bigger SharePoint setups.
Cons:
- Infrastructure, network statistics, and any applications other than SharePoint are not monitored.
- When compared to similar tools on the market, the price is fairly steep.
An annual Farm subscription costs $2,499 (£1,926) per farm. If you wish to add SysKit Insights to your production farm, the price jumps to $3,499 (£2,697). The annual Consultant subscription is $1,999 (£1,541). You may also get a free trial version of the software.
Website Link: https://www.syskit.com/products/spdockit/download/
5. GSX Monitor and Analyzer

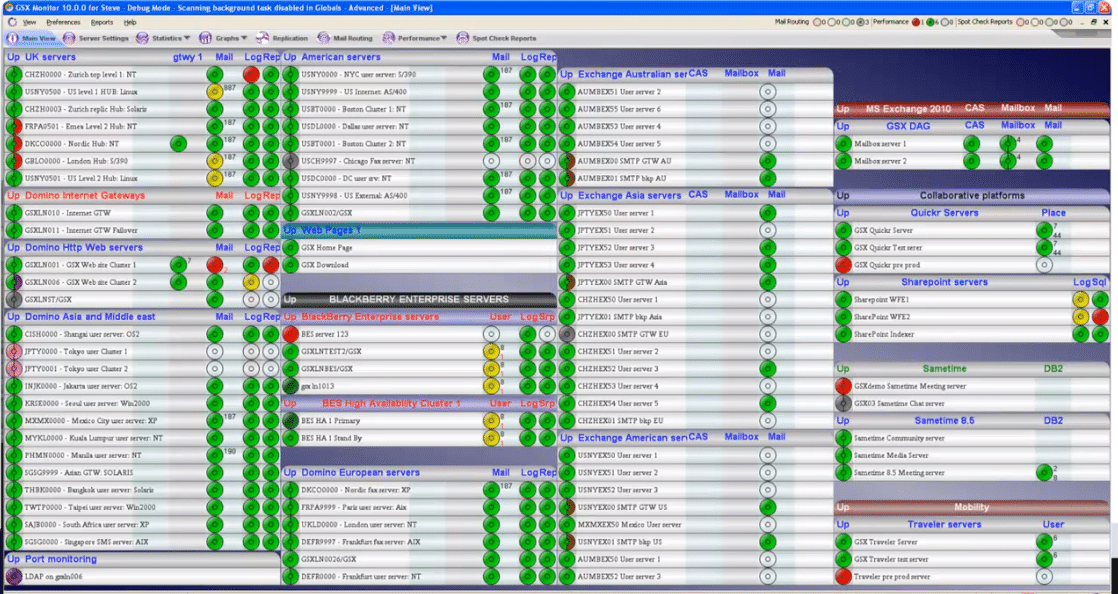
GSX is a SharePoint performance monitoring tool that works with SharePoint 2007, 2010, 2013, and Office 365. This utility automatically discovers all SharePoint servers that are connected.
The SharePoint Overview display shows the status of your servers divided down into distinct roles once they’ve been discovered. SQL servers, applications servers, and web front-end servers are the three types of servers.
The monitoring experience provided by GSX is smart enough to detect and troubleshoot a wide range of SharePoint performance issues. Latency, mail connectivity, and DNS resolution are just a few of the parameters that GSX may track. You can, for example, make a graph of a SharePoint web service’s response time.
You may set up profile alerts for even more control. To keep you informed about changes to SharePoint, alerts are issued by email, SMS, pager, pop-up messages, and SNMP traps. If there is no response, alerts can be prioritized by severity and escalated to another member of staff.
Pros:
- It’s possible to discover SharePoint servers for processing automatically.
- Can track a variety of parameters, from resource use to latency, and help you avoid downtime and problems before they happen.
- SMS, SNMP traps, and API integrations into third-party tools are all supported by alerting.
Cons:
- Users want to see a longer trial time.
- It cannot monitor infrastructure, network statistics, or other apps other than SharePoint.
GSX provides a good mix of SharePoint performance monitoring and administration features. GSX is one of the standout tools on our list because of the combination of the two. The cost of GSX Monitor & Analyzer per server, per year, is $1,010 (£778.60). You may also get a 14-day free trial.
Website Link: https://www2.martellotech.com/free-trial-for-m365-monitoring.html
6. eG Enterprise

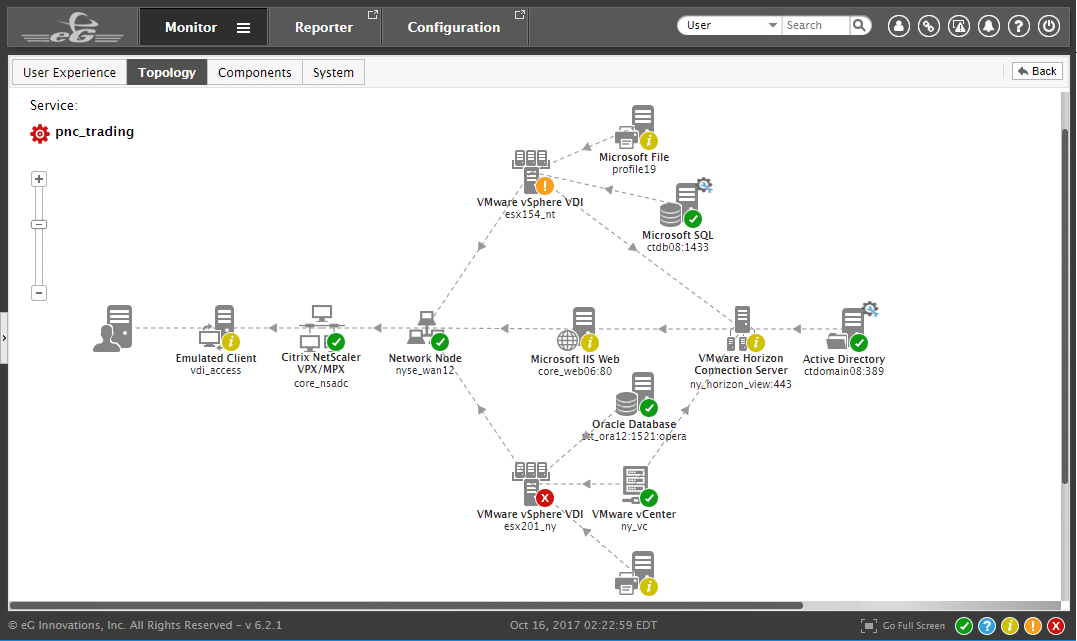
Another popular SharePoint monitoring solution is eG Enterprise. Sites, web applications, web components, databases, logs, and events may all be monitored using this tool. All of this data is accessible through a single user interface.
You can check the availability of SharePoint services to ensure that none of your critical services have gone down. Real-time user monitoring is also available, allowing you to assess the quality of the user experience provided on your site. To put it another way, you can detect performance issues before your end-user.
eG Enterprise automatically finds SharePoint apps and infrastructure dependencies so you can respond to issues quickly. This infrastructure can be visualized as a map that depicts how each service relates to the next.
eG Enterprise is available in a range of configurations, from cloud-deployed to on-premises solutions. There’s a free cloud-based Easy Evaluation package, an on-premises Perpetual License, an on-premises Subscription version, a SaaS cloud-based version, and a cloud-based Audit Service.
Pros:
- Allows you to monitor your SharePoint servers and services in a highly visual manner.
- Dependencies and bottlenecks in your system can be visualized using topological maps.
- User experience measurements are highly accurate when real-time monitoring is used.
- Both on-premise and cloud-based implementations are possible.
Cons:
- Pricing isn’t clear; you’ll have to ask the sales team for a quote.
- Onboarding and configuration can be time-consuming.
- The learning curve is steeper than that of similar tools.
Website Link: https://www.eginnovations.com/it-monitoring/free-trial
7. Metalogix Diagnostic Manager

Another SharePoint administrator tool and performance monitoring solution is Metalogix Diagnostic Manager. SharePoint Server 2016, Server 2013, Foundation 2013, Server 2010, Foundation 2010, Windows SharePoint Services 3.0 SP1 or later, and Microsoft Office SharePoint Server 2007 SP1 or later are all supported by Metalogix Diagnostic Manager. It’s incredibly simple to keep track of the health of SharePoint resources.
You can see the health status of SharePoint divided down into multiple areas on the dashboard. For example, a pie chart depicting the status of Farms, Server Groups, Servers, and Pages in isolation is available. Resources are labeled as Critical, Warning, or Ok so you can choose whether or not you need to take action.
You can, however, set up notifications to keep you informed automatically. Performance criteria are used to configure alerts in Metalogix Diagnostic Manager. Notifications will alert you if a critical service is unavailable or if the content is growing. Regardless of whether resources are on-premises or in the cloud, alerts are issued.
Pros:
- Provides simple SharePoint monitoring, with compatibility for versions as old as SPS 2007.
- Metrics can be sorted by farm, servers, pages, and groups.
- The Diagnostic Manager is a simple way to keep track of your SharePoint system’s overall health and performance.
Cons:
- For price information, please contact sales.
- It also doesn’t permit extra monitoring outside of SharePoint.
Metalogix Diagnostic Manager is one of the more accessible SharePoint administrator tools on this list due to its simplicity and health monitoring functions. You must contact the sales staff directly to obtain the price of this product. However, a free trial edition of Metalogix Diagnostic Manager is available for download.
Website Link: https://www.quest.com/register/117133/
End Note
To summarize, SharePoint is a widely-used platform for document sharing and collaboration. Its popularity has grown in recent years as a result of the epidemic and the associated work-from-anywhere mentality. SharePoint, on the other hand, is a sophisticated platform with thousands of customizations, and managing a SharePoint installation may quickly spiral out of control.
This is where SharePoint management and administration tools are helpful. We’ve covered some of the most popular tools on the market today, and we recommend SolarWinds Server & Application Monitor for its comprehensive capabilities that cover every area of SharePoint setup and management.


