If you’re looking to monitor and enhance your troubleshooting capabilities for your Python projects, you’re in the right place. In this article, we’ll break down some of the best Python monitoring tools you can use today.
Here is our list of the best Python monitoring tools:
- ManageEngine Applications Manager (FREE TRIAL) This monitoring system is able to track the performance of web apps and APIs that are written in a range of programming languages, including Python. Available for Windows Server and Linux.
- Site24x7 Application Performance Monitoring (APM) (FREE TRIAL) This cloud platform provides full stack monitoring and is available in packages for IT departments and MSPs. Available for a 30-day free trial.
- Datadog Python Application Performance Ideal for dev teams and businesses that need feature-rich monitoring with prebuilt and customizable templates.
- Retrace APM Provides code level tracing and easy-to-use tools for isolation.
- New Relic Automatically maps out your network to discovery dependencies.
- AppDynamics A full feature performance monitor that works with Python and dozens of other apps.
- Scout APM Very lightweight and simple to install.
- Dynatrace Provides detailed topology of your applications with geographic data.
- Atatus Drills down right to the source code level from the dashboard to highlight issues.
- Prometheus Open-source application monitor with full HTTP API integrations.
- Sentry.io Cloud-based APM with Breadcrumb event tracking features.
- Metricly Uses anomaly detection to help prevent false positives.
Our methodology for selecting the best Python monitoring tools
We’ve broken down our analysis for you based on these key criteria:
- Real-Time Monitoring: The tool must provide real-time tracking of Python applications to ensure immediate detection and resolution of issues.
- Comprehensive Metrics: The tool should offer extensive metrics including performance, errors, resource usage, and other relevant data.
- Ease of Use: User-friendly interface and easy integration with existing systems to minimize the learning curve.
- Alerting System: Robust alerting mechanisms to notify users of performance anomalies or errors promptly.
- Scalability: The tool must be scalable to accommodate growth in application size and user base without compromising performance.
The best Python monitoring tools:
1. ManageEngine Applications Manager (FREE TRIAL)
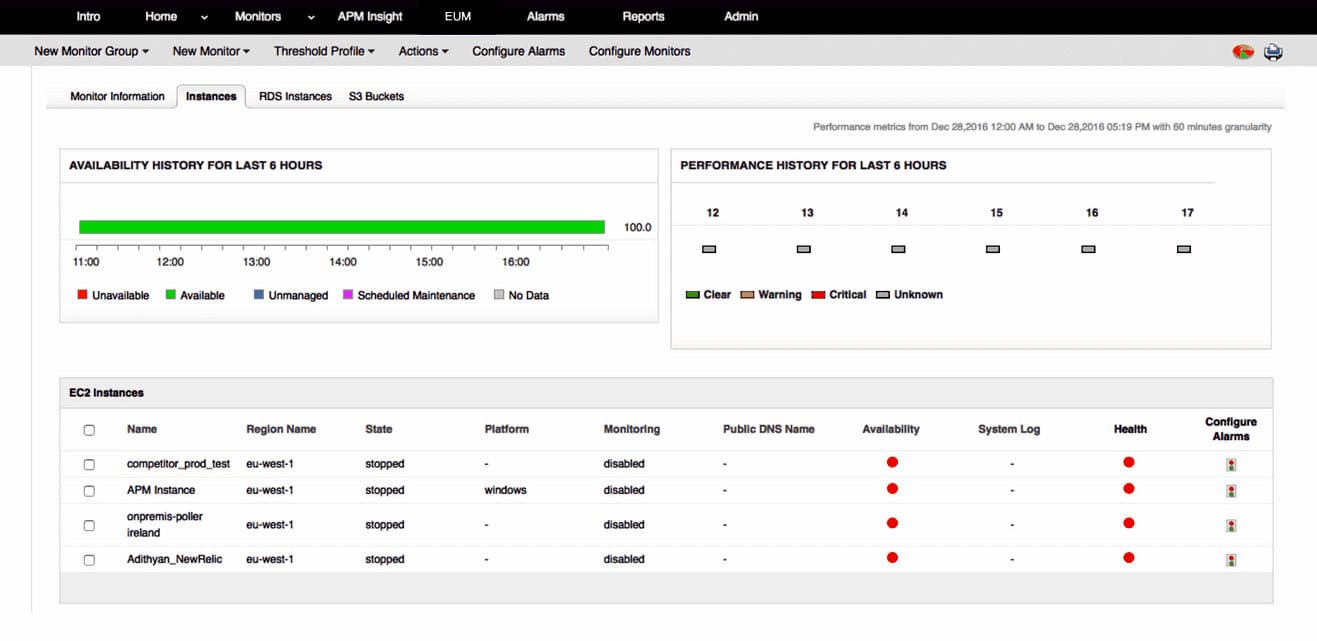
ManageEngine Applications Manager is a performance monitor for applications and the server resources that support them. It is particularly strong at monitoring the performance of websites, web services, and the frameworks that contribute towards their functionality. It is able to trace the execution of code in a range of programming languages, including Python.
Key Features:
- Application Dependency Mapping: Identifies and maps interlinked applications and their hosting locations.
- Code Execution Tracing: Monitors and traces code execution in multiple programming languages, including Python.
- Cloud and Microservices Monitoring: Extends monitoring capabilities to cloud-based services and microservices.
- Resource Allocation Insight: Predicts resource needs and spots potential shortages before they cause issues.
- Synthetic Monitoring: Performs automated tests to check availability, response times, and interactive elements of web pages.
Why do we recommend it?
ManageEngine Applications Manager earns its recommendation as a robust performance monitoring solution, excelling in overseeing websites, web services, and associated frameworks. With the ability to trace code execution in multiple languages, including Python, it provides a comprehensive view of application performance. Its application dependency mapping is a standout feature, offering insights into interlinked modules and the hosting of programs, ensuring a detailed understanding of system interactions. ManageEngine Applications Manager goes beyond local environments, extending its monitoring prowess to cloud-based services and microservices, making it a versatile tool for tracking Python code execution regardless of its hosting location.
The Applications Manager includes a system that identifies all of the applications on a system and works out how they link together. With this information, it creates an application dependency map. This shows which systems call other modules and where those programs are hosted. It is also able to drill down to system services and the operating system as well.
The capabilities of the Applications Manager extend to watching the performance of cloud-based services and micro services that lie behind APIs. So no matter where the Python code is hosted, the Applications Manager will track it down and trace its execution. The system is able to work out what resources each module will need in order to run. This gives it the ability to spot when system resource shortages are about to cause performance impairment.
By chaining back through the application dependency map, the Applications Manager is able to issue alerts that show an impending problem and then indicate the root cause of that issue. Services that the monitor will watch and trace through include virtual infrastructure, servers, and databases.
As well as providing automated monitoring and tracing services, the Applications Manager includes system testing services. These include availability checks and response time monitors. The system also includes synthetic monitoring services that can exercise interactive elements in web pages so that possible errors can be revealed. These tests can be linked into the application dependency map to see where each action in a web page is going to hit system resources.
Who is it recommended for?
ManageEngine Applications Manager is recommended for businesses and IT professionals seeking a versatile and in-depth Python monitoring tool. Ideal for those managing websites, web services, and frameworks, it caters to diverse use cases. Its proficiency in tracing code execution makes it valuable for developers, while the application dependency map aids system administrators in understanding and optimizing system interactions. Additionally, its cloud and microservices monitoring capabilities extend its relevance to organizations leveraging modern infrastructure. Whether for performance optimization, issue identification, or synthetic monitoring, ManageEngine Applications Manager is suitable for a broad spectrum of users and scenarios.
Pros:
- Comprehensive Monitoring: Tracks the performance of websites, web services, and frameworks.
- Detailed Insights: Application dependency mapping provides a clear view of system interactions.
- Versatile Code Tracing: Supports multiple programming languages, including Python.
- Proactive Alerts: Issues alerts for impending problems and identifies root causes.
- Cloud Compatibility: Monitors both on-premises and cloud-based services effectively.
Cons:
- Complex Setup: Initial configuration may be complex for some users.
- Cost: Professional and Enterprise editions may be costly for small businesses.
- Limited Free Version: The Free version is restricted to five monitors, which may not be sufficient for all users.
- On-Premises Requirement: Requires installation on Windows Server or Linux, which might not suit all environments.
ManageEngine Applications Manager is delivered as on-premises software that will install on Windows Server or Linux. It is offered in three editions: Free, Professional, and Enterprise. The Free version is limited to five monitors. The Professional service can monitor up to 500 applications and the Enterprise edition is intended for multi-site businesses that require distributed monitoring services. You can get a 30-day free trial of this package.
2. Site24x7 Application Performance Monitoring (APM) (FREE TRIAL)

The Site24x7 Application Performance Monitoring (APM) system is part of a cloud platform that offers full stack monitoring. You also get network, server, and cloud platform monitoring with the packages that include the APM.
This tool provides code profiling for running web applications and it is able to step through text-based code written in Python, Java, .NET, PHP, Node.js, and Ruby on Rails. The system is also able to track the activities of compiled packages through distributed tracing.
Key Features:
- Code Profiling: Supports multiple languages, including Python, Java, .NET, PHP, Node.js, and Ruby on Rails.
- Real User Monitoring (RUM): Integrates seamlessly to identify performance issues from real user experiences.
- AI Predictive Analysis: Utilizes AI to forecast potential performance shortfalls and SLA obligations.
- Log Management: Scans log messages for deeper insights into application performance issues.
- Full-Stack Monitoring: Includes network, server, and cloud platform monitoring for comprehensive oversight.
Why do we recommend it?
Site24x7‘s versatility is evident in the ability to provide code profiling for a variety of languages, including Python, Java, .NET, PHP, Node.js, and Ruby on Rails, facilitating comprehensive tracking of running web applications. The seamless integration with Real User Monitoring (RUM) and the utilization of AI for predictive analysis further elevate its capability to identify and address performance issues proactively. Additionally, the inclusion of Log Management services enhances the troubleshooting process by allowing users to delve into log messages for deeper insights.
The APM easily links to the Real User Monitoring (RUM) package in the Site24x7 platform, which enables you to identify the root cause of any performance issues that arose in your websites. The system also deploys AI to predict potential shortfalls in meeting SLA obligations.
Another useful package on the Site24x7 platform is its Log Management service. This can be used to scan through log messages from across your system at the time of a problem arising with your applications.
If you can’t find any cause for your application performance problems, you could look for answers in logs, or track through the system alerts raised by the network, server, and cloud platform monitoring units on the Site24x7 platform.
Who is it recommended for?
Site24x7 APM is recommended for businesses and IT professionals seeking an all-encompassing monitoring solution. Particularly beneficial for small businesses, this tool caters to organizations with varying capacity needs. Its code profiling capabilities make it a valuable asset for developers working with diverse programming languages, while the integration with RUM enhances its appeal for web administrators. The predictive analysis through AI suits those focused on proactive performance management, and the inclusion of Log Management services broadens its utility for troubleshooting and issue resolution across different layers of the IT infrastructure. Whether you’re a small business or an IT professional in need of a comprehensive monitoring platform, Site24x7 APM provides a versatile and scalable solution.
Pros:
- Versatile Code Profiling: Supports a wide range of programming languages for comprehensive application monitoring.
- Integrated RUM: Enhances performance analysis by linking with Real User Monitoring.
- Proactive Management: AI-driven predictive analysis helps in anticipating and preventing performance issues.
- Detailed Log Analysis: Log Management services offer deep insights for troubleshooting.
- Full-Stack Coverage: Monitors network, server, and cloud platforms in addition to applications.
Cons:
- Subscription Costs: While the base price is low, additional capacity requires extra payments, potentially increasing costs.
- Resource Intensive: Monitoring extensive environments can be demanding on system resources.
- Learning Curve: Advanced features may require time to master.
The APM package on the Site24x7 platform is a subscription service. This is sized to suit the capacity needs of small businesses. So, they advertise a low price that most companies will have to expand on. This is because you need to pay supplements to get extra capacity. Access a 30-day free trial.
3. DataDog Python Application Performance

Datadog Application Performance Manager works with a wide variety of code and applications, including Python. DataDog excels in displaying all of the critical alerts and metrics without sacrificing ease of use or cutting out core features. This tool acts as a cloud monitoring service, meaning you won’t have to spin up a virtual machine or install this on a server.
Key Features:
- Customizable Dashboard: Provides end-to-end visibility with actionable metrics from raw application data.
- Real-Time and Historical Insights: Tracks total requests, errors, latency distribution, and query counts in real-time and historically.
- Efficient Trace Searching: Fast, tag-based trace searching with live data from every trace.
- Auto-Correlated Logs: Automatically sorts log data by webpage, country, pages, or users.
- Continuous Profiling: Constantly measures code performance, highlighting issues by the exact line of code.
- Synthetic Testing: Simulates real traffic patterns to test code before deployment, correlating front-end issues with specific code areas.
Why do we recommend it?
Datadog Application Performance Manager excels in providing a comprehensive overview of critical alerts and metrics without compromising usability or essential features. With a highly customizable dashboard, Datadog translates raw application data into actionable metrics, ensuring end-to-end visibility into the performance of Python applications. Real-time and historical insights, covering aspects such as total requests, errors, latency distribution, and query counts, empower users to make informed decisions promptly. The tool’s efficient trace searching capabilities, continuous profiling, and auto-correlation of log data contribute to a holistic understanding of Python code performance at the code level.
Through a completely customizable dashboard, the raw application data is sorted into actionable metrics that can easily be interpreted at a glance for end-to-end visibility into your Python applications performance. Insights such as total requests, total errors, latency distribution, and a total number of queries are all made accessible both in real-time and historically.
Searching for traces is surprisingly fast and requires no sampling at all. Searching by tag brings in live data from every trace in real-time. Each trace captures the lifespan of the request from front end clients, down to databases. This makes finding and isolating problems in your Python code simple, no matter what end of the request you’re on.
All log data is auto-correlated for every single trace that comes through your application. This data can automatically be sorted by webpage, country, pages, or users to help understand who is being impacted by a specific problem. This can be achieved by searching through out-of-the-box tags and doesn’t require learning a query language.
To dig down into the code level DataDog utilizes continuous profiling to constantly measure all of your code all the time. This breaks down and color codes issues and insights by the exact line of code that is impacting the applications. Whether this is analyzing memory usage, or discovering a line of code is using more CPU than needed, all of these insights are brought together in a way that makes understanding the problem easier on a visual level.
To test your code before deployment you can use DataDog Synthetics to simulate real traffic patterns on your application from around the world to see how your code holds up. The results from this test automatically correlate issues on the front end with specific areas of code for quick remediation.
Who is it recommended for?
Datadog Application Performance Manager is recommended for developers, IT professionals, and businesses seeking a cloud monitoring solution that effortlessly caters to Python applications. Its versatility makes it suitable for a broad range of users, from individual developers looking to optimize code performance to enterprises managing complex applications. For teams focused on proactive performance management and quick issue resolution, Datadog’s continuous profiling, trace searching, and synthetic testing capabilities offer valuable insights. Whether you are a developer seeking code-level visibility or an IT professional managing diverse applications, Datadog provides a robust solution for monitoring and optimizing Python application performance.
Pros:
- Comprehensive Monitoring: Offers detailed insights into Python application performance.
- User-Friendly Interface: Customizable dashboard for easy interpretation of metrics.
- Real-Time Analysis: Provides immediate visibility into application performance with fast trace searching.
- Code-Level Visibility: Continuous profiling highlights performance issues at the code level.
- Proactive Testing: Synthetic testing simulates real traffic to identify potential issues before deployment.
Cons:
- Subscription Costs: May be expensive for smaller businesses or individual developers.
- Complex Setup: Initial configuration can be time-consuming for some users.
- Learning Curve: Advanced features may require time to master.
You can test out DataDog and all of its features for free for 14 days.
4. Retrace APM

Retrace APM combines real-time monitoring of your Python applications with holistic logging and interprets that data to provide you with actionable troubleshooting steps. Retrace is another SaaS-based performance monitor that allows for low overhead and fast onboarding. Through an agent, Retrace automatically detects all code running on your server, and then pulls that data into its dashboards.
Key Features:
- Comprehensive Dashboards: Real-time and historical insights into application performance metrics.
- Automatic Code Detection: Agent-based detection of all running code on the server for seamless integration.
- Performance Metrics: Tracks popular queries, average response time, and total requested actions.
- Issue Identification: Detects memory leaks, stack bottlenecks, and slow database queries from the main dashboard.
- User Satisfaction Metrics: Includes Apdex ratings and user-level metrics for enhanced performance analysis.
- Aggregated Performance Scoring: Provides an overall performance score with the Retrace App Score.
Why do we recommend it?
Retrace APM stands out as a SaaS-based performance monitoring solution designed to provide real-time insights into Python applications. With its low overhead and quick onboarding, Retrace uses an agent to automatically detect all code running on the server, enabling seamless integration into its dashboards. The built-in dashboards offer a comprehensive view of application performance, including metrics on popular queries, average response time, and total requested actions, both historically and in real-time. Retrace excels in identifying memory leaks, stack bottlenecks, and slow database queries directly from the main dashboard. The inclusion of user-level metrics, Apdex user satisfaction ratings, and App Score further enhances its ability to deliver actionable insights at multiple levels.
Built-in dashboards provide a fast look into your application’s performance historically, and in real-time. Get an exact look at what the most popular queries are, average response time, and the total number of requested actions. From the main dashboard, you can discover memory leaks, find bottlenecks in your stacks, and identify slow database queries all without having to leave the main dashboard.
Along with hard metrics like resource consumption, Retrace provides data on the user level with Apdex user satisfaction ratings and isolates slow dependencies and services where problems arise. This information is aggregated and put into your Retrace App Score that rates the overall performance of your application on all levels.
Code-level tracing is easy to navigate, but not quite as intuitive as DataDogs tag-based searching. Retrace makes it easy to measure your Python apps in developments, QA, and production.
Who is it recommended for?
Retrace APM is recommended for developers, IT professionals, and businesses seeking a SaaS-based performance monitoring solution tailored for Python applications. Its low overhead and easy onboarding make it suitable for individual developers, while its robust features cater to the needs of enterprises managing applications at scale. The intuitive built-in dashboards offer a quick and efficient way to measure and optimize Python apps in various environments, from development and QA to production. Retrace’s focus on code-level tracing, user satisfaction metrics, and aggregated performance scoring positions it as a valuable tool for teams looking to proactively manage and enhance the performance of Python applications across different stages of development and deployment.
Pros:
- Low Overhead: SaaS-based solution with minimal impact on system resources.
- Quick Onboarding: Fast and easy setup with agent-based code detection.
- Comprehensive Insights: Detailed real-time and historical performance metrics.
- Efficient Issue Detection: Identifies memory leaks, bottlenecks, and slow queries from a single dashboard.
- User-Level Metrics: Tracks user satisfaction with Apdex ratings and other user-centric data.
Cons:
- Initial Configuration: Some users may find the initial setup complex.
- Limited Customization: Code-level tracing is less intuitive compared to tag-based searching in other tools.
You can test out Retrace free through a 14-day trial.
5. New Relic
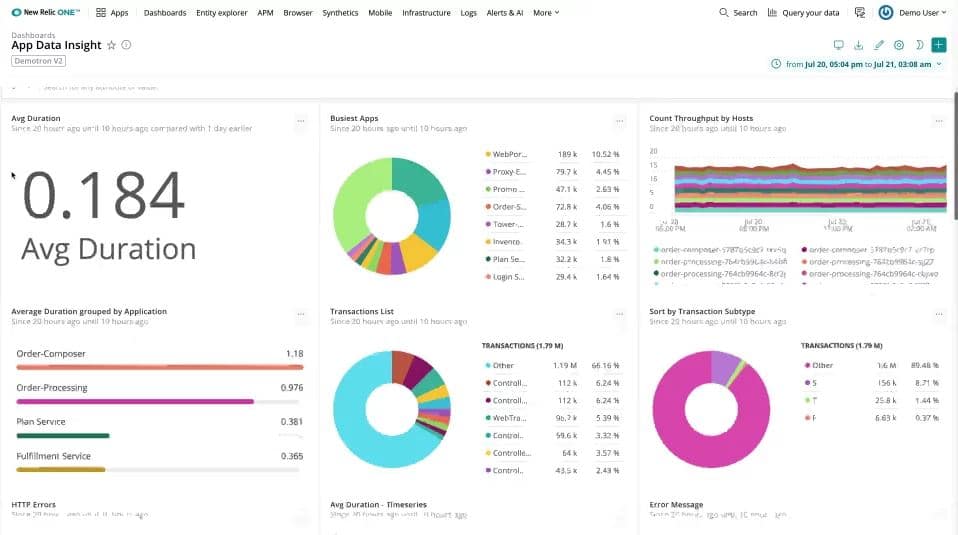
New Relic APM provides key data through the Overview Dashboard that allows you to quickly toggle between general information to detailed geographical details and insights. New Relic provides data on response time, web transactions, error rates, and total requests per minute to your Python application. All insights link directly to the transaction traces to provide even deeper insight in just a few clicks.
Key Features:
- Overview Dashboard: Provides quick access to response time, web transactions, error rates, and total requests per minute.
- Transaction Tracing: Links insights directly to transaction traces for deeper analysis.
- Cross-Platform Support: Monitors applications in cloud, server, and hybrid environments.
- Code Comparison: Highlights changes and new issues post-deployment.
- Customizable Metrics: Allows creation of custom metrics for specific events like logins or registrations.
- Cross-Application Tracing: Provides total visibility across multiple tiers and services with an application topology map.
- Framework Support: Includes CherryPy, Django, Bottle, Pylons, Flask, and Web2py out of the box.
Why do we recommend it?
New Relic APM stands out as a comprehensive application performance monitoring solution for Python applications, offering key data through its Overview Dashboard. This dashboard allows users to seamlessly toggle between general information and detailed geographical insights, providing a quick overview of critical metrics such as response time, web transactions, error rates, and total requests per minute. The platform’s ability to link insights directly to transaction traces facilitates in-depth analysis with just a few clicks, enhancing the troubleshooting process. With support for multiple platforms, including cloud, server, and hybrid environments, New Relic ensures versatility in monitoring various deployment scenarios. The platform excels in comparing code before and after deployment, effectively highlighting changes and pinpointing areas where new issues may have emerged.
New Relic supports multiple platforms, so it won’t matter if your application is in the cloud, on a server, or in a hybrid environment. New Relic does a great job of making it easy to compare new and old code after a deployment, and highlighting changes in code where new problems were created.
While there are a number of pre-configured metrics, you’ll have the freedom to create your own for events like login attempts or registrations. Those newly created metrics can automatically link into a fully customizable dashboard, making this ideal if you want to measure and monitor specific functions of your Python application.
Features in New Relic like cross-application tracing allow for deep insights across multiple tiers and services to provide total visibility into your traces. This tracing also automatically maps each tier into an application topology map that makes understanding the relationships between tiers easy.
Support for all major frameworks comes right out of the box and includes CherryPy, Django, Bottle, Pylons, Flask, and Web2py. New Relic has pricing tiers that start completely free and increase as your reporting and monitoring needs to, making this an ideal choice for smaller dev teams who are on a budget.
Who is it recommended for?
New Relic APM is recommended for developers, IT professionals, and small to medium-sized dev teams seeking a comprehensive and versatile performance monitoring solution for Python applications. Its user-friendly Overview Dashboard provides a quick and detailed view of critical metrics, making it suitable for individual developers and small teams. The platform’s support for all major frameworks, including CherryPy, Django, Bottle, Pylons, Flask, and Web2py, ensures compatibility with a wide range of Python applications. New Relic’s pricing tiers, starting with a free option, make it an ideal choice for smaller dev teams operating within budget constraints.
Pros:
- Comprehensive Insights: Overview Dashboard offers detailed performance metrics at a glance.
- In-Depth Analysis: Transaction tracing allows for quick identification of issues.
- Versatile Deployment: Supports monitoring across cloud, server, and hybrid environments.
- Custom Metrics: Enables users to track specific functions with customizable metrics.
- Wide Framework Support: Out-of-the-box compatibility with major Python frameworks.
- Flexible Pricing: Offers a free tier, making it accessible for small dev teams.
Cons:
- Cost for Advanced Features: Higher tiers may be expensive for smaller teams.
- Complex Setup: Initial configuration might be challenging for some users.
- Learning Curve: Advanced features and customization may require time to master.
6. AppDynamics

AppDynamics by Cisco is a full-service application manager that supports many different types of applications, software, and integrations. For Python monitoring, AppDynamics provides powerful insights and easy to use topology maps to let you know where there is an issue, and exactly where it’s coming from.
Key Features:
- Real-Time Monitoring: Monitor Python applications in real-time and drill down into call stacks from the main dashboard.
- Automatic Topology Mapping: Visualize the entire application stack with automatic topology maps for easy issue identification.
- Business Transaction Insights: Aggregate business transaction performance and user satisfaction to understand the impact of technical issues.
- Runbook Automation: Create scripts to automatically resolve issues when certain thresholds, events, or actions occur.
- Intelligent Alerting: Configure alerts for performance drifts, SLA breaches, or other critical events to avoid notification fatigue.
- Health Status Indicators: Automatically apply health statuses (Critical, Warning, Normal, Unknown) based on performance and set alerts accordingly.
Why do we recommend it?
AppDynamics by Cisco is a robust application manager offering comprehensive monitoring for various applications, including Python. With powerful insights and user-friendly topology maps, it facilitates quick issue identification and traceability within applications. The platform supports real-time monitoring, enabling users to drill down into call stacks directly from the main dashboard. AppDynamics’ automatic application topology mapping provides a comprehensive overview of the entire stack, simplifying issue visualization. Its holistic approach, combining resource metrics, business transaction performance, and user satisfaction, makes it ideal for businesses seeking comprehensive Python monitoring.
While resource metrics are important, AppDynamics also can aggregate business transaction performance and user satisfaction to better understand how technical issues impact real people and the bottom line. When issues are detected, AppDynamics has a feature called Runbook Automation which allows you to create scripts that execute when certain thresholds, events, or actions take place.
If something can’t be automatically fixed via a script, AppDynamics has intelligent alerting that can be configured to alert you or your team through email or third-party integration. Alerting can also be set up for when baseline performance drifts, or an SLA appears that it’s going to be broken soon based on past data.
There are four overall health statuses that can be automatically applied to your application based on performance. Critical, warning, normal, and unknown are all states the APM can enter. When these health status change you can choose to be alerted. Alerts are highly configurable which helps avoid redundant alerts and notification fatigue.
Who is it recommended for?
AppDynamics by Cisco is recommended for developers, IT professionals, and businesses of all sizes in need of a versatile application management solution with robust Python monitoring capabilities. The user-friendly topology maps and real-time monitoring features cater to individual developers and large teams alike. AppDynamics’ ability to provide insights into call stacks and automatic application topology mapping enhances troubleshooting for Python applications. The platform’s holistic approach, combining resource metrics, business transaction performance, and user satisfaction, suits businesses aiming to understand the broader impact of technical issues. Configurable alerts and the Runbook Automation feature make it efficient for users prioritizing automated issue resolution.
Pros:
- Comprehensive Monitoring: Provides real-time insights and detailed call stack analysis.
- User-Friendly Maps: Automatic topology maps simplify visualization and troubleshooting.
- Holistic Approach: Integrates resource metrics, transaction performance, and user satisfaction for a complete view.
- Proactive Automation: Runbook Automation and intelligent alerting enhance issue resolution efficiency.
- Scalable Solution: Suitable for businesses of all sizes, from individual developers to large enterprises.
Cons:
- Cost: May be expensive for smaller businesses or individual developers.
- Complex Setup: Initial configuration and setup can be time-consuming.
- Potential Over-Alerting: Configuring alerts to avoid redundancy and fatigue may require fine-tuning.
You can start using AppDynamics for free through a 15-day trial.
7. Scout APM

Scout APM is an easy to install performance monitor that brings the most critical monitoring information to light. Scout installs just like a Python package meaning it’s up and running with almost no configuration in just a few minutes.
Key Features:
- Quick Installation: Functions like a Python package for swift setup with minimal configuration.
- Critical Insights: Provides N+1 database query performance, memory bloat detection, and anomaly identification.
- Out-of-the-Box KPIs: Includes Apdex score, requests per minute, error rate, memory usage, and response time.
- Memory Bloat Detection: Isolates transactions causing memory bloat and calculates memory increases due to background jobs.
- Object Allocation Tracking: Helps cut down and eliminate unnecessary overhead in applications.
- Customizable Alerts: Offers flexible alerts with daily or weekly email digests summarizing app performance and anomalies.
- Broad Compatibility: Supports various Python libraries, including Django and Flask, without needing custom instrumentation.
Why do we recommend it?
Scout APM stands out as an easy-to-install performance monitor, functioning like a Python package for swift setup within minutes. It excels in providing critical insights, including N+1 database query performance, memory bloat detection, and anomaly identification. The platform offers out-of-the-box KPIs covering Apdex score, requests per minute, error rate, memory usage, and response time, ensuring a comprehensive view of application performance. With features like Memory Bloat Detection and object allocation tracking, Scout APM aids in optimizing resource utilization and eliminating unnecessary overhead in Python applications.
Scout can dig deep and provide insights that some APM miss such as N+1 database query performance, memory bloat, and anomalous app behavior. Once installed, out-of-the-box KPIs are generated into the dashboard to report on critical information such as Apdex score, requests per minute, error rate, memory usage, and response time.
The Memory Bloat Detection works by passively calculating the increase in memory caused by background jobs and isolating the exact transactions that lead to memory bloat. Object allocation is also tracked to help you cut down and eliminate unneeded overhead in your application.
Alerts are flexible and customizable and even come with a daily or weekly email digest to summarize how your app is performing. This digest also includes anomalies and endpoints that might need developer attention.
Surprisingly this entire system runs on a very small footprint and takes up very little resources. This is due to Scout’s tracing algorithms working more with anomaly requests and decreasing analysis on faster areas of the Python code.
Python libraries such as Django, Flask are already included and eliminate the need to add custom instrumentation. In total Scout supports up to 14 different python libraries and four different types of datastores.
Who is it recommended for?
Scout APM is recommended for developers and businesses seeking a hassle-free and efficient performance monitoring solution for Python applications. Its quick installation process, minimal configuration requirements, and out-of-the-box KPIs make it suitable for individual developers as well as larger development teams. The platform’s ability to detect memory bloat and analyze object allocation addresses specific performance optimization needs. Customizable alerts, including a digest summarizing app performance and anomalies, cater to users who prioritize proactive issue resolution. The platform’s support for various Python libraries, including Django and Flask, ensures broad compatibility for diverse development environments.
Pros:
- Easy Installation: Quick setup with almost no configuration, like installing a Python package.
- Comprehensive Insights: Delivers detailed performance metrics, including memory bloat and query performance.
- Proactive Monitoring: Customizable alerts and performance summaries help with proactive issue resolution.
- Resource Efficient: Operates with a small footprint, minimizing resource usage.
- Wide Library Support: Compatible with multiple Python libraries and datastores, ensuring broad applicability.
Cons:
- Limited Customization: While it supports many libraries, some users may require more customization options.
- Cost: May be expensive for smaller businesses or individual developers.
- Initial Learning Curve: Users might need time to get familiar with all features and functionalities.
- Complex Scenarios: May require additional configuration for very complex or custom monitoring needs.
- Feature Depth: Some advanced features found in other APMs may be less comprehensive in Scout APM.
Pricing for Scout APM starts at $129.00 (£98.90) per month.
8. Dynatrace

Dynatrace also supports a vast number of applications for performance monitoring and works well with Python-based code. The Dynatrace platform really shines when it comes to its visualizations. Dependencies are mapped out using Smartscape technology to automatically build out a map of your dependent applications and services.
Key Features:
- Smartscape Technology: Automatically maps out dependencies of applications and services, providing an interactive and detailed overview.
- Process-Level Monitoring: Offers insights into specific processes making and receiving calls, enhancing troubleshooting.
- Interactive Maps: Provides a flexible, interactive map to trace dependencies and drill down into granular details.
- Web Monitoring: Offers an interactive geographical map to view the application from the customers’ perspective, identifying performance issues globally.
- Customer-Centric View: Helps visualize errors and understand the circumstances that caused them, facilitating quick resolution.
Why do we recommend it?
Dynatrace stands out for its robust support for a wide range of applications, making it particularly effective for Python-based code. The platform excels in visualizations, utilizing Smartscape technology to automatically create a detailed map of dependent applications and services. This interactive map offers a comprehensive overview of your app’s network, allowing you to trace dependencies and drill down into granular details. Dynatrace’s focus on process-level monitoring provides insights into the specific processes making calls and those being called, enhancing troubleshooting capabilities.
This mapping provides a great overview of your apps’ network but also allows you to see traces as they move through your topology. This map is interactive and gives you the flexibility to highlight any node and drill down further to view more granular details. Much of this monitoring is done on the process level, giving you a view into exactly which processes are making calls and which processes are being called on.
Dynatrace also offers web monitoring which gives you an interactive geographical map that allows you to view your application from your customers’ perspective. If your applications require constant access from across the globe, web monitoring makes it easy to view areas that might be experiencing performance issues or outages. From this same dashboard, you can not only visualize the error but understand the circumstances that caused that error to take place.
Who is it recommended for?
Dynatrace is recommended for businesses and developers seeking an advanced and visually intuitive performance monitoring solution, especially those working with Python-based applications. The platform’s extensive application support and Smartscape technology make it suitable for complex and interconnected environments. The interactive maps and process-level monitoring cater to users who prioritize detailed insights into dependencies and processes. Dynatrace’s web monitoring functionality is ideal for applications with a global user base, providing a customer-centric view and facilitating quick identification of geographical performance issues. The platform’s emphasis on visualizations and in-depth error understanding makes it well-suited for organizations focused on proactive performance management.
Pros:
- Exceptional Visualization: Smartscape technology provides detailed and interactive maps of dependencies.
- Comprehensive Insights: Process-level monitoring gives a deep view into specific calls and processes.
- Global Perspective: Web monitoring provides a customer-centric view, identifying performance issues across different regions.
- Proactive Management: In-depth error understanding and visualization aids in proactive performance management.
- Extensive Application Support: Supports a wide range of applications, making it versatile for various environments.
Cons:
- Cost: May be expensive for smaller businesses or individual developers.
- Complex Setup: Initial configuration and setup can be time-consuming and complex.
- Learning Curve: Advanced features and visualizations may require time to master.
You can test out Dynatrace for Python performance monitoring for 15 days through a free trial.
9. Atatus

Atatus provides full visibility into your Python performance and allows you to view and understand your application dependencies and related services. Atatus deploys through a simple agent and can capture all requests to your Python applications without needing to change or modify your source code. This tool paints a clear picture of how all of your methods, external requests, and database statements impact your users’ experience.
Key Features:
- Agent-Based Deployment: Simple agent captures all requests to Python applications without modifying source code.
- Comprehensive Visibility: Provides full visibility into application dependencies and related services.
- User Experience Focus: Dashboard prioritizes issues impacting user experience and conversions.
- Detailed Error Tracking: Captures all errors with full stack trace, linking directly to source code.
- Proactive Alerts: Configurable alerts via email, Slack, PagerDuty, or webhook for real-time issue management.
- SQL and NoSQL Query Analysis: Table view breakdown highlights bottlenecks in database queries and third-party calls.
Why do we recommend it?
Atatus earns a nod for its knack at delivering a comprehensive view into Python application performance, shedding light on dependencies and related services. What sets it apart? The simplicity of deploying its agent, which seamlessly captures all Python application requests sans the hassle of tinkering with source code. Atatus takes the spotlight for painting a vivid picture of how methods, external requests, and database statements play a role in shaping user experiences. With a dashboard tuned into customer priorities, it excels in pinpointing issues that pack a punch, making it a savvy choice for businesses putting user satisfaction front and center.
The Atatus dashboard provides all of the basic metrics you’d expect but is also very customer focused. The insights highlight and prioritize issues that are likely to impact user experience and conversions over other areas of your application.
A table view breakdown helps highlight bottlenecks in your database queries and third-party calls. This allows you to sort and sift through all SQL and NoSQL queries to identify problems with query time in which operations are being impacted.
All errors in your Python application are tracked and captured with full stack trace, allowing you to toggle from top-level insights straight to the highlighted source code that was involved in the issue. On the proactive side, alerts can be configured to be sent via emails, Slack, PagerDuty, or webhook directly into your own custom solution.
Who is it recommended for?
Atatus isn’t just for the tech-savvy. It’s the go-to for developers and businesses hungry for a monitoring solution that unveils the full scope of Python application performance. The agent’s no-fuss deployment makes it a seamless fit for environments steering clear of source code tweaks. What’s the real charm? Tailored insights that align with customer needs, placing it in the sweet spot for organizations championing user experiences and laser-focused on optimizing conversions. Dive deeper, and you’ll find Atatus excelling at tracking errors, armed with full stack traces, and offering the flexibility to set up proactive alerts.
Pros:
- Easy Deployment: Agent-based installation requires no source code modifications.
- User-Centric Insights: Focuses on issues affecting user experience and conversions.
- Detailed Error Analysis: Full stack trace for errors, facilitating quick resolution.
- Proactive Alerting: Configurable alerts ensure real-time issue detection and management.
- Comprehensive Query Analysis: Highlights bottlenecks in SQL and NoSQL queries, aiding in performance optimization.
Cons:
- No Free Trial: Currently, no free trial is available, though a fully interactive demo can be requested.
- Learning Curve: Advanced features may require time to fully understand and utilize.
- Limited Customization: May offer fewer customization options compared to some competitors.
Pricing for Atatus starts at $49.00 (£37.57) per month. While there is currently no free trial available you can request a fully interactive demo through their website.
10. Prometheus
Prometheus is 100% open source and community-driven, meaning it’s completely free to use and was inspired by Google’s Borgmon monitoring system.
Key Features:
- Open Source: 100% free and community-driven, inspired by Google’s Borgmon system.
- Comprehensive Monitoring: Covers internal metrics, service-level insights, and business logic.
- PromQL: Functional query language for real-time data queries, displayed in graphs, spreadsheets, or via HTTP API integration.
- Grafana Integration: Uses Grafana as a data source for visualizing metrics in real-time.
- Flexible Alerting: Alerting rules defined by conditions in the Prometheus expression language, with customizable templates.
Why do we recommend it?
Prometheus emerges as a powerhouse in the realm of Python monitoring, and here’s the kicker—it’s all about that open-source allure. Unleashing a 100% community-driven vibe, this monitoring marvel comes with a price tag of zero, inspired by the legendary Google’s Borgmon system. Prometheus doesn’t just stop at the surface; it delves into multiple layers of monitoring nirvana—internally, as a service, through server libraries, and even ventures into the terrain of business logic insights. But here’s the catch: Prometheus speaks its own language, the PromQL, a functional query powerhouse that opens the gateway to real-time data queries. The expressive queries can flex their muscles in graph format, opt for a spreadsheet view, or take the express lane to elsewhere via HTTP API integration.
Monitoring can be done on multiple layers including internally, as a service, through server libraries, and provide business logic insights. Prometheus uses a functional query language called PromQL that allows for data to be queried in real-time. Expressions can be displayed in graph format, broken down into spreadsheet view, or sent elsewhere for processing through the HTTP API integration.
To graph out your data you’ll need to utilize another tool such as Grafana. Once installed you can set Prometheus as a data source to start pulling in metrics live. While open-source platforms like Grafana have a collection of shared dashboards, this is still going to take you time to set up, test, and implement.
Alerting rules are defined on conditions and are based on the Prometheus expression language. While there are alerting templates, any type of customization or changes is going to be a bit cumbersome to manually integrate.
These are not out of the box solutions and require some knowledge of the platform which would take time. This is fairly common with open source platforms. If you have the time to tinker with Prometheus and don’t mind relying on the open-source community for help, this is a solid free alternative for Python monitoring.
Who is it recommended for?
Prometheus is the choice for those who crave the freedom of open-source monitoring without breaking the bank. Its allure lies in catering to a diverse audience, whether you’re an internal scrutineer, a service aficionado, or a logic insights enthusiast. But, here’s the twist—the road to graphing utopia demands a companion, and Grafana is the sidekick of choice. This power duo’s synergy lets you visualize metrics in real-time. While platforms like Grafana flaunt an array of shared dashboards, remember, you’re in for some DIY action—setup, testing, and implementation will demand your attention. Brace yourself for Prometheus’ expressive Alerting rules, rooted in its expression language. Just a heads up—customizing might be a tad tricky, and the open-source community might become your confidante.
Pros:
- Cost-Free: Completely free to use, making it a cost-effective solution.
- Real-Time Data Queries: PromQL allows for powerful, real-time querying of data.
- Comprehensive Coverage: Monitors multiple layers including internal metrics, services, and business logic.
- Community Support: Strong open-source community for help and shared resources.
- Customizable Visualizations: Integration with Grafana for interactive and customizable dashboards.
Cons:
- Learning Curve: Users need to learn PromQL and may face challenges with customization.
- Manual Integration: Customizing alerting rules and dashboards can be cumbersome.
- Dependency on Tools: Requires additional tools like Grafana for data visualization.
- Limited Out-of-the-Box Solutions: Not as user-friendly initially compared to some commercial monitoring tools.
11. Sentry.io

Sentry is a lightweight and fast way to implement performance monitoring directly into your Python project. Installation is quick and just requires an install of the Sentry SDK. With support for Django, Flash, Bottle, Celery, AWS Lambda, RQ, and Pyramid there is ample support for whatever Python library you use.
Key Features:
- Quick Installation: Requires only the Sentry SDK for seamless integration.
- Extensive Library Support: Supports Django, Flask, Bottle, Celery, AWS Lambda, RQ, and Pyramid.
- Error Identification: Swiftly identifies poor-performing API calls and logs code-related errors.
- Local Variable Analysis: Analyzes local variables directly in the stack for detailed error insights.
- Breadcrumb Error Feedback: Traces events leading up to errors, aiding in understanding user behavior and isolating root causes.
Why do we recommend it?
Sentry.io gets our nod as a nimble and swift solution for seamlessly integrating performance monitoring into your Python project. The key to its appeal lies in the rapid installation process, merely requiring the addition of the Sentry SDK. What truly sets it apart is its versatility, extending support to a spectrum of Python libraries including Django, Flask, Bottle, Celery, AWS Lambda, RQ, and Pyramid. Sentry kicks into action within minutes of installation, swiftly flagging suboptimal API calls and meticulously logging code-related errors. Its ability to scrutinize local variables directly in the stack, akin to a development environment, adds a layer of granularity to error analysis.
Minutes after installation Sentry begins identifying poor performing API calls and creating logs of code-related errors for you or your team to review. Sentry can analyze local variables right in the stack for errors just as if you were in a development environment.
A unique feature of Sentry is its Breadcrumb error feedback. This allows you to see the exact events that lead up to an error or specific event. This feature alone allows you to get an understanding of end-user behavior, and isolate the root cause of the problem without spending hours attempting to replicate it yourself.
Who is it recommended for?
Sentry.io emerges as the go-to choice for Python projects where speed, simplicity, and versatility are paramount. If you’re working with Django, Flask, or any other major Python library, Sentry effortlessly blends into your workflow. For developers seeking a lightweight yet robust monitoring solution that seamlessly identifies and logs errors, Sentry fits the bill. We’ve dived into the world of Sentry.io, examining its installation process, exploring its adaptability across various Python libraries, and witnessing firsthand its swift error identification and logging capabilities. Our hands-on experience ensures that you’re well-informed about what Sentry.io brings to the table for Python project monitoring.
Pros:
- Fast Setup: Quick installation process with minimal configuration.
- Versatile: Supports a wide range of Python libraries, making it adaptable to various projects.
- Detailed Error Analysis: Provides granular insights by analyzing local variables and tracing event sequences.
- User Behavior Insights: Breadcrumb error feedback helps in understanding user actions leading to errors.
- Lightweight: Adds minimal overhead to the project while offering robust monitoring capabilities.
Cons:
- Limited Free Features: Advanced features might require a paid plan.
- Initial Learning Curve: New users may need time to fully explore and utilize all functionalities.
- Customization Needs: Might require additional configuration for specific use cases or complex projects.
- Dependency Management: Requires careful management of dependencies and updates to maintain integration.
You can try out Sentry in a limited capacity completely for free. Paid plans start at $26.00 (£19.93) per month.
12. Metricly
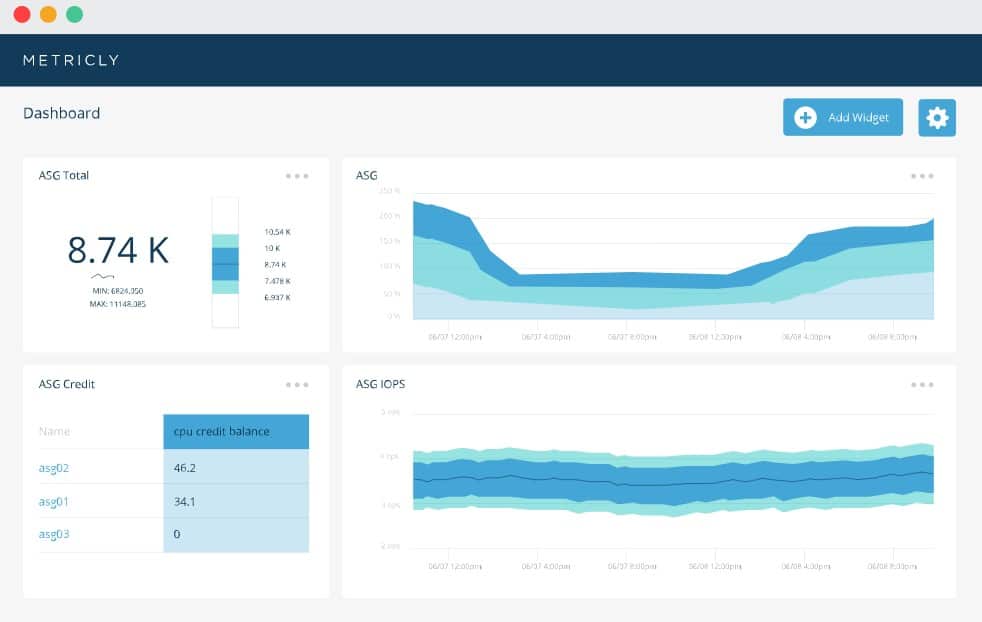
Metricly is a cloud-based application monitor designed to monitor Python applications across multiple dashboards and allows for viewing of both the application and the source code level.
Key Features:
- Multi-Dashboard Setup: Provides a comprehensive view of both application and source code performance.
- Anomaly Detection: Utilizes advanced algorithms to detect deviations from normal patterns and anticipate potential issues.
- Behavior Analysis: Understands user and application interactions over time to build accurate performance patterns.
- Proactive Alerts: Allows for customized alerts and scriptable response actions based on detected anomalies.
- Cloud-Based Monitoring: Offers flexibility and scalability with a cloud-based infrastructure.
Why do we recommend it?
Metricly earns our recommendation as a comprehensive cloud-based application monitor tailored for Python applications. With its multi-dashboard setup, Metricly offers a holistic view spanning both the application and source code levels. One standout feature is its adept utilization of anomaly detection, a proactive mechanism that anticipates deviations and keeps you ahead of potential issues. Metricly excels in understanding the intricate dynamics between users and applications over time, allowing it to discern patterns and behaviors. This understanding forms the basis for effective anomaly detection, contributing to more accurate alerts and response actions.
Metricly also utilizes anomaly detection to help stay ahead of the curve and put you in a more proactive position. Over time, Metricly understands how your users and applications behave with each other to build a pattern.
If this pattern is broken in a way that causes problems you can choose to be alerted or script a response action to deal with that condition. This is a great alternative to using static thresholds which might falsely alert on events you’re well aware of.
Who is it recommended for?
Metricly’s multi-dashboard functionality caters to the need for a comprehensive view, making it suitable for developers and teams dealing with complex applications. The emphasis on anomaly detection positions Metricly as a proactive solution, particularly valuable for those who prioritize staying ahead of potential issues. Scriptable response actions add another layer of customization, offering flexibility in addressing specific conditions without being hindered by static thresholds.
Pros:
- Comprehensive Monitoring: Holistic view across multiple dashboards for detailed insights into application and source code performance.
- Proactive Issue Management: Advanced anomaly detection keeps you ahead of potential issues.
- Behavioral Analysis: Learns user and application patterns over time for accurate anomaly detection.
- Customizable Alerts: Flexible alerting and scriptable response actions tailored to specific conditions.
- Scalable Solution: Cloud-based infrastructure ensures flexibility and scalability.
Cons:
- Complex Setup: Initial configuration and setup can be time-consuming for some users.
- Learning Curve: Advanced features and multi-dashboard functionality may require time to master.
- Resource Intensive: Detailed monitoring and anomaly detection can be demanding on system resources.
You can test out Metricly through a 21-day free trial.
Choosing a Python monitoring tool
There’s clearly plenty of Python monitoring tools to choose from. So which one is right for you? ManageEngine Applications Manager will likely be the best fit for most dev teams and businesses. It’s out of the box solutions and easy to use integrations make it the most comprehensive and feature-rich product for Python performance monitoring.
How do you currently monitor your Python-based applications? Let us know in the comments below.