Have you experienced freezing or sudden crashes in your Java application? Chances are you may have experienced Java memory leakage. In this article, we’ll dive into exactly what causes memory leaks in Java, and suggest some of the best tools you can use to stop memory leaks before they ever happen.
What is Java memory leakage?
Simply put, Java memory leakage is when objects are no longer being used by the application but are active inside the working memory.
In Java and most other programming languages, a garbage collector is tasked with removing objects that are no longer being referenced by the application. If left unchecked, these objects will continue to consume system memory and eventually cause a crash. Sometimes java memory leak crashes don’t output an error, but oftentimes the error will terminate with a java.lang.OutOfMemoryError.
Here’s our top pick of the best Java performance tools:
- SolarWinds AppOptics (FREE TRIAL) In-depth visuals and reporting for many types of applications. Start a 30-day free trial.
- DataDog Java Performance Monitor Balances ease of use while prioritizing proactive features
- VisualVM A simple Java profiler ideal for basic troubleshooting.
- JProfiler A paid Java profiler that detects a multitude of bugs on different levels
- Eclipse Memory Analyzer Provides a detailed breakdown of Java heap memory to better understand memory leaks.
- Glowroot An open-source performance monitor that displays data through your local browser.
What causes Java memory leakage?
Java memory leaks are caused when objects that are unreferenced get categorized as referenced. This stops the garbage collector from clearing the memory, causing the memory to eventually max out and crash.
In memory, objects can have two states, unreferenced and referenced. Referenced objects still have active connections to the Java application, while unreferenced objects do not. The job of the garbage collector is to find and identify unreferenced objects and remove them.
The garbage collector will not clean objects that appear to be referenced or in use. Java memory leaks occur when there is an overlap of unreferenced objects that appear to still be in use.
How do I know if I have a memory leak?
There are a few ways to check your code to see if it has suffered a memory leak. The easiest way to identify a leak is to look for the presence of the java.lang.OutOfMemoryError event in your error logs. If this event is listed, you’ll be able to extract further details as to what part of your Java caused this to happen.
You’ll frequently find details regarding your Java heap space. This can either mean that you’re suffering from a memory leak, the resources could not be assigned, or that your heap size is set too low.
It’s common to also find errors labeled as PermGen space. In most cases, this is not a memory leak but an allocation space that needs to be expanded. The permanent generation space is used to store class objects and can fill up if not expanded.
Not all Java memory leaks are created the same, and some can be prevented easier than others. Let’s take a look at some of the most common causes of a leak in Java memory.
How to prevent Java memory leakage
One of the most common types of memory leaks occurs when objects in Java are created over time, but never released. A simple way to improve performance and prevent memory leaks is to check your usage of static fields in your code.
When you set any object in Java as static it automatically attaches that object’s lifespan to the JVM itself, therefore the garbage collector never clears it. As you can imagine if you have many large objects that are set as static this can create quite a problem in your code.
Be sure to check all of your usage of static as well as your usage of collections. Both are some of the most common causes of Java memory leaks and unintentional holds on memory.
Another common cause of Java memory leaks is the presence of unclosed connections. Any part of your code that keeps connections open without closing them can cause excessive memory usage. The most common culprit of unclosed connections is open relays, FTP sites, and database access.
When left open, connections can rapidly cause Heap memory to swell and eventually crash your application. To fix this, always make sure you have specified in your code when your connections should close.
Just like unclosed connections, unclosed streams can cause very similar memory leaks and resource issues. If left unchecked, open streams will increase heap memory usage to reach critical levels and eventually crash. In older versions of Java, streams had to be closed manually, but now with the use of a try-with-resources statement, this can be achieved automatically.
While looking for these specific examples can help, every program is coded differently and will need to be approached differently. If you’re going through your code manually, enabling verbose garbage collection can help paint a better picture of exactly what’s getting collected, and what isn’t.
Adding the -verbose:gc parameter to the configuration will output exactly what the garbage collection tool is doing, and give you insight into what may need modification. This is a simple trick but still requires your time and energy to sift through the results.
Having a solid audit of your code will also uncover underlying issues that hinder performance or cause memory leaks. While it may seem time-consuming this is generally best practice to do with all of your code and can help avoid serious headaches down the line.
Tools to prevent Java memory leaks
Lastly, to plug your memory leak even quicker consider using a Java profiler. Profilers allow you to monitor specific JVM parameters such as object creation and garbage collection. Profilers go even further than verbose mode and help highlight memory and resource issues that would take hours to track down manually.
You can use Java profilers such as YourKit or JProfiler to help not only find memory leakage in your Java code but also identify opportunities for optimizations and improvements. Both YourKit and JProfiler help prune unnecessary code and identify redundancies in your application. While both of these examples don’t cause memory leaks, they will impact your code’s performance.
Java profilers can provide a breakdown of:
- All objects created
- CPU time of all methods
- Objects created during execution
- Objects removed from memory
- Information on garbage collection
But using a good Java profiler is only half the battle; you’ll also want to monitor the application’s health as it changes over time. For this, you’ll want to pair your Java profiler with a reputable Java performance tool.
You can think of Java profilers as a reactive tool, and Java performance monitors as a proactive tool. You’ll want both to ensure your application is performing optimally for your users, and avoid unneeded downtime. Java performance monitoring tools measure the responsiveness of your application, monitor SLAs, and can even track user experience by calculating a number of different metrics based on user data.
We’ve taken the time to hunt down some of the best Java performance tools you can use to help prevent Java memory leakage and keep your code running smoothly.
Our methodology for selecting Java performance tool:
We’ve broken down our analysis for you based on these key criteria:
- Ability to provide detailed insights into Java application health and performance.
- Features that allow for real-time monitoring and historical data analysis.
- Ease of integration and use, especially with a range of Java applications.
- Capability to identify and troubleshoot memory leaks and other performance issues.
- Options for customization and proactive alerting to maintain optimal performance.
1. SolarWinds AppOptics (FREE TRIAL)

AppOptics by SolarWinds is a full-service application performance monitor built for a vast number of different applications. While AppOptics supports many programs, it does a particularly good job when monitoring and troubleshooting Java apps.
Key Features:
- Full-service application monitor
- Customizable alert templates
- Real-time data troubleshooting
- In-depth Java application insights
Why do we recommend it?
SolarWinds AppOptics is recommended for its comprehensive monitoring capabilities, particularly for Java applications. Its real-time troubleshooting and customizable alerts make it a standout choice.
Similar to DataDog, AppOptics combines powerful features into an easy-to-use dashboard that allows you to customize and take control of your monitoring experience. Alerts can be created from scratch, or chosen from the library of pre-configured templates that come standard with the software.
While the dashboard provides you with a complete overview of the applications and it’s status, you can also drill down to the code level and use AppOptics as a performance tuner. This makes it easy to receive real-time data and immediately troubleshoot it within the same software.
Devs can monitor their Java application for memory leaks or a multitude of other problems by monitoring metrics like Java heap usage, the number of calls, error rate, and response time. Performance data can also be viewed historically through logs, charts, or waterfall traces which make it easy to narrow down a timeframe and isolate the problem line of code.
Who is it recommended for?
This tool is ideal for developers needing in-depth insights and real-time data for Java application monitoring, especially for those who value customizable alert systems.
Pros:
- Versatile monitoring for various applications
- User-friendly dashboard with customization
- Detailed real-time data and historical analysis
- Efficient identification of memory leaks
- Comprehensive overview of application status
Cons:
- Might be overwhelming for beginners
You can try out AppOptics completely free with a 30-day trial.
EDITOR'S CHOICE
SolarWinds AppOptics stands out as the top pick among Java performance tools. It excels in its comprehensive monitoring capabilities for a wide range of applications, including Java. The ease of use combined with powerful features makes AppOptics an ideal choice for both experienced and novice developers. Its customizable dashboard and the option to create alerts from scratch or use pre-configured templates add to its versatility. The ability to drill down to the code level for performance tuning is particularly valuable for identifying and resolving issues like memory leaks.
Download: Start a 30-day FREE Trial
Official Site: https://www.solarwinds.com/appoptics
OS: Windows
2. DataDog Java Performance Monitor

DataDog Java Performance Monitor is specifically built to make monitoring your Java app a simple and intuitive process. Through an interactive dashboard, you can view the status of your Java code at the service, customer, and endpoint level. Datadog provides these insights via a simple Software-as-a-service (SaaS) model.
Key Features:
- SaaS-based Java monitoring
- Automated service mapping
- Real-time and historical insights
- Network topography visualization
Why do we recommend it?
DataDog is recommended for its straightforward and intuitive Java monitoring capabilities, offering clear, actionable insights in real-time.
Once you’ve input your code, DataDog gets right to work identifying Java problems, dependencies, and opportunities through an automatically generated service map. All of this data is pulled from a simple agent installation that reports back information to DataDog. The primary dashboard pulls in real-time and historical performance information as both a visualization and list item that you can sort through.
Metrics such as total errors, latency, and the number of requests are easily tracked via the dashboard. This view can be changed to a network topography view to help better visualize the relationship between your queries, and how performance impacts other functions down the chain.
Through the alerting dashboard, you can quickly set up notifications based on uptime, anomalies, or specific thresholds you set. It was nice to see that this software allows you to combine trigger conditions when setting up an alert template. By being as granular as possible with your alert conditions it helps reduce alert fatigue and keeps your inbox clean. Alerts can be sent via email, or to other tools such as Slack or Pagerduty.
Who is it recommended for?
This tool is suited for those who prefer an intuitive, SaaS-based approach for monitoring Java applications, with a focus on real-time data and network relationships.
Pros:
- Simple, intuitive dashboard
- Detailed performance insights
- Granular alerting options
- Effective for tracking errors and latency
Cons:
- Requires initial setup and configuration
When you’re dealing with something as complex as performance monitoring of your Java applications, it’s refreshing to find a tool that is just as intuitive as it is powerful. You can test out DataDog and all of its features for free for 30 days.
3. VisualVM

VisualVM is a Java troubleshooting tool that ties directly into your jDK to detect problems and bring them to your attention through a graphical interface. Developers can view their applications heap dumps, profile their code, and view a multitude of other insights on their Java app. Since it’s directly bundled into your jDK, it’s conveniently accessible from where you’re already working.
Key Features:
- Bundled with JDK
- Lightweight and local
- Heap dump analysis
- Basic Java troubleshooting
Why do we recommend it?
VisualVM is recommended for its convenience and effectiveness in basic Java troubleshooting, especially useful for initial problem identification.
VisualVM is considerably lightweight and resides directly on your local machines, which makes it great for troubleshooting on the go and not having to rely on a SaaS-based product. While there are other tools available that provide deeper insights into Java-related issues, VisualVM is a simple and clean tool that makes it great to use at the start of your troubleshooting process.
When it comes to Java profilers, VisualVM makes for an excellent starting point, but you might want to consider pairing this with a performance monitoring tool, or another more detailed profiler to ensure all potential bugs are found.
Who is it recommended for?
Ideal for developers looking for a straightforward, no-frills tool for basic Java profiling and troubleshooting, particularly those working directly within JDK.
Pros:
- Directly accessible in JDK
- User-friendly graphical interface
- Useful for initial problem identification
Cons:
- Limited in-depth analysis capabilities
You can download VisualVM for free on your Windows, Linux, or macOS operating systems.
4. JProfiler

JProfiler by EJ Technologies is a Java profiler that prides itself on ease of use and easy integration with your Java applications. On the JVM level, you can view and quickly diagnose problems with your code as you execute it. Issues like memory leaks in your Java code are quickly highlighted under the Heap memory analyzer. Open and closed connections can be visualized through a color-coded timeline making it simple to see missed connections that remain open and utilizing resources. JProfiler also has a built-in Heap walker that developers can use to view any group of objects from multiple angles for a more in-depth inspection.
Key Features:
- Heap memory analyzer
- Detailed object inspection
- Supports JEE components
- Color-coded connection timeline
Why do we recommend it?
JProfiler is recommended for its user-friendly interface and comprehensive heap memory analysis, making it highly effective for diagnosing Java code issues.
JEE is supported by default and groups JEE components into groups in your call tree, making it easier to sort through higher-level profiling data, down to the granular level and other subsystems.
Who is it recommended for?
It’s particularly suited for developers needing a detailed view of their Java application’s performance, including memory leaks and connection management.
Pros:
- Easy integration with Java applications
- Detailed diagnosis of memory issues
- Useful for both high-level and granular data
Cons:
- May require some learning for new users
JProfiler is compatible with Windows, Linux, and macOS and can be tested for free with a trial key.
5. Eclipse Memory Analyzer

To get a detailed breakdown of your Heap memory, Eclipse Memory Analyzer was designed to highlight flaws in memory collection and monitor the health of your Java heap usage. Any object stored will show up and become visible in the heap, where Eclipse Memory Analyzer will monitor and report how that memory is allocated, and if it’s cleared.
Key Features:
- Memory allocation reporting
- Customizable view options
- Monitors Java heap health
Why do we recommend it?
Eclipse Memory Analyzer is recommended for its detailed breakdown of Java heap memory, aiding in the understanding and resolution of memory leaks.
The dashboard breaks down exactly how large the heap is, and what objects are largest by size in chart format. You can configure your own view, or use a number of pre-configured views to sort by object size, duplicate classes, or top consumers. These metrics help you quickly work out issues in your heap and set better policies for optimized performance.
Who is it recommended for?
This tool is ideal for developers who need a focused analysis of heap memory in Java applications, particularly for identifying and addressing memory leaks.
Pros:
- In-depth memory leak analysis
- Customizable dashboard views
- Insightful object size sorting
Cons:
- Interface might be complex for beginners
Eclipse Memory Analyzer is free to download and is compatible with Windows, Linux, and macOS systems.
6. Glowroot
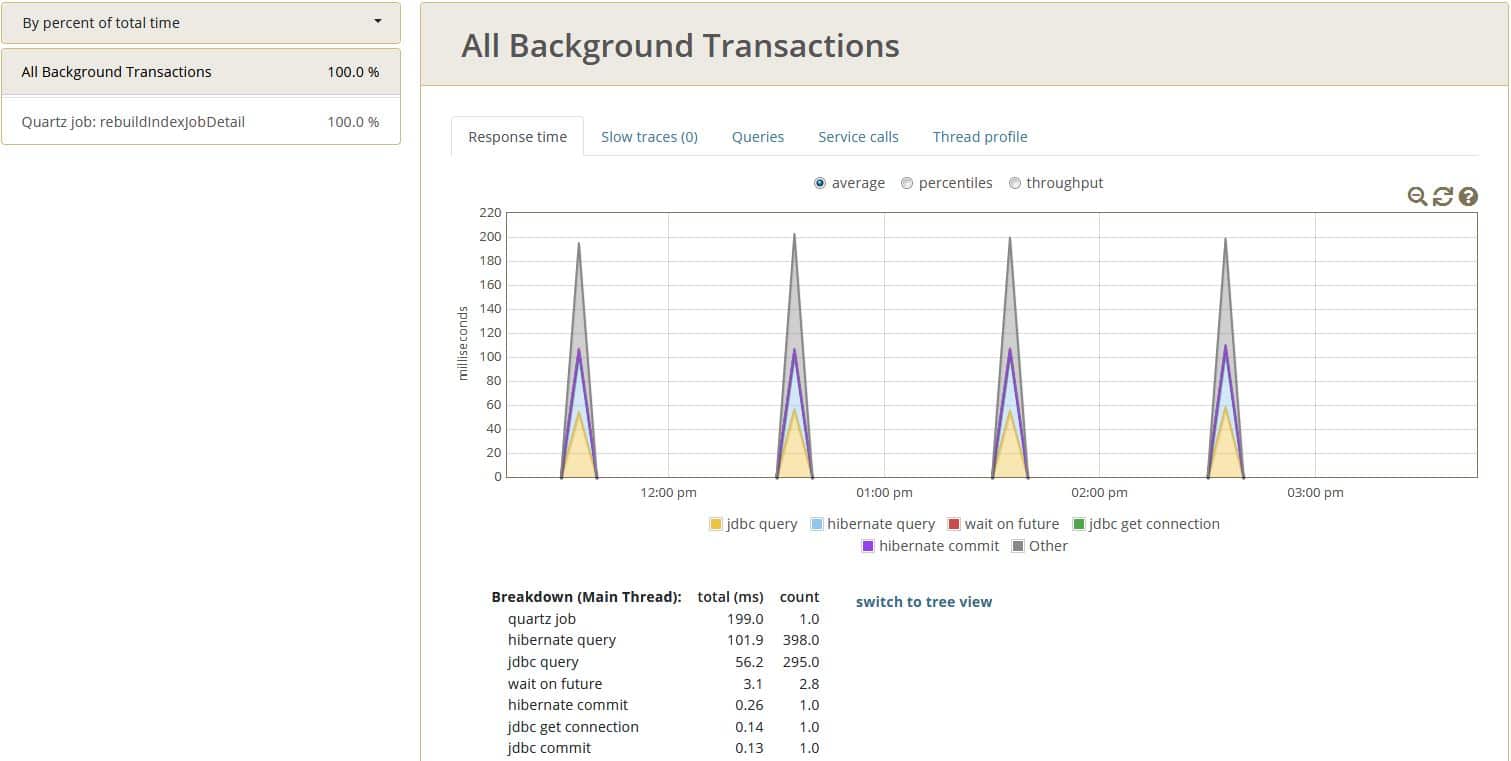
Glowroot is an open-source Java APM that is quick to set up and easy to start using. After unzipping the files, simply add Glowroot’s path to your JVM arguments and access the dashboard via your browser.
Key Features:
- Low overhead monitoring
- Open-source Java APM
- Browser-based dashboard access
Why do we recommend it?
Glowroot is recommended for its extremely low resource consumption and efficient profiling and monitoring capabilities for Java applications.
If you need a tool with extremely low overhead, Glowroot is at the top of its class for resource consumption. Extensive testing shows that Glowroot made such a small impact in its environment that response times had to be recorded in microseconds.
Along with running incredibly lean Glowroot has a host of other features for profiling and monitoring your Java applications. Real-time and historical roll-ups of all data make both live and long term testing easy to execute through the MBean support charts. While Glowroot isn’t the most feature-rich performance monitor, it does come with configurable alerting which gives it additional flexibility for longer-term use.
Who is it recommended for?
This tool is particularly suitable for those who need a lightweight, open-source solution for Java application monitoring with minimal impact on system resources.
Pros:
- Exceptionally low impact on resources
- Real-time and historical data analysis
- Configurable alerting system
Cons:
- Limited in advanced features
Glowroot is free to download and comes with a handy demo site if you want to get a feel for the tool.
Choosing a Java Performance Tool
Java memory leakage can be frustrating, but knowing exactly what it is and how to troubleshoot them will make dealing with them a lot easier. We know that Java memory leaks are caused when objects in heap memory aren’t cleaned up. Let’s recap on the best ways to fix and prevent memory leakage.
- Use a Java compiler. YourKit is a great option as well as Glowroot. These tools will help save you countless hours of debugging and help highlight issues in your code that would otherwise be hard to find.
- Use a trusted Java performance monitor. A Java performance monitor will not only alert you to problems in your code but help you spot signs of memory leaks in your application before it ever impacts your users. We suggest DataDog Java Performance monitor for its ease of use and proactive approach to monitoring.
- Audit your code. Periodic audits and tests can go a long way when implementing new code. Scheduling audits as well as cleaning up your Java will help your app run faster and make troubleshooting easier down the road.
Have you had to troubleshoot a memory leak before? What was causing it? Let us know in the comments below.


