Microsoft Hyper-V, also known as Windows Server Virtualization is one of the biggest names in hardware virtualization. Hyper-V is the main competitor of VMware and offers companies a solution for virtualizing operating systems and hardware. However, like physical devices, it’s a best practice to monitor computing resources. In this article, we’re going to look at the seven best Microsoft Hyper-V monitoring tools.
Here is our list of the best Microsoft Hyper-V monitoring tools:
- ManageEngine Applications Manager (EDITOR’S CHOICE) This on-premises package monitors a wide range of applications, including virtualizations such as Hyper-V, VMware, and Citrix Xen. Available for Windows Server, Linux, AWS, and Azure. Get a 30-day free trial.
- Paessler PRTG Network Monitor (FREE TRIAL) Free network monitoring tool with preconfigured sensors for monitoring Hyper-V resources. Monitor the status, traffic, CPU load, and virtual memory of Hyper-V services. Download a 30-day free trial.
- Site24x7 Hyper-V Performance Monitoring (FREE TRIAL) A server and application monitoring system that includes a special integration for Hyper-V systems. This is a cloud-based platform. Start a 30-day free trial.
- SolarWinds Virtualization Manager Virtualization management platform with VM recommendations and capacity planning. Use the VM sprawl dashboard to troubleshoot for VM sprawl.
- ManageEngine Free Hyper-V Performance Monitor (Free Tool!) – Free Hyper-V monitoring tool that can monitor the CPU, memory, disk read/write, and network traffic of Hyper-V servers and virtual machines.
- SolarWinds SQL Sentry This is a monitoring system for SQL Server but it will also monitor virtualizations that support those databases, including Hyper-V.
- WhatsUp Gold – Infrastructure monitoring tool with an add-on that can monitor Hyper-V and VMware machines. Includes an autodiscovery feature and a threshold-based alert system.
- LogicMonitor – Network monitoring tool that automatically discovers virtual resources. Monitors VM health, performance, CPU utilization, memory usage, and more.
The best Microsoft Hyper-V monitoring tools
1. ManageEngine Applications Manager (FREE TRIAL)
ManageEngine Applications Manager is a package for monitoring hosted applications, which includes infrastructure systems, such as virtualizations. It is able to monitor Hyper-V, VMware, Nutanix AHV, and KVM systems. This service can monitor applications running on other servers on the network and on cloud platforms. It will monitor multiple applications simultaneously along with the server resources that they use.
Key Features:
- Tracks resource usage
- End user monitoring
- Virtual machine management
Why do we recommend it?
ManageEngine Applications Manager stands out as a robust monitoring solution designed for hosted applications, including comprehensive support for various infrastructure systems like Hyper-V, VMware, Nutanix AHV, and KVM. This tool goes beyond traditional monitoring by tracking resource usage, conducting end user monitoring, and managing virtual machines effectively. It’s a versatile solution, capable of monitoring multiple applications concurrently, both on local servers and cloud platforms.
Hyper-V isn’t the only virtualization that Applicaitons Manager can monitor it will also track VMware, Citrix Xen, Oracle VM, Nutanix AHV, RHV, and KVM. The service will also look at those applications that run on virtualizations. The system tracks all applications in a discovery routine and identifies how they link together. The tool generates an application dependency map from its findings.
Users of this tool can group together statistics on networks and physical servers alongside data about their virtual systems. The Applications Manager service is particularly useful for companies that run multiple virtual servers simultaneously and it can even watch over many virtualization systems, so if your business uses Hyper-V and VMware, you can watch them both with this single monitoring package.
Who is it recommended for?
This tool is highly recommended for businesses running multiple virtual servers simultaneously, especially those utilizing various virtualization systems like Hyper-V, VMware, Citrix Xen, Oracle VM, Nutanix AHV, RHV, and KVM. ManageEngine Applications Manager is ideal for enterprises seeking a unified monitoring package that covers both physical and virtual systems, making it a valuable asset for businesses with complex and diverse IT infrastructures. While it lacks forecasting for new demand, its extensive technology coverage and application dependency tracking make it a valuable addition to any IT monitoring strategy.
Pros:
- Monitors more than 150 technologies
- Also monitors containers and cloud systems
- Records application dependencies
Cons:
- Doesn’t provide forecasting for new demand
You can start by downloading the 30-day free trial.
EDITOR'S CHOICE
ManageEngine Applications Manager is our top pick for a Microsoft Hyper-V monitoring tool because this package is able to discover and map all applications running on a server, including virtualization software. Hyper-V isn’t the only hypervisor system that this package can track. It also has the ability to monitor VMware, Citrix, RHV, KVM, and Oracle VM systems. This package monitors all applications, so it will track the systems that run within your VMs as well. The tool constructs an application dependency map that identifies and demonstrates the external functions and microservices that an application uses. The package also tracks the capacity and utilization of server resources – these are included in the application dependency map. This documentation of the complex relationship between processes enables the service to predict upcoming resource usage and raise an alert if needs will soon exceed availability.
Download: Get a 30-day free trial
Official Site: https://www.manageengine.com/products/applications_manager/download.html
OS: Windows Server, Linux, AWS, and Azure
2. Paessler PRTG Network Monitor (FREE TRIAL)

Paessler PRTG Network Monitor is a network monitoring tool that monitors Hyper-V devices. The software measures the status, traffic, CPU load, and virtual memory of Hyper-V hosts, virtual machines, and Cluster Shared Volumes. To enable you to monitor virtual services, PRTG Network Monitor comes with a range of sensors designed specifically for virtualization monitoring.
Key Features:
- SaaS or on premises
- Hosts, VM, and cluster shares
- Alerts for performance problems
Why do we recommend it?
Paessler PRTG Network Monitor is a highly recommended network monitoring tool that extends its capabilities to effectively monitor Hyper-V devices. Offering a choice between SaaS or on-premises deployment, PRTG Network Monitor excels in measuring and reporting on crucial aspects such as status, traffic, CPU load, and virtual memory for Hyper-V hosts, virtual machines, and Cluster Shared Volumes. Specifically designed sensors for virtualization monitoring, such as the Hyper-V Host Server Sensor and Hyper-V Virtual Machine Sensor, provide granular insights into different segments of the virtual infrastructure.
Sensors like the Hyper-V Host Server Sensor and the Hyper-V Virtual Machine Sensor can be used to monitor different segments of your virtual infrastructure. For example, with the Hyper-V Virtual Machine Sensor, you can monitor the CPU usage, IDE disk read speed, and IDE disk write speed of a virtual machine.
There are also additional features like alerts and reports that you can use to react to performance concerns when they occur. You can configure alerts to be sent through email, SMS, push notifications, and Slack messages to notify users about issues. The alerts system is threshold-based and you can decide when you receive an alert.
Who is it recommended for?
This tool is particularly recommended for organizations seeking comprehensive network monitoring with a focus on Hyper-V environments. PRTG Network Monitor is suitable for businesses of various sizes, offering flexibility with deployment options. Its extensive range of sensors tailored for virtualization monitoring makes it an ideal choice for those relying on Hyper-V technology. The live monitoring dashboard, coupled with alerting features, ensures timely notifications and facilitates proactive responses to performance concerns, making it an excellent fit for businesses prioritizing network health and reliability.
Pros:
- Alert threshold levels that give technicians time to avert problems
- Correlates Hyper-V requirements with CPU, disk, and network availability
- Live monitoring dashboard shows stats in tables, charts, and dials
Cons:
- Requires multiple sensors to get full visibility into resource availability
PRTG Network Monitor is free for the first 100 sensors. If you require more then you will have to purchase a paid version. Paid versions start at $1,600 (£1,206) for 500 sensors and one server installation. You can download the 30-day free trial.
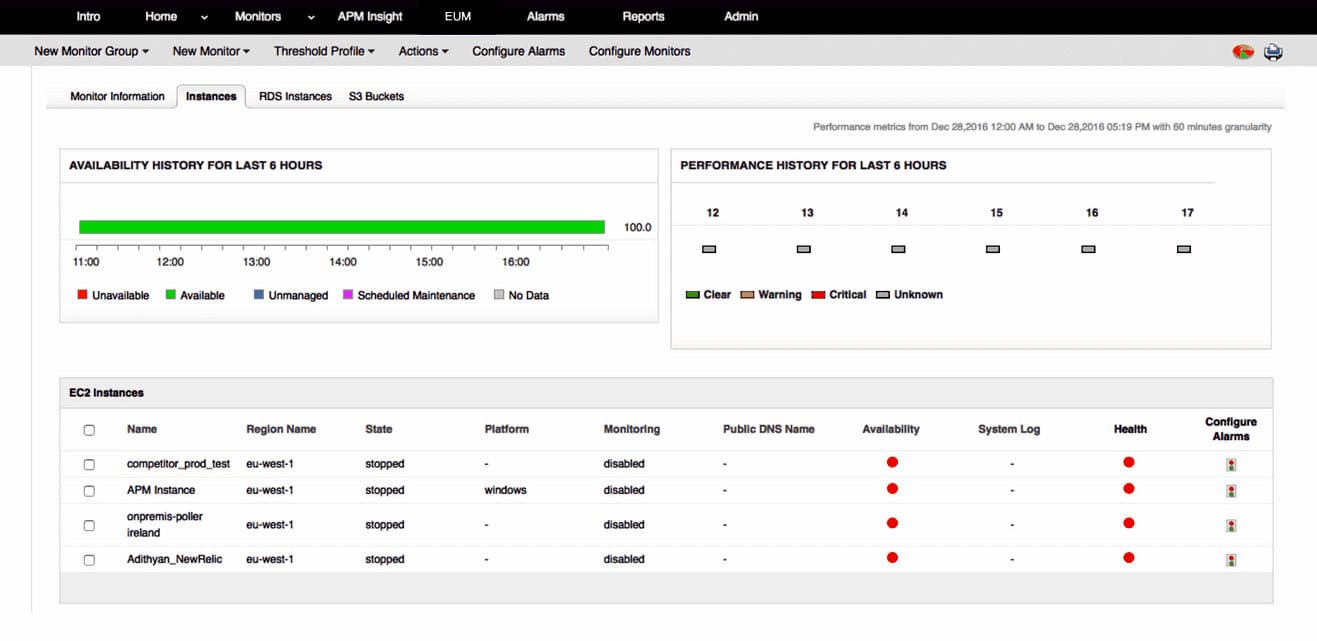
3. Site24x7 Hyper-V Performance Monitoring (FREE TRIAL)

Site24x7 Infrastructure is a server and application monitoring that identifies all of the services that support the front-end software that serves users directly. One of those services is set up for Hyper-V Performance Monitoring. The Infrastructure module is part of a wider platform of system administration tools that are hosted in the cloud. Network Monitoring can be added onto an Infrastructure subscription and both monitoring systems form part of the All-in-one package, which includes all of the monitoring services offered by Site24x7.
Key Features:
- Hyper-V, VMware, and Nutanix AHV
- CPU usage and processor count
- Runtime graphs
Why do we recommend it?
Site24x7 Infrastructure, with its specialized Hyper-V Performance Monitoring add-on, offers a comprehensive solution for server and application monitoring. As part of a cloud-hosted platform, it provides a holistic view of the services supporting front-end software, including efficient monitoring for Hyper-V, VMware, and Nutanix AHV environments. The integration seamlessly maps hypervisor structures, identifies VM allocations, and details resource allocations for both virtual and physical servers. With a user-friendly interface and real-time runtime graphs, this tool facilitates root cause analysis, sets performance thresholds, and issues alerts for proactive problem resolution.
The Hyper-V monitoring system in Site24x7 Infrastructure is an add-on service. It is free to use, but it needs to be activated. This is what Site24x7 calls an “integration.” The monitoring system automatically maps your hypervisor structure, identifying the allocations of VMs to virtual servers and detailing the resource allocations of each. Below the Hyper-V environment, the Infrastructure monitoring system is able to link together the underlying resources of the physical server that support Hyper-V activities.
The connections that Site24x7 identifies between VMs, Hyper-V servers, and physical servers enables root cause analysis to pinpoint the reasons for virtualization problems. The system places performance thresholds on all resources and raises an alert if any of these get crossed by deteriorating conditions. The alerts can be forwarded to technicians by SMS message or email. This allows staff to get on with other tasks, knowing the Site24x7 is keeping an eye on normal Hyper-V activities.
Who is it recommended for?
This tool is highly recommended for businesses seeking an all-encompassing monitoring solution for their virtual environments, especially those utilizing Hyper-V, VMware, and Nutanix AHV. Site24x7 Hyper-V Performance Monitoring is well-suited for organizations that prioritize cloud-based monitoring platforms, providing drilldown details for each VM, correlated monitoring for physical servers and networks, and efficient root cause analysis. While it lacks an on-premises version, its cloud-hosted nature ensures flexibility and accessibility for monitoring Hyper-V activities seamlessly.
Pros:
- Provides performance statistics for an entire virtual environment
- Drilldown details for each VM
- Correlated monitoring for physical servers and networks
Cons:
- No on-premises version
Site24x7 is a subscription service and you can get a 30-day free trial to test it for your business.
4. SolarWinds Virtualization Manager

SolarWinds Virtualization Manager is one of the top Hyper-v monitoring tools/virtualization monitoring solutions that provide visibility on virtual machine performance. From the dashboard, you can monitor Hyper-V virtual machines for issues such as high CPU utilization, high memory utilization, datastore latency, and more.
Key Features:
- Hyper-V, VMware, and Nutanix AHV
- Alert analysis
- Physical server resource monitoring
- Delete unused VMs
- Capacity demand forecasts
Why do we recommend it?
SolarWinds Virtualization Manager emerges as a top-tier Hyper-V monitoring tool, providing comprehensive visibility into virtual machine performance. Its dashboard facilitates the monitoring of Hyper-V virtual machines, offering insights into critical issues like high CPU and memory utilization, as well as datastore latency. The software excels in root cause analysis, allowing users to pinpoint the source of performance issues, especially in shared storage environments. With features like VM sprawl dashboard and capacity demand forecasts, SolarWinds Virtualization Manager ensures efficient resource allocation and optimal performance.
The software has been designed to help you find the root cause of performance issues. For example, you can view how virtual machines share storage and monitor services competing for I/O storage. You can see storage contention all the way from the virtual machine, to host, and cluster.
You can also troubleshoot for VM sprawl with the VM sprawl dashboard. The VM sprawl dashboard provides recommendations on how to free up resources and optimize performance. Here you’ll be able to see how resources like CPU and memory are allocated. The main value of the dashboard lies in its ability to stop losing resources to inactive machines.
Who is it recommended for?
This tool is highly recommended for IT professionals and administrators managing virtualized environments, particularly those utilizing Hyper-V, VMware, and Nutanix AHV. SolarWinds Virtualization Manager is ideal for enterprises looking to troubleshoot VM sprawl, estimate resource right-sizing, and enhance overall virtual system efficiency. While it offers a robust set of features for performance optimization, its lack of a SaaS version may make it more suitable for businesses with on-premises infrastructure.
Pros:
- Correlates VM server activity with physical server resources
- Estimates resource right-sizing
- Cleans up VMs
- Root cause analysis when problems arise
- See virtual system, physical server, and network activity data in one screen
Cons:
- No SaaS version
SolarWinds Virtualization Manager is a tool that’s ideal for enterprises that want to monitor the performance of virtualized resources. SolarWinds Virtualization Manager starts at a price of $2,995 (£2,275). You can download the 30-day free trial.
5. ManageEngine Free Hyper-V Performance Monitor

ManageEngine Free Hyper-V Performance Monitor is a utility you can use to monitor the CPU, memory, disk read/write, and network traffic of Hyper-V servers and virtual machines. The user interface lists all of your hosts on the left-hand side with a button showing the device’s status, which enables you to efficiently monitor multiple virtual machines.
Key Features:
- Maximum of two Hyper-V hosts
- No limit on VMs
- Physical server resource tracking
Why do we recommend it?
ManageEngine Free Hyper-V Performance Monitor stands out as a valuable utility for organizations seeking efficient monitoring of Hyper-V servers and virtual machines. This tool provides a user-friendly interface listing all hosts on the left-hand side, offering quick and easy access to the status of multiple virtual machines. While designed for a maximum of two Hyper-V hosts, it offers unlimited VM monitoring, making it suitable for businesses with moderate virtualization needs. The ability to track CPU, memory, disk read/write, and network traffic, along with advanced graphs showcasing CPU usage, enhances its monitoring capabilities.
When using ManageEngine Free Hyper-V Performance Monitor, the user can not only view basics such as whether VMs are powered on/off but also view more advanced graphs detailing the CPU usage of virtual machines. While this isn’t as advanced as ManageEngine Virtualization Monitor it is very useful.
To create alerts on virtual machine performance, the user can configure warning and critical threshold values for CPU utilization. That means that devices will be classified as Warning or Critical if they meet the parameters set by the user. Likewise, you can set the refresh time interval to determine how often the performance data is refreshed.
Who is it recommended for?
This utility is recommended for organizations that prioritize simplicity and effectiveness in monitoring a limited number of Hyper-V hosts and their associated virtual machines. With a focus on ease of use, ManageEngine Free Hyper-V Performance Monitor is suitable for businesses with a smaller-scale virtualization setup. It provides essential insights into server CPU, disk, and network activity, making it an ideal choice for those looking for a straightforward monitoring solution tailored to their specific Hyper-V environment.
Pros:
- Monitors server CPU, disk, and network activity for each host
- Records VM uptime
- Shows inactive VMs
Cons:
- Only for two hosts
ManageEngine Free Hyper-V Performance Monitor is one of the best free hyper-v monitoring tools, low-cost for Windows users. For a more full-featured monitoring experience upgrade to ManageEngine Virtualization Monitor. You can download it from this link here.
6. SolarWinds SQL Sentry

SolarWinds SQL Sentry is a monitor for SQL Server instances. It can be hosted on your own server or in the cloud. If you run SQL Server and Hyper-V, SQL Sentry is a great choice because it can monitor both systems.
Key Features:
- Monitors Hyper-V
- Correlates resource demand
- Double resource examination
Why do we recommend it?
SolarWinds SQL Sentry stands out as an excellent monitoring solution for organizations utilizing both SQL Server and Hyper-V. This tool is not limited to monitoring SQL Server instances; it extends its capabilities to include comprehensive monitoring for Hyper-V environments. Offering live representations of performance statistics, it tracks CPU usage, memory, and disk I/O activity, providing a dedicated section for Hyper-V statistics on its user-friendly dashboard. With the ability to correlate resource demand between SQL Server and Hyper-V, SQL Sentry ensures a holistic view, offering analytical tools for both live and historical performance data.
The Hyper-V monitoring part of SQL Sentry is a full monitoring tool. The system dashboard has a separate section for Hyper-V statistics. This shows live representations for a range of performance statistics. The service tracks CPU usage and also memory and disk I/O activity.
SQL Sentry tracks interactions between hosts and virtual machines and also records all of the performance metrics of the host as well as the VMs. The service watches the operating system and the physical server to correlate Hyper-V activity with system resource availability.
As well as presenting live data on SQL Server, Hyper-V, and server performance, SQL Sentry offers analytical tools, based on past performance. This offers two formats for past data examination. One is called Sample mode, which lets you extract a range of statistics for a specific point in time. The other system is called History mode, which shows time-series graphs for each statistic for a given period.
Who is it recommended for?
This tool is highly recommended for businesses running SQL Server and Hyper-V concurrently. Whether hosted on-premises or in the cloud, SolarWinds SQL Sentry proves beneficial in tracking resource demands, identifying issues, and offering insights into the correlation between SQL Server and Hyper-V activities. While its primary focus is SQL Server monitoring, organizations seeking a unified solution for SQL Server and Hyper-V monitoring will find SQL Sentry to be a valuable and efficient choice, especially with its analytical capabilities for both real-time and historical performance data.
Pros:
- Tracks SQL Server resource demands on Hyper-V and Hyper-V demand on servers
- Alerts for Hyper-V issues and well as database problems
- Shows where performance problems lie
Cons:
- Only suitable in conjunction with SQL Server monitoring
SentryOne offers two implementation models, which are a software package for installation on Windows Server and an Azure platform service. You can get a 14-day free trial of the on-premises version.
7. WhatsUp Gold (Virtualization Monitoring Add-On)

WhatsUp Gold is a top network monitoring provider that offers a Virtualization Monitoring Add-On for managing Hyper-V and VMware machines. WhatsUp Gold automatically discovers and maps virtual infrastructure so you can monitor the real-time of your virtual machines.
Key Features:
- An add-on
- Runs on Windows Server
- Links server resources to Hyper-V host demand
Why do we recommend it?
The Virtualization Monitoring Add-On by WhatsUp Gold is a commendable solution for organizations seeking efficient management of their Hyper-V and VMware machines. As an add-on to the WhatsUp Gold network monitoring platform, it seamlessly integrates with your existing infrastructure. The tool excels in automatic discovery and mapping of virtual infrastructure, providing real-time insights into the availability, CPU, memory, disk, and interface utilization of servers through a customizable dashboard. Its ability to link server resources to Hyper-V host demand enhances performance monitoring, making it a valuable addition to your network management toolkit.
View the real-time availability, CPU, memory, disk, and interface utilization of servers through the dashboard. The dashboard can be customized according to your environment. You can also generate reports that display information such as VIM, API version, number of CPU cores, powered on and off, and suspended VMs.
The tool also comes with a simple alert system. You can configure alert thresholds and receive notifications via email, SMS, Slack, or log files. The range of alert options gives you complete control over where you hear about performance updates.
Who is it recommended for?
This Virtualization Monitoring Add-On is recommended for businesses already utilizing the WhatsUp Gold network monitoring platform and seeking comprehensive oversight of their virtualization environments. It is particularly beneficial for organizations running both Hyper-V and VMware machines, offering a unified solution for monitoring and managing diverse virtual infrastructures. The customizable dashboard and alert system make it suitable for IT teams looking to streamline their monitoring processes and ensure optimal performance across virtual machines.
Pros:
- Discovers and maps Hyper-V environments
- Also monitors VMware
- Correlates Hyper-V performance to server resource availability
Cons:
- Not a standalone product
The WhatsUp Gold Virtualization Monitoring Add-On comes with the Total Plus edition and is available as an add-on for the Premium, MSP, and Distributed editions. However, you will have to request a quote from the sales team. You can download the free trial of WhatsUp Gold from this link here.
8. LogicMonitor

LogicMonitor is an infrastructure monitor with Hyper-V monitoring. The tool is easy to configure and all you need to start monitoring is to enter the Hyper-V server hostname and LogicMonitor will start to automatically discover virtual resources. From then on you can monitor health, performance, CPU utilization, memory usage, storage, network throughput, and more.
Key Features:
- Live activity graphs
- Historical analysis
- Alerts for performance problems
Why do we recommend it?
LogicMonitor stands out as a robust infrastructure monitoring tool with seamless Hyper-V monitoring capabilities. Its user-friendly configuration requires only the Hyper-V server hostname, and it instantly initiates the discovery of virtual resources, allowing for quick and efficient setup. The tool provides comprehensive monitoring of health, performance, CPU utilization, memory usage, storage, network throughput, and more. With live activity graphs and historical analysis, LogicMonitor ensures real-time visibility into your virtual environment, making it a top choice for organizations prioritizing ease of use and in-depth monitoring.
Resolving performance issues with LogicMonitor is relatively straightforward. You can view an overview of performance across all virtual machines. The overview is supported by graphs so you can easily see what devices are consuming the most resources.
There is a threshold-based alerts system so that you can receive updates on performance issues when they occur. There are pre-configured alerts for Hyper-V so you don’t need to configure notifications manually.
Who is it recommended for?
LogicMonitor is recommended for businesses seeking an infrastructure monitoring solution that includes effective Hyper-V monitoring. Its simplicity in configuration makes it suitable for IT teams looking for a hassle-free setup process. The tool’s ability to track various performance metrics across virtual machines, coupled with its threshold-based alerts system, caters to organizations focused on proactive issue resolution. LogicMonitor is ideal for those aiming to streamline monitoring processes while gaining valuable insights into resource utilization and overall performance.
Pros:
- Tracks physical servers and networks together with Hyper-V monitoring
- Alerts include tips on how to fix problems
- Enables cleanup to stop VM sprawl
Cons:
- Screens can be over-busy
There is a range of packages available to purchase from 50 devices upwards. However, you will need to request a quote from the company directly. You can download the 14-day free trial of LogicMonitor from this link here.
Hyper-V Monitoring Tools: Get Rid of Bottlenecks
Maintaining visibility over virtual devices is a challenge. If you don’t have a reliable monitoring solution then managing and optimizing resource usage amongst a group of virtual machines is almost impossible. Using a solution that provides you with real-time visibility allows you to stop performance bottlenecks from ruining your productivity.
Tools like ManageEngine Applications Manager, Paessler PRTG Network Monitor, and LogicMonitor are some of the top tools on this list. If you’re unsure about your requirements then starting with one of the free utilities can be a great way to dip your toes before committing to a more costly solution.