MongoDB is one of the most popular NoSQL databases in use today. The fact that it is a free, open-source database makes it the go-to solution for individuals and businesses looking for an affordable database that performs just as well as the other popular brands out there – free or otherwise. In this article, we will be looking at the best MongoDB monitoring tools to help such users and businesses get the most out of their database of choice.
Here’s our list of the seven best MongoDB monitoring tools:
- SolarWinds Database Performance Monitor (FREE TRIAL) Superior MongoDB monitoring tool made for enterprises looking for a bang for one’s buck and knowing that their investment will always be worth it. Start with a 14-day free trial.
- Site24x7 Server Monitoring (FREE TRIAL) Flexible and versatile MongoDB monitoring solution that requires installing plugins to create an overall management tool; it comes at an affordable price but performs like the best in the market. Access a 30-day free trial.
- ManageEngine Applications Manager (FREE TRIAL) Popular database and applications monitoring tool for deep insights into MongoDB performance; it also offers reports and forecasting features for trending. Start a 30-day free trial.
- Quest Foglight for MongoDB Monitoring tool that is effective as both a standalone solution or as part of an existing architecture; it has a tiny digital footprint but is powerful enough to be implemented in larger business environments.
- Datadog Application Performance Monitoring (APM) All-around solution to handle the whole network stack, and not only MongoDB installations; all dependencies are also taken into consideration.
- Dynatrace MongoDB Monitoring Monitoring solution that reads deep into metrics which is then visualized in interactive dashboards; it offers automatic recognition of sub-par performance for proactive action.
- LogicMonitor MongoDB Monitoring Management solution for database and server health; its native monitoring allows for in-depth business intelligence in cloud-based architectures.
What is MongoDB?
MongoDB is a flexible and scalable document database that also has querying and indexing features, just like any other database out there.
Ok, but what is a “document database”?
Document-oriented databases – or document databases – are databases that store data as documents. This is a more flexible structure when compared to other databases because fields can be used to store arrays, or two records can have different fields.
MongoDB represents these documents in a binary-encoded JSON format called BSON (Binary JSON) data-interchange format which adds speed to the flexibility of the JSON format, along with other data types.
Other examples of document databases include CouchDB and Amazon DynamoDB.
MongoDB – which can be either cloud-based or on-premises – is primarily targeted to help small-to-medium businesses (SMBs), and even larger organizations, store their data and perform read and write query operations as well as sort their data based on multiple field selections. This allows developers to access and analyze their data using ad-hoc queries, indexing, and data aggregation in real-time.
Some other MongoDB features include text or geo-based search, sharding, replication, data visualization, collaboration, and backup management.
MongoDB is also popular because it allows users to fully control it, mold it to meet their requirements, and follow a stable process – even when they run their most resource-intensive applications.
Why choose MongoDB?
MongoDB, as we have mentioned, is the most popular NoSQL, document-based database. It is used by some of the biggest tech companies: Facebook, eBay, Foursquare, Expedia, and Electronic Arts being a few of them. Their reasons for choosing this database solution include:
- Easy to install and use – even in a managed enterprise environment – and can also be easily integrated into their existing architectures.
- Offers an expressive query language and secondary indexes.
- Robust database storage solution that also has a strong consistency.
- Can be used in geo-application environments allowing for always-on global deployments of applications.
- Administrators can create visualizations and connect with Business Intelligence tools that are compatible with the MySQL protocol.
But, most importantly, MongoDB’s document model is simple enough for developers to master in a short time and it is a highly scalable database that can meet complex requirements. It comes with a default of drivers for over a dozen languages, but the user community has created dozens more.
Finally, MongoDB ensures high availability thanks to its replication mechanisms and horizontal scalability thanks to sharding – two main reasons it is currently the most widely adopted document storage system.
The Βest MongoDB Μonitoring Τools
Ok, let’s get back to our list of the best MongoDB monitoring tools. And, without further ado, they are:
1. SolarWinds Database Performance Monitor (FREE TRIAL)

The SolarWinds Database Performance Monitor (DPM) is a tool that is used to manage a wide range of databases, including MongoDB. It offers round-the-clock monitoring of mission-critical data storage solutions and presents it for big-data analysis on customizable dashboards for the convenience of administrators and developers alike.
Key Features:
- Comprehensive MongoDB Monitoring: Provides real-time visibility into critical MongoDB performance metrics, including latency, throughput, and error rates, enabling prompt identification and resolution of performance issues.
- Automated Profiling Analysis: Utilizes automated profiling to analyze MongoDB queries, offering insights into query execution times and resource utilization, which aids in optimizing database performance.
- Customizable Dashboards and Alerts: Offers intuitive dashboards that can be tailored to display key MongoDB metrics and set up alerts for specific thresholds, ensuring timely awareness and response to potential issues.
- Seamless Integration: Integrates MongoDB monitoring with other database systems within the SolarWinds Observability platform, providing a unified view of your database environment.
- User-Friendly Web Interface: Features a web-based interface that simplifies the monitoring and management of MongoDB databases, making it accessible for teams with varying levels of expertise.
Why do we recommend it?
SolarWinds Database Performance Monitor (DPM) stands out as one of the best MongoDB monitoring tools due to its comprehensive feature set tailored for efficient database management. With real-time and historical MongoDB data analysis, DPM enables administrators to swiftly identify and address performance issues. The SaaS platform with a web-based interface supports monitoring in various environments, including on-premises, cloud, or hybrid architectures, providing flexibility for diverse use cases. The Explorer feature facilitates a deep dive into query performance, and the adaptive fault detection system proactively identifies potential issues to prevent major outages. Specifically for MongoDB, DPM offers dedicated performance monitoring, insightful best practice guidance, and continuous evaluation of configurations to enhance security and compliance.
When it comes to MongoDB specifically, DPM has even more to offer:
- Performance monitoring designed especially for MongoDB and with a real-time and historical analysis of MongoDB query performances, executions, and index usages.
- MongoDB best practice guidance – the tool reviews the settings in place in the operating system, database instances, and replica sets to find any inconsistencies or divergence from MongoDB best practices.
- DPM continuously evaluates configurations to identify vulnerabilities while also providing ongoing compliance status updates – this helps mitigate the risk of cyberattacks due to misconfigurations in MongoDB deployments.
All in all, this suite of tools will help monitor the health of MongoDB installations as well as their dependent databases – both SQL and NoSQL types. It is also expandable as it can work with an array of other SolarWinds products.
Who is it recommended for?
SolarWinds DPM is recommended for administrators and developers seeking a robust MongoDB monitoring solution with a user-friendly interface. It caters to a broad spectrum of users, including those managing databases in on-premises, cloud, or hybrid setups. The tool’s versatility makes it suitable for organizations relying on both traditional and open-source databases alongside MongoDB. The MongoDB-specific features make it an excellent choice for businesses looking to ensure optimal MongoDB query performance, adherence to best practices, and ongoing compliance monitoring. SolarWinds DPM is adaptable and scalable, making it ideal for organizations of varying sizes and complexities, offering seamless integration with other SolarWinds products for a comprehensive monitoring solution.
Pros:
- Real-Time Monitoring: Enables continuous tracking of MongoDB performance, allowing for immediate detection and remediation of issues.
- Automated Query Analysis: Provides in-depth analysis of query performance without manual intervention, facilitating efficient optimization efforts.
- Customizable Alerts: Allows setting specific thresholds for various performance metrics, triggering alerts to keep administrators informed of potential problems.
- Integrated Platform: Offers a cohesive monitoring solution for multiple database types, streamlining database management processes.
- User-Friendly Interface: The intuitive web-based interface enhances accessibility and ease of use for monitoring and managing MongoDB databases.
Cons:
- Initial Setup Complexity: Configuring the monitoring for MongoDB may require technical expertise, posing challenges for users without a technical background.
You can try SolarWinds Database Performance Monitor through a free and fully functional 14-day free trial.
2. Site24x7 Server Monitoring (FREE TRIAL)

Site24x7 Server Monitoring provides website monitoring to diagnose performance issues, receive instant alerts, and troubleshoot any unplanned downtimes for any server, including MongoDB – all you need to do is install a plugin. In fact, Site24x7 has over 100 plugin integrations that are ready to use and allow for the monitoring of servers like MySQL, Apache, and Nagios. For the savvier administrator, there is the option to write their own plugin – using Python, Shell, PowerShell, Batch, or VB – and monitor any type of data they may want.
Key Features:
- Comprehensive Server Monitoring: Provides real-time monitoring of server performance across various operating systems, including Windows, Linux, and macOS, ensuring optimal uptime and resource utilization.
- Application Performance Monitoring (APM): Offers deep visibility into application performance for platforms such as Java, .NET, Ruby, PHP, and Node.js, facilitating efficient troubleshooting and optimization.
- Network Device Monitoring: Monitors critical network devices like firewalls, switches, and routers, providing insights into network health and aiding in the swift resolution of connectivity issues.
- Cloud Infrastructure Monitoring: Supports monitoring of cloud services from providers like AWS, Azure, and Google Cloud Platform, enabling unified oversight of hybrid environments.
- Customizable Alerts and Reporting: Allows setting up tailored alerts and generating detailed reports, aiding in proactive issue management and informed decision-making.
Why do we recommend it?
Site24x7 Server Monitoring is recommended as a top MongoDB monitoring tool due to its versatility and comprehensive features. With over 100 ready-to-use Plugin Integrations, including MongoDB, and the option to create custom plugins, it offers a flexible solution for monitoring servers like MySQL, Apache, and Nagios. The tool provides essential server performance metrics, ensuring effective monitoring of server health and availability. The MongoDB plugin, facilitated by lightweight agents, enables instant monitoring initiation, disk usage forecasting, and network traffic analysis. The root cause analysis (RCA) reports and IT Automation tools empower administrators to proactively address server issues and implement preventive measures based on a wealth of performance metrics. With user-friendly dashboards, instant alerting mechanisms, and cost-effectiveness, Site24x7 Server Monitoring stands out as an excellent choice, particularly for budget-conscious businesses seeking a premium monitoring solution.
The tool offers server performance monitoring using key metrics—including CPU usage by a processor or by core, used and free memory, and more—to monitor server availability and health.
And, once the MongoDB plugin has been installed using lightweight, easy-to-install agents, administrators can:
- Instantly start monitoring their MongoDB servers.
- Obtain a forecast on their disk usage, and then plan for optimal usages in the future.
- Monitor and analyze the network traffic that travels to and from their servers to proactively resolve network issues and outages.
- Examine the performance of services and processes to understand their effects on system resources; they can then use a dedicated mobile app to start, stop or delete them.
- Receive alerts notifying them of unauthorized accesses because a server is always busy with both foreground and background jobs and it becomes difficult to keep track of everything that is being created or modified on it.
- Extract detailed root cause analysis (RCS) reports for every server issue and, based on the analysis, automate fault resolution with exclusive IT Automation tools.
Finally, administrators can take full control of their domains by implementing preventive measures that are based on over 60 performance metrics, highly intuitive dashboards, IT Automation, and instant alerting mechanisms to monitor, warn about, and help resolve issues.
Who is it recommended for?
Site24x7 Server Monitoring is recommended for businesses with budget considerations prioritizing a feature-rich and cost-effective MongoDB monitoring solution. Its extensive plugin integrations and custom plugin capabilities cater to both novice and experienced administrators seeking flexibility in monitoring various servers, including MongoDB, MySQL, Apache, and Nagios. The solution’s user-friendly dashboards and instant alerting mechanisms make it suitable for administrators looking for an intuitive and efficient monitoring experience. Site24x7 is an ideal choice for organizations aiming to maintain optimal server health, diagnose issues proactively, and implement preventive measures without compromising functionality or budget constraints.
Pros:
- Ease of Use: Users appreciate the intuitive interface and straightforward setup process, which facilitate efficient monitoring and management.
- Comprehensive Monitoring Capabilities: The platform’s ability to monitor a wide range of services and devices provides a holistic view of the IT infrastructure.
- Real-Time Monitoring: Offers real-time insights into system performance, enabling prompt detection and resolution of issues.
- Scalability: Designed to accommodate the monitoring needs of both small businesses and large enterprises, adapting to organizational growth.
- Responsive Customer Support: Users have reported positive experiences with the support team, noting their responsiveness and helpfulness.
Cons:
- Pricing Structure: Certain advanced monitoring features may incur additional costs, which could be a consideration for budget-conscious organizations.
Site24x7 Server Monitoring is a good choice for businesses with a tight IT budget looking for a premium solution. Get started with a 30-day free trial .
3. ManageEngine Applications Manager (FREE TRIAL)

Most administrators know that ManageEngine is one of the more popular database and applications management tools out there. It shouldn’t come as a surprise, then, that Applications Manager is being included in this article. This monitoring tool supports MongoDB 3.6.2 (and older versions) as well as mongod and mongos services.
Key Features:
- Comprehensive Application Monitoring: Provides real-time monitoring for a wide range of applications, including web servers, databases, and cloud services, ensuring optimal performance and availability.
- Application Discovery and Dependency Mapping (ADDM): Enables one-click discovery of applications and their interdependencies, offering a holistic view of the IT infrastructure for efficient management.
- KPI Monitoring: Tracks over 100 key performance indicators, such as CPU and memory utilization, resource availability, and response times, facilitating proactive performance management.
- Advanced Reporting: Offers powerful reporting tools with over 100 pre-designed reports, aiding in capacity planning, trend analysis, and informed decision-making.
- Scalability: Supports monitoring of up to 50,000 servers or applications, making it suitable for organizations of various sizes.
Why do we recommend it?
ManageEngine Applications Manager is recommended for MongoDB monitoring due to its established reputation as a reliable database and applications management tool. This monitoring solution supports MongoDB 3.6.2 and older versions, offering comprehensive insights into key performance parameters and the ability to identify and troubleshoot potential issues before impacting end-user experience. With features like lock stats monitoring, database operation statistics, and detailed insights into journal entries, administrators can ensure optimal MongoDB instance performance. The tool’s historical reports, trend analysis, and alerting capabilities, including configurable actions, contribute to effective monitoring and management of MongoDB environments. Additionally, the incorporation of machine learning techniques for load forecasting enhances the tool’s ability to plan for database server capacity.
Administrators can monitor MongoDB with in-depth insights into important key performance parameters, spot bottlenecks, and troubleshoot these (and other) issues before they affect the end-users UX. They can monitor lock stats – such as the number of read/write locks and active users performing those operations – to prevent any latency problems.
It also provides statistics on database operations – along with replication and sharding operation details – with which administrators can ensure that they are running their MongoDB instances at optimal rates.
MongoDB registers every change in a journal, and monitoring these entries gives administrators insights into loads. Applications Manager also uses polled data – like the commits to a journal in the last commit interval, commits behind a write lock, and commits before a scheduled interval – to create these in-depth insights.
And, of course, administrators can also get historical reports, over a period of time, and compare them to find trends or spot recursive errors. They can then set threshold values for important metrics and receive alerts (or even configure actions to take) when they are not met.
Finally, ManageEngine Application Manager’s comprehensive reports help to evaluate the performance and trends of a MongoDB installation, while machine learning techniques help in forecasting the load and plan capacity of the database servers.
Who is it recommended for?
ManageEngine Applications Manager is recommended for administrators and organizations seeking a proven and robust solution for MongoDB monitoring. Its compatibility with MongoDB 3.6.2 and support for essential performance metrics make it suitable for those managing MongoDB instances. Administrators looking to proactively address potential issues, analyze historical data for trends, and receive alerts based on configurable thresholds will find this tool valuable. The machine learning capabilities further position Applications Manager as an ideal choice for organizations aiming to forecast and plan for MongoDB database server capacity effectively.
Pros:
- Intuitive User Interface: Features a user-friendly web client that simplifies navigation and monitoring tasks, enhancing user experience.
- Automated Alerts: Provides automated SMS and email notifications for performance issues, enabling prompt response and minimizing downtime.
- Comprehensive Monitoring Capabilities: Supports a wide array of applications and servers, offering a unified monitoring solution across diverse environments.
- Powerful Reporting Tools: Assists in identifying bottlenecks and optimizing performance through detailed reports and root cause analysis views.
- Application Discovery: Facilitates easy discovery and mapping of applications, providing clear visibility into IT resources and their relationships.
Cons:
- Performance Issues with Large Datasets: Some users have reported that the interface can become sluggish when handling large volumes of data, necessitating performance optimization.
Try ManageEngine Applications Manager FREE for 30 days.
4. Quest Foglight for MongoDB

Foglight for MongoDB is designed to provide enterprises with a powerful tool that can act as a standalone solution, or become part of a broader cross-platform database monitoring system. It supports the monitoring of key functions including the server itself, as well as its queries, indexing, replication, load balancing, and file-storage health.
Key Features:
- Global View: Provides quick access to health information, key performance metrics, and critical alarms for all your MongoDB database instances, enabling immediate action to resolve performance issues.
- Connection Monitoring: Easily tracks the number of current connections and the associated memory requirements, helping to manage and optimize resource utilization.
- Collection Statistics: Offers detailed insights into collection data, including properties, data storage, and sharding information, facilitating efficient data management.
- Memory Operations Monitoring: Monitors metrics for physical and virtual memory, page file memory, and rates, providing a comprehensive view of memory usage and performance.
- Operations Monitoring: Provides counts for various operations such as queries, writes, documents, and commands, aiding in the analysis of database activity and performance.
Why do we recommend it?
Quest Foglight for MongoDB is recommended as a powerful and versatile tool designed for enterprises seeking robust MongoDB monitoring capabilities. Whether used as a standalone solution or integrated into a cross-platform database monitoring system, Foglight supports comprehensive monitoring of key functions, including server queries, indexing, replication, load balancing, and file-storage health. The tool’s ability to centralize database management, provide real-time and historical diagnostics, and offer analytics enhances its effectiveness. Notably, Foglight supports MongoDB 2.4 or later, ensuring compatibility with modern MongoDB versions. Its memory tracking and analysis, database operation insights, page fault tracking, and intelligent alerting make it a comprehensive solution for monitoring MongoDB installations.
Foglight for MongoDB helps centralize the management of cross-platform databases and provides alerting and notification workflows, real-time and historical diagnostics, and reporting, as well as for analytics of collected data. Looking into more features we get:
- Foglight, which supports MongoDB 2.4 or later, can be deployed both on-premises or as a cloud-based monitoring solution.
- It uses memory tracking and analysis to keep an eye on all aspects of memory utilization – including allocated memory and resident memory – with alerting capabilities if allocated memory isn’t enough to hold all indexes or is insufficient for peak performances.
- It offers database operation analysis to track and analyze database loads along with insights into database operation statistics like details on replication lags and sharding.
- It has page fault tracking capabilities to receive alerts when the number of page faults is high or increasing, which gives administrators enough time to increase allocated memory.
- Intelligent alerting prevents false alerts with flexible, customizable thresholds to ensure that alarms are triggered only when baselines are breached.
Although it can perform all these tasks to keep a MongoDB installation safe, Foglight for MongoDB has a light digital footprint which makes it a good choice for networks with limited bandwidth resources available.
Who is it recommended for?
Quest Foglight for MongoDB is recommended for enterprises and administrators in need of a feature-rich and adaptable MongoDB monitoring solution. Its support for MongoDB 2.4 or later makes it suitable for users with modern MongoDB deployments. Organizations requiring centralized management of cross-platform databases, along with real-time and historical diagnostics, will find Foglight valuable. The tool’s ability to analyze memory utilization, track database operations, and provide intelligent alerting with customizable thresholds caters to users aiming for proactive monitoring and effective issue resolution. Foglight’s light digital footprint further positions it as a favorable choice for networks with limited bandwidth resources.
Pros:
- Comprehensive Monitoring: Delivers in-depth monitoring capabilities for MongoDB, offering real-time and historical diagnostics to ensure optimal database performance.
- Centralized Management: Allows for the centralized management of cross-platform databases, providing consistent alerting and notification workflows across different database systems.
- Customizable Dashboards and Reports: Enables the creation of tailored dashboards and reports, allowing users to efficiently share findings and insights with relevant stakeholders.
- Proactive Health Checks: Facilitates proactive health checks of MongoDB databases, helping to identify and address potential issues before they impact operations.
- Scalability: Supports both on-premises and cloud deployments, making it adaptable to various infrastructure setups and scalable as organizational needs evolve.
Cons:
- Complexity for New Users: The extensive feature set may present a learning curve for new users, requiring time to fully understand and utilize the platform effectively.
- Cost Considerations: The advanced features and capabilities may come at a higher price point, which could be a consideration for smaller organizations with limited budgets.
Download a FREE trial of Foglight for MongoDB.
5. Datadog Application Performance Monitoring (APM)

Datadog Application Performance Monitoring (APM) provides end-to-end distributed monitoring – from frontend devices to the databases in the back. By seamlessly correlating distributed traces with frontend and backend data, Datadog APM allows for the monitoring of service dependencies, reducing latency, and eliminating errors so end-users get the best possible experience out of their databases.
Key Features:
- End-to-End Tracing: Tracks requests across distributed systems, providing visibility into every layer of an application stack, from frontend to backend services, enabling quick identification of performance bottlenecks.
- Real-Time Performance Metrics: Offers real-time monitoring of key application performance indicators, such as latency, error rates, and throughput, to maintain application health and reliability.
- AI-Driven Anomaly Detection: Utilizes machine learning to detect unusual patterns in application performance metrics, allowing proactive issue resolution before users are impacted.
- Custom Dashboards: Provides customizable dashboards to visualize key metrics and trends, offering a tailored monitoring experience that aligns with specific operational needs.
- Seamless Integration: Integrates with a wide range of tools and platforms, including AWS, Azure, Kubernetes, and database systems, for a unified monitoring experience across diverse environments.
Why do we recommend it?
Datadog APM is recommended as an end-to-end distributed monitoring solution, offering seamless correlation of distributed traces with frontend and backend data. This capability allows for comprehensive monitoring of service dependencies, reducing latency, and eliminating errors to ensure optimal user experiences with databases. The platform’s easy deployment, quick start for application performance monitoring, and the ability to collect, search, and analyze live traces make it a user-friendly and efficient choice. Datadog APM’s out-of-the-box service dashboards provide code-level visibility, aiding administrators in swiftly identifying the causes of errors and latencies.
Looking at more eye-catching features, we have:
- Datadog APM is easy to deploy – it only takes seconds to start application performance monitoring of hosts, containers, serverless functions, and PaaS.
- Once up and running, it can collect, search, and analyze 100% of traces live for the data that has been received over the past 15 minutes.
- It can also retain errors and high latency traces automatically for 15 days.
- APM has out-of-the-box service dashboards that give code-level visibility into issues which helps administrators pinpoint the causes of errors and latencies in a short time.
The Datadog Agent is an open-source, and easy install, software that collects and reports on metrics extracted from hosts and database servers – like MongoDB. These metrics are then made accessible to Datadog dashboards where they are visualized and can be monitored easily. Administrators can therefore correlate the performance of their MongoDB installations to see how they are affecting, or affected by, other applications that interface with them.
Incidentally, these dashboards can be cloned, customized, or even integrated with other metrics from any part of the stack to get a bigger picture.
Once issues are spotted, or if there is any other need for communication, they can be easily reported using platforms like Slack, PagerDuty, or HipChat – all of which are examples of platforms that integrate well with Datadog.
Datadog APM would be the ideal choice for SMBs looking for a simple solution that is both highly effective and all-inclusive at the same time.
Who is it recommended for?
Datadog APM is ideal for small and medium-sized businesses (SMBs) seeking a simple yet highly effective and all-inclusive solution for application performance monitoring. Its easy deployment and compatibility with various environments, including hosts, containers, serverless functions, and PaaS, make it suitable for organizations with diverse infrastructure needs. The platform’s user-friendly features, such as live trace analysis and retention of errors and high latency traces, cater to users looking for real-time insights and historical data for up to 15 days. Datadog APM is well-suited for SMBs that prioritize simplicity, effectiveness, and seamless integration with communication platforms like Slack, PagerDuty, or HipChat.
Pros:
- Comprehensive Observability: Combines application, infrastructure, and log monitoring into a single platform, providing a holistic view of system performance.
- Scalability: Adapts to the needs of small applications and enterprise-level systems, making it suitable for businesses of all sizes.
- Customizable Alerts: Offers highly configurable alerting capabilities to notify teams of performance issues based on predefined thresholds or anomalies.
- Real-Time Insights: Enables teams to monitor and troubleshoot application issues in real time, minimizing downtime and improving user experience.
- Ease of Integration: Works seamlessly with existing workflows, reducing the complexity of setup and improving operational efficiency.
Cons:
- High Cost for Large Setups: The pricing structure can become costly for organizations with extensive monitoring needs, particularly for high-volume environments.
- Resource Overhead: Some users have reported that the system’s resource usage can be significant when monitoring large-scale applications.
Try Datadog Application Performance Monitoring FREE for 14 days.
6. Dynatrace MongoDB Monitoring

Dynatrace’s dedicated tool – dubbed MongoDB Monitoring tool – starts to auto-detect MongoDB databases as soon as its agent has been installed. Once it is up and running, it starts visualizing the data it gathers. This, for example, involves reading deep into the detailed metrics for every single database statement which helps in tuning rogue applications and services that connect to a database. It can even visualize how apps use the databases by showing detailed usage characteristics which can later help make configurations easier to perform.
Key Features:
- Comprehensive Monitoring: Provides real-time visibility into MongoDB performance metrics, including current connections, available connections, and assertions, enabling prompt identification and resolution of potential issues.
- Flexible Deployment Options: Supports both local monitoring via OneAgent and remote monitoring through ActiveGate, accommodating various infrastructure setups and ensuring seamless integration.
- MongoDB Atlas Integration: Offers dedicated extensions for monitoring MongoDB Atlas environments, delivering insights into the health of projects, clusters, and nodes without requiring OneAgent installation.
- Customizable Dashboards: Allows the creation of tailored dashboards to visualize key MongoDB metrics, facilitating efficient monitoring and quick access to critical information.
- Proactive Alerting: Enables the configuration of alerts based on predefined thresholds, ensuring timely notifications about performance anomalies and aiding in proactive issue management.
Why do we recommend it?
Dynatrace MongoDB Monitoring excels in visualizing detailed metrics for each database statement, providing insights for tuning applications and services connected to databases. Its ability to showcase how applications utilize databases aids in configuring settings effectively. The default baselining approach sets performance standards, triggering alerts for underperformance and facilitating quick issue pinpointing. Dynatrace offers process-level visibility into database performance, assisting in the identification of failing components. Notably, its MongoDB performance tuning capabilities, covering health verification, VM performance analysis, database access optimization, and network data analysis, make it a comprehensive solution.
Dynatrace automatically recognizes when a database is not performing at its best; a default baselining approach sets the bar and any underperformance triggers an alert that pinpoints the problem. It also offers process-level visibility into database performance to help identify any failing components.
Perhaps, the best thing about this tool would be its MongoDB performance tuning capabilities. A MongoDB database performance checklist usually involves tasks like verifying the hosts’ health by monitoring server data, ensuring optimal VM performance by analyzing their metrics, optimizing database access with application data, and analyzing the network data to see any issues with database communication capabilities – all of which can be done with the help of Dynatrace MongoDB Monitoring.
It can check the CPU, memory, and disk space metrics to make sure all MongoDB processes have sufficient resources available. It can also monitor page faults per second – having too much of which could be an indication that a host is out of memory.
Who is it recommended for?
Dynatrace MongoDB Monitoring is ideal for organizations seeking an advanced monitoring tool with automatic detection features. Its visualization capabilities cater to administrators and developers looking for in-depth insights into database statements, application usage characteristics, and performance metrics. The tool’s alerting mechanism and process-level visibility make it suitable for users who prioritize proactive issue identification and resolution. Additionally, Dynatrace is recommended for those focusing on MongoDB performance tuning, as it efficiently checks CPU, memory, disk space metrics, and monitors page faults per second for optimal database health.
Pros:
- In-Depth Visibility: Delivers detailed insights into MongoDB performance, helping teams to quickly identify and address bottlenecks.
- Adaptable Monitoring Solutions: Accommodates various deployment scenarios, including on-premises and cloud-based MongoDB instances, providing flexibility in monitoring strategies.
- Seamless Integration: Integrates smoothly with existing Dynatrace environments, offering a unified monitoring experience across diverse technologies.
- User-Friendly Interface: Features intuitive dashboards and visualization tools, simplifying the monitoring process and enhancing user experience.
- Proactive Issue Detection: The alerting system enables teams to address potential problems before they impact end-users, maintaining system reliability.
Cons:
- Learning Curve: The extensive feature set may require time for new users to fully understand and utilize effectively.
- Resource Intensive: Comprehensive monitoring capabilities can be resource-intensive, potentially impacting system performance if not properly managed.
- Cost Considerations: Advanced features and scalability may come at a higher price point, which could be a consideration for smaller organizations with limited budgets.
Try Dynatrace MongoDB Monitoring FREE for 15 days.
7. LogicMonitor MongoDB Monitoring
LogicMonitor’s MongoDB Monitoring package offers to monitor for database and server health. This MongoDB monitoring package is compatible with versions 4.1 or older. Thanks to its native MongoDB monitoring, users of this tool get in-depth performance and availability monitoring right out of the box, without having to spend hours writing custom scripts.
Key Features:
- Comprehensive MongoDB Metrics: Tracks critical MongoDB performance metrics, including query execution time, memory usage, cache efficiency, replication lag, and active connections, ensuring optimal database health.
- Dynamic Threshold-Based Alerts: Provides out-of-the-box alerting thresholds for MongoDB metrics, which can be fine-tuned to reduce noise and prioritize critical notifications.
- JSON Query Monitoring: Allows users to execute and parse JSON queries, enabling custom monitoring of specific database behaviors and metrics that are unique to operational requirements.
- Replica Set and Cluster Monitoring: Offers insights into replication lag, secondary node health, and cluster configurations to maintain high availability and redundancy.
- Unified Monitoring Platform: Integrates MongoDB monitoring with other systems and applications, delivering a holistic view of IT infrastructure performance.
Why do we recommend it?
LogicMonitor’s MongoDB Monitoring stands out for its native compatibility with MongoDB versions up to 4.1. Offering comprehensive performance and availability monitoring without the need for custom scripts, LogicMonitor ensures a hassle-free experience for users. The tool provides in-depth insights into MongoDB statistics, including operations per second, memory usage, and locks. Its support for clusters, monitored directly through the MongoDB Java Driver, enables proactive surveillance of servers and clusters. LogicMonitor excels in implementing predefined alert thresholds, ensuring the continuous health, performance, and availability of MongoDB services. The tool’s extensibility allows administrators to add trending and alerting for any queried metric, providing valuable business intelligence.
With LogicMonitor, companies have the ability to not only monitor general MongoDB statistics – like operations per second, memory usage, and locks – but can also extract valuable business intelligence from their data.
It has replication for clusters where the package uses its MongoDB Java Driver to monitor the servers directly. This makes it possible for LogicMonitor to proactively keep tabs on all MongoDB servers and clusters, allowing for the implementation of predefined alert thresholds to help ensure the health, performance, and availability of services.

Administrators can easily add trending and alerting for any metric that is queried from MongoDB because of the tool’s extensibility to parse the JSON output of the queries. Also, the tool’s built-in expressions allow for the combination of metrics to calculate resource availability and usage, store them for future retrieval, report on them via dashboards or graphical presentation, or even set them as thresholds for alerting purposes. These alerts can be used to indicate if the thresholds have been exceeded.
Some more features worth mentioning include:
- MongoDB Replication Monitoring – which automatically discovers all replicas and arbiters, tracks their lag, health, and other metrics.
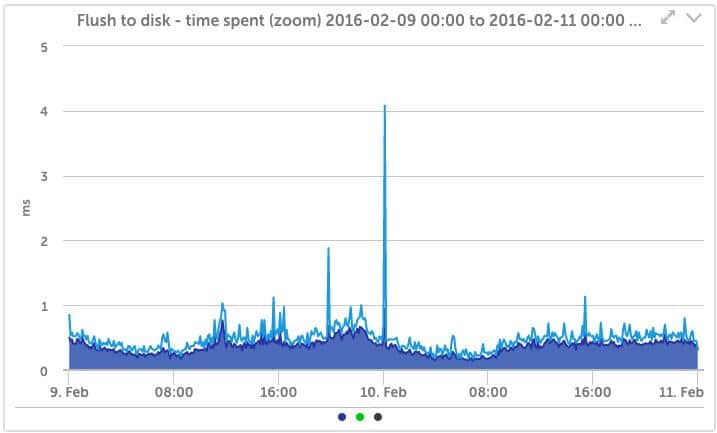
- MongoDB Flush Time – to track the time spent flushing to a disk and alert administrators when they are overloading the IO system of the Primary or Secondary servers.
- Cluster-Wide views – used to easily generate domain-wide views of all operations across all replicas.
- MongoDB Query activity – to monitor the amount and type of queries performed over time with the intention of tracking MongoDB activity increases or changes over time.
LogicMonitor MongoDB Monitoring is the ideal tool for businesses looking for a monitoring tool that can take care of their cloud-based infrastructure that also includes their MongoDB installation.
Who is it recommended for?
LogicMonitor MongoDB Monitoring is recommended for organizations using MongoDB versions 4.1 or older, seeking a hassle-free and native monitoring solution. It is particularly suitable for users who prioritize ease of use and do not want to invest extensive time in writing custom scripts. The tool’s compatibility with MongoDB clusters makes it ideal for administrators overseeing complex database infrastructures. Additionally, LogicMonitor is recommended for those who value extensibility and wish to add trending and alerting for MongoDB metrics effortlessly. Its robust alerting mechanisms are beneficial for maintaining optimal resource availability and usage.
Pros:
- Replica Set Health Insights: Provides detailed visibility into the status of MongoDB replica sets, ensuring data consistency and availability across nodes.
- Custom Query Monitoring: Enables users to monitor unique metrics by parsing JSON output from MongoDB queries, providing flexibility for specific use cases.
- Pre-Built Dashboards: Offers pre-configured MongoDB-specific dashboards that reduce setup time and display key metrics out of the box.
- Seamless Integration: Easily integrates with other LogicMonitor capabilities, allowing users to monitor MongoDB alongside other databases, servers, and applications.
- Advanced Alerting System: Delivers granular alerting options, such as setting different severity levels, ensuring that administrators are informed of critical issues without being overwhelmed.
Cons:
- Complex Customization Requirements: Customizing advanced queries and alerts may require a deeper understanding of MongoDB and LogicMonitor, posing challenges for less experienced users.
- High Cost for Large Deployments: As MongoDB deployments scale, LogicMonitor’s pricing can become expensive, making it less ideal for budget-conscious organizations.
- Integration Limitations for Niche Tools: While integrations are extensive, some niche MongoDB-related tools may not integrate directly, requiring workarounds.
Sign up for a 14-day FREE trial of LogicMonitor MongoDB Monitoring.