System objects, applications, and service-oriented networks may all be monitored and managed with the help of Java Management Extensions (JMX), a Java technology. MBeans are used to represent the various resources (Managed Beans).
Here is our list of the best JMX monitoring tools:
- ManageEngine Applications Manager EDITOR’S CHOICE This package covers standard on-premises software and web assets. Because web application monitoring depends on supporting services such as JMX and memory management, those components are included in its monitoring scope. Runs on Windows Server, Linux, AWS, and Azure. Get a 30-day free trial.
- Site24x7 (FREE TRIAL)This cloud-delivered service monitors networks, applications, endpoints, cloud services, and web applications. It also includes distributed tracing and code-level profiling. Get a 30-day free trial.
- Jolokia A remote JMX (Java Management Extensions) bridge that exposes JMX beans over HTTP using JSON. Runs on any operating system with a JVM.
- Jmxterm An open-source, interactive JMX client delivered through a command-line interface and written in Java. Free to use and runs on a JVM.
- Visualvm An on-premises monitoring and profiling tool for Java applications that provides visual performance analysis. Runs on Windows, macOS, and Linux.
- Jconsole On-premises software included with the Java Development Kit (JDK) for monitoring and managing Java applications locally or remotely. Runs on Windows, Linux, macOS, Linux, and Solaris.
- JDK Mission Control A suite of tools for monitoring, managing, profiling, and troubleshooting Java applications that works with Java Flight Recorder. Runs on Windows, macOS, and Linux.
- Zabbix A free, on-premises full-stack observability system that includes Java monitoring and is also offered as a paid SaaS service. Runs on Linux.
- Hawt.io A free, open-source, modular web console used to manage Java applications. Runs over JVM.
- Nagios A Linux-based full-stack observability platform that can be extended through plug-ins and includes support for JMX monitoring. Available in free and paid versions.
Java 1.5 introduced the JMX Framework, and since its inception, it has been widely accepted by Java developers. Java applications may be managed locally or remotely using this infrastructure, which is scalable, dependable, and pleasant.
JMX has a three-tiered design:
- This level contains the probes (called MBeans) that reflect the monitored resource’s properties. Another name for this layer is “Instrumentation”.
- Application-level JMX Agents and MBeanServers expose the MBeans.
- MBeanServer may be accessed remotely using connectors and adaptors at the third level of management. Access to the MBeanServer API may be accomplished remotely via a connector using a variety of methods of communication (RMI, IIOP, WS-*, JMS, and more).
JMX Monitoring analyzes data from Managed Beans (MBeans) provided via a JVM port (JMX console). Data about the setup and use of a JVM resource is provided by an MBean, which is represented by a JavaBean class.
It is common to classify MBeans according to their scope of use. A Java virtual machine (JVM) is likely to have numerous domains. Due to the ease with which custom MBeans may be created using the JMX interface, bespoke domains associated with an application are possible.
The importance of JMS monitoring
SNMP is for network devices, whereas JMX is for Java applications. Thus, JMX is a core mechanism that is commonly utilized by monitoring and management tools to get performance data about the applications.
Multiple approaches exist to make use of JMX
- JMX exposes performance metrics for most common Java application servers, such as Tomcat, JBoss, and WebLogic. The JMX interface is useful for both agent and agentless monitoring of application servers.
- JMX is used to monitor the JVMs executing on a server. To gather critical performance indicators, the agents connect to the JVM’s standard MBeans. This includes the number of threads operating in the JVM when garbage collection occurs, the amount of memory that is freed, and so on.
- MBeans accessible by apps running on these application servers may be monitored.
Java Monitoring Tools
If you want to keep your customers pleased and your company functioning, you must ensure that your Java app is always working smoothly. Java Virtual Machine (JVM) is not enough to be installed, and you will need to actively investigate the JVM’s workings.
With the aid of Java Monitoring Tools, you can keep tabs on system performance and identify problems that might negatively impact your customers’ experiences with your product. Your Java program may be monitored using several tools. The features offered by some are comparable to those offered by others, but each offers a unique set of tools for ensuring their presence in search results
Application performance monitoring, profiling, and tracing are just a few of the many choices available. There are many ways to approach a subject, and each instrument provides you with a new perspective.
To administer and monitor the Java Virtual Machine, you may use the Java Management Extensions (JMX) technology that is embedded into the Java Virtual Machine itself. Out-of-the-box management tools for Java VM are often referred to as built-in management utilities.
Why do we need JMX Monitoring tools?
There are several reasons for employing JMX monitoring tools.
- As previously said, JMX monitoring software’s boundaryless approach is its most appealing feature. Tracking your application in real-time requires a significant investment in the tool.
- The JMX monitoring tool is easy to use and cuts down on the time and money needed to construct any management solution for tracking applications.
- Monitoring Java systems, applications, and networks using JMX technology is a popular and appropriate approach.
- JMX monitoring solutions allow you to remotely control and monitor your Java Virtual Machine.
- Dynamic management may be achieved via the use of JMX monitoring technologies. In the management infrastructure, you may create new services and dynamically load, update, and upload them as needed.
- The JMX monitoring technology is compatible with any Java-based applications.
- The vast majority of Java technology-ready devices are compatible with the JMX technology used by JMX agents. Thus, the Java application’s usability improves yet its visual appearance isn’t impacted at all. [*] One or more managed beans (MBeans) must be registered in a Java object server for the Java application’s server-side functions to be accessible.
- With JMX technology, current management systems and new technologies may easily be integrated. Furthermore, as the JMX APIs are open-source interfaces, any management provider may implement the same. The JMX technologies may also employ services and standards like Service Location Protocol (SLP) and Jini Network technology for discovery and search.
- Applications for JMX Monitoring may be created using a NetBeans IDE plug-in. Using the NetBeans IDE and the JMX module available from the NetBeans update center, you may construct JMX apps. Making JMX applications cheaper is made possible by this technique.
The Best JMX Monitoring Tools
1. ManageEngine Applications Manager (FREE TRIAL)
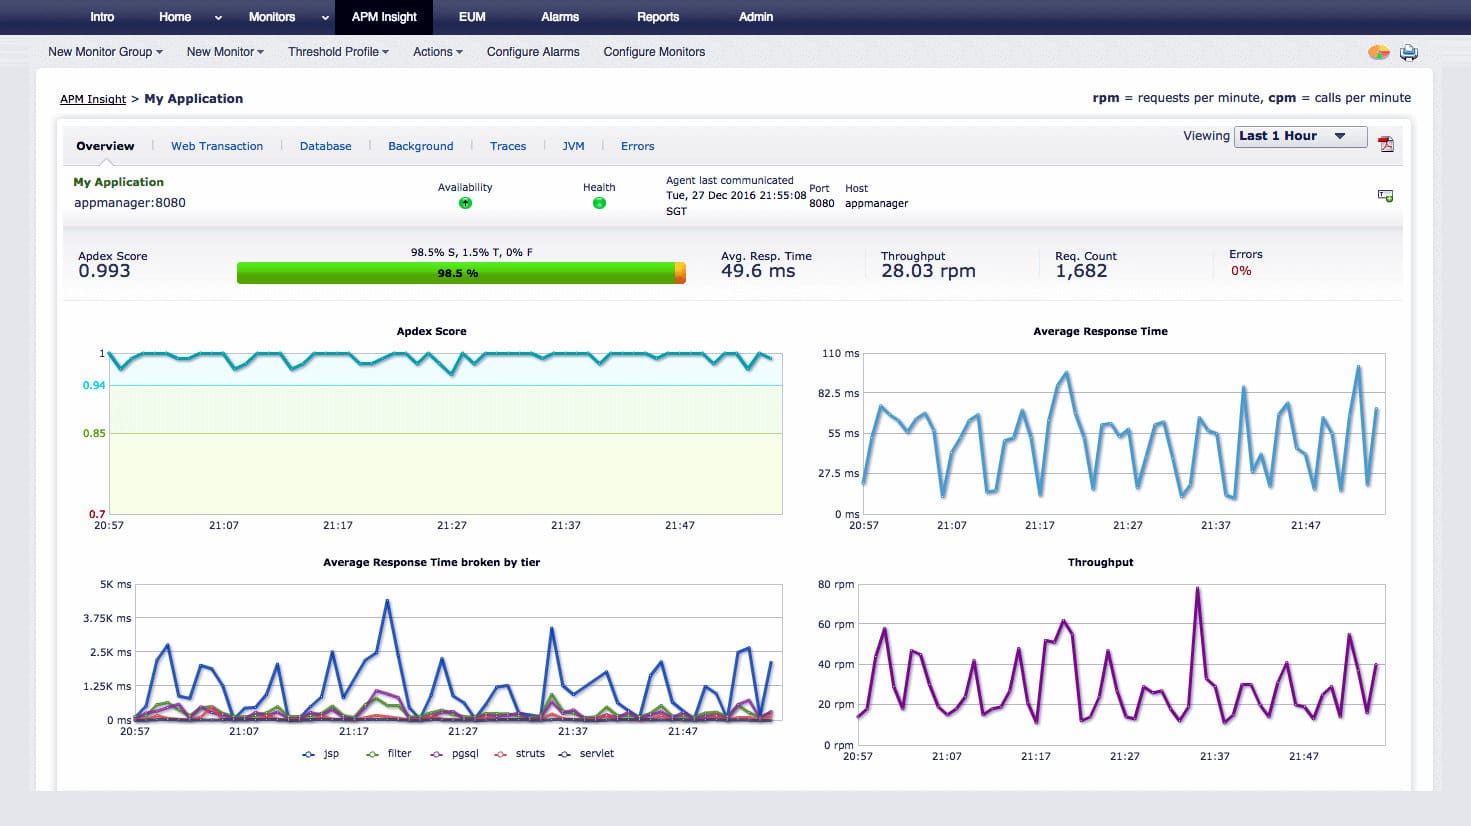
It is possible to monitor Java/J2EE functions that disclose management data through JMX using ManageEngine Applications Manager. JVM resources are used by transactions, threads, and connection pools. Additionally, a Java thread dump analyzer may be used to handle and examine thread dumps. With a familiar and standardized user interface, Applications Manager is a full monitoring tool.
Key features:
- Gain unparalleled insight into your company’s apps.
- Web transactions and performance data in J2EE may be seen in real-time.
- Find and fix the problems that are causing your performance to degrade.
- User happiness may be assessed using Apdex scores.
- Java/J2EE, EJB and SQL statements may all be monitored for metrics.
- Slow traces must be identified.
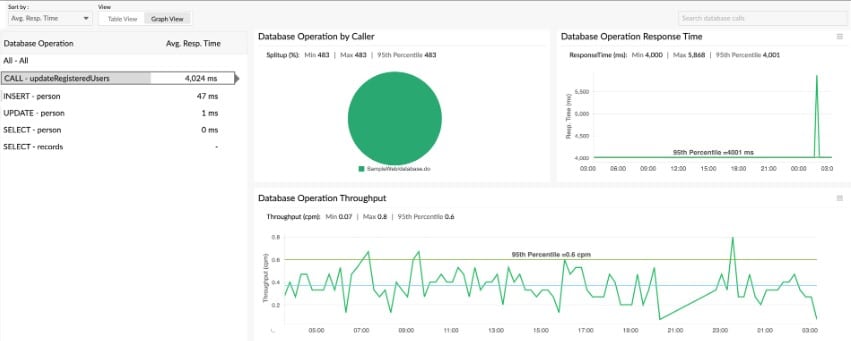
- SQL queries that were run during a transaction may be discovered using this method.
It might be tough to keep track of JMX and customized MBeans. Still, the Application Manager’s JMX metrics monitoring solution allows you to query and evaluate any managed beans (MBeans) from your application. A real-time view of metrics like memory management, categorization loading, active threads, logging or platform settings may be obtained as a consequence.
Custom scripts and JMX MBean activities are used to aid directors in remedial actions when constraints are broken. On top of that, it provides alerts that respond to specific MBean notifications.
EDITOR'S CHOICE
ManageEngine Applications Manager is our top pick for JMX monitoring because it gives IT teams direct control over how Java application performance is observed and managed. Since JMX (Java Management Extensions) sits at the core of how Java services expose operational data, the platform focuses on collecting and presenting those metrics in a usable form. Administrators can follow key indicators such as memory consumption, garbage collection behavior, thread activity, and CPU usage across multiple applications without splitting visibility between tools. Rather than requiring detailed configuration, the system automatically locates JMX-enabled applications and brings them into the monitoring scope, which reduces setup effort and avoids gaps in coverage. Once active, the platform surfaces performance data through dashboards that can be adjusted to show response times, transaction activity, and error rates in context. This makes it easier to isolate bottlenecks, investigate abnormal behavior, and adjust resource usage where needed. The monitoring scope is not limited to Java workloads. By integrating with other IT management systems, the platform extends visibility across wider infrastructure, covering both Java and non-Java components in the same environment. A built-in alerting system tracks defined thresholds and issues notifications when those limits are crossed, allowing administrators to react before performance degradation spreads.
Download: Download a 30-day FREE Trial
Official Site: https://www.manageengine.com/products/applications_manager/download.html
OS: Windows Server, Linux, AWS, and Azure
2. Site24x7 (FREE TRIAL)
Through its JMX integration, Site24x7 gives IT teams a way to observe how Java applications and servers behave in real time. It collects operational data directly from JMX-enabled components, covering metrics such as memory usage, garbage collection activity, CPU utilization, and thread counts, so performance can be assessed as conditions change.
Instead of relying on manual setup, JMX-enabled applications are brought into scope automatically, which reduces configuration effort and avoids gaps in monitoring coverage. Once those components are detected, administrators can examine their performance through dashboards that consolidate JMX data into a single view, making it easier to interpret trends and spot irregular behavior.
Alerts are tied to defined thresholds, so any deviation in performance triggers immediate notification. This allows IT teams to respond early to emerging issues before they begin to affect application stability or user experience.
Key Features:
- Live tracking of JMX metrics
- Support for user-defined JMX queries
- Built-in collection of standard JMX metrics
- Alerting based on configurable performance thresholds
Start with a 30-day free trial.
3. Jolokia
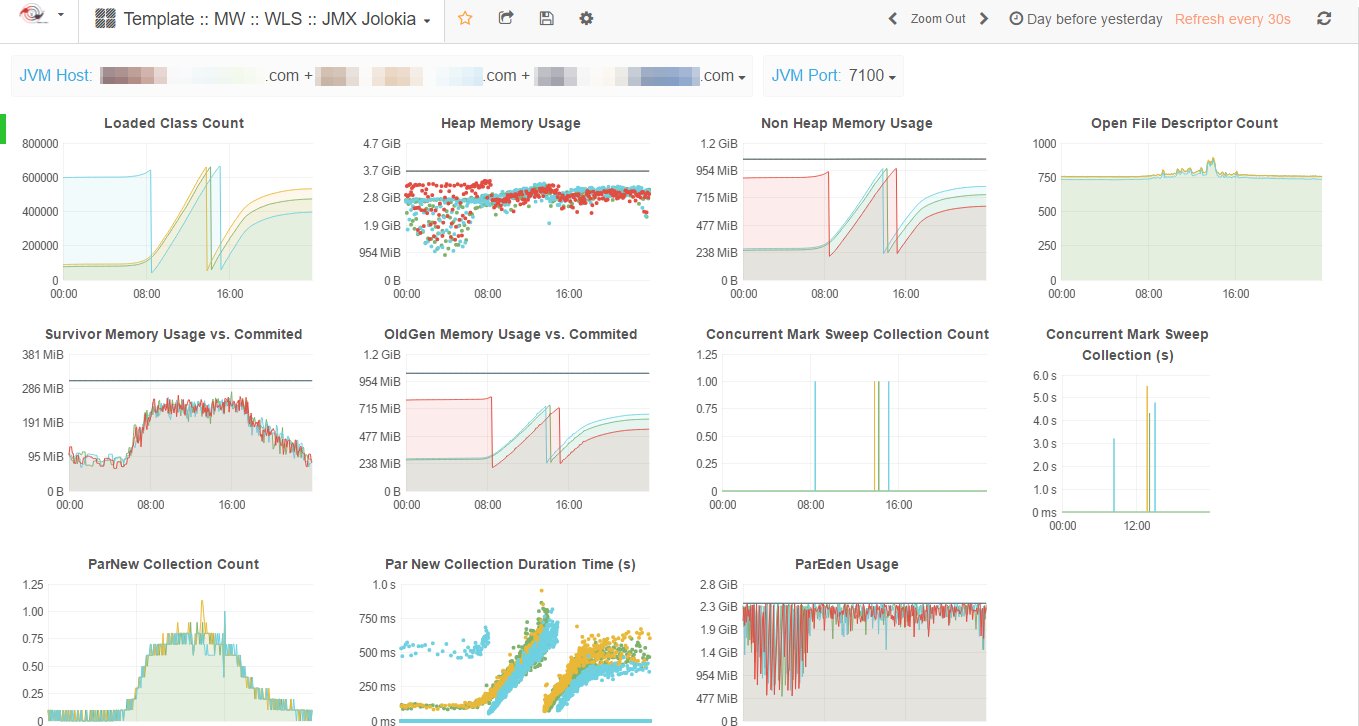
Replacement for JSR 160 connections and a link bridge to the HTTP protocol, Jolokia is an alternative. Server-side JSON-over-HTTP remote Java monitoring extension Because of its agent-based design, Jolokia is compatible with a wide range of operating systems. Additionally, Jolokia’s remote JMX operations are supplemented with outstanding features such as bulk requests and well-polished security.
Key features:
- API endpoints may be accessed with this app.
- It’s cross-platform compatible.
- Allows for many requests at once.
- Small-scale security measures.
- JMX attribute support is included.
In addition, the tool is simple, quick, multilingual, and has a wide range of other unusual capabilities. The JSR-160 connection enables Jolokia to communicate directly with Jconsole and any other JSR-160-compliant application. In addition, it lets you interface directly with a Kubernetes cluster.
4. Jmxterm

Jmxterm is a CLI-based JMX monitoring tool. An interactive JMX client is a command-line created in Java that is freely available to the public.
Features
- Jmxterm is a command-line replacement for jconsole.
- However, during runtime, it is dependent on the jconsole library.
Using Jmxterm, you may access MBeans from the command line without the need for a graphical interface.
5. Visualvm

Visualvm is a lightweight characterization tool that is also a visual program that incorporates the Commandline JDK application into its features. In terms of functionality, the tool is intended for both in-process and post-processing work.
Key features:
- On request, Visualvm enables JFR dumps for Java 17 lock contention profiling.
- It’s also compatible and easy to use.
6. Jconsole

An alternative JMX monitoring tool that meets the criteria is Jconsole. Using JVM’s comprehensive support, the tool collects statistics on how much resources and performance are used by Java programs.
Key features:
- It is possible to monitor both on-premises and off-premises apps using Jconsole.
- Local monitoring is useful for generating prototypes, but not for use in production settings.
7. JDK Mission Control

JDK Mission Control set of tools, formerly known as JRockit Mission Control, allows you to track down and fix any memory leaks in a Java program without the need for conventional performance monitoring systems.
Key features:
- Latency Analysis Tools (LAT) are included in the JDK Mission Control tool, which helps to speed up and monitor the application.
- Additionally, it can react in microseconds.
8. Zabbix
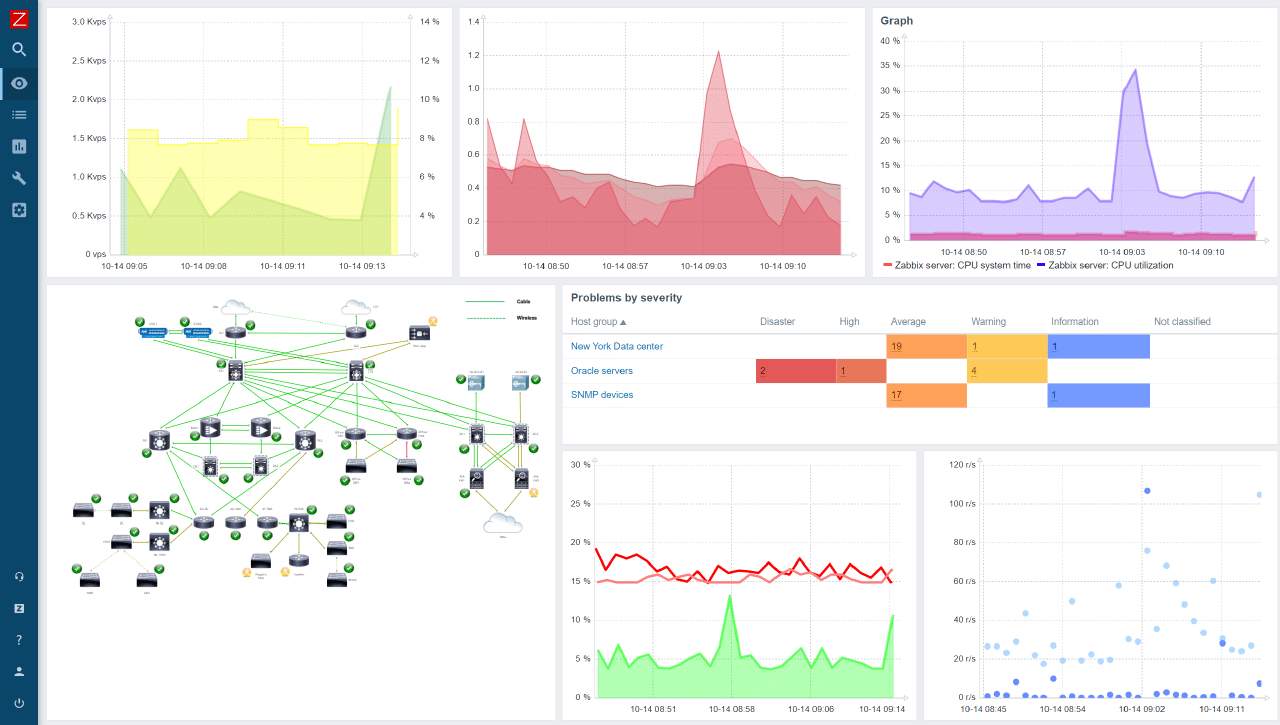
Zabbix is a JMX-enabled Java gateway that provides access to JMX data. It is not a Zabbix server process that is bollard. As part of the Zabbix JavaPollers function, the Zabbix server opens a connection to Zabbix JavaGateway and collects performance statistics.
Key features:
- CPU Tracking
- Network Monitoring
- IP Address Tracking
- An easy-to-use and scalable deployment process
- Auto-discovery is supported by this app.
All that is required to configure Zabbix Java Monitoring Tools is for the Zabbix server to connect with Zabbix JavaGateway and for Tomcat to start remote monitoring of Java Virtual Machine.
9. Hawt.io
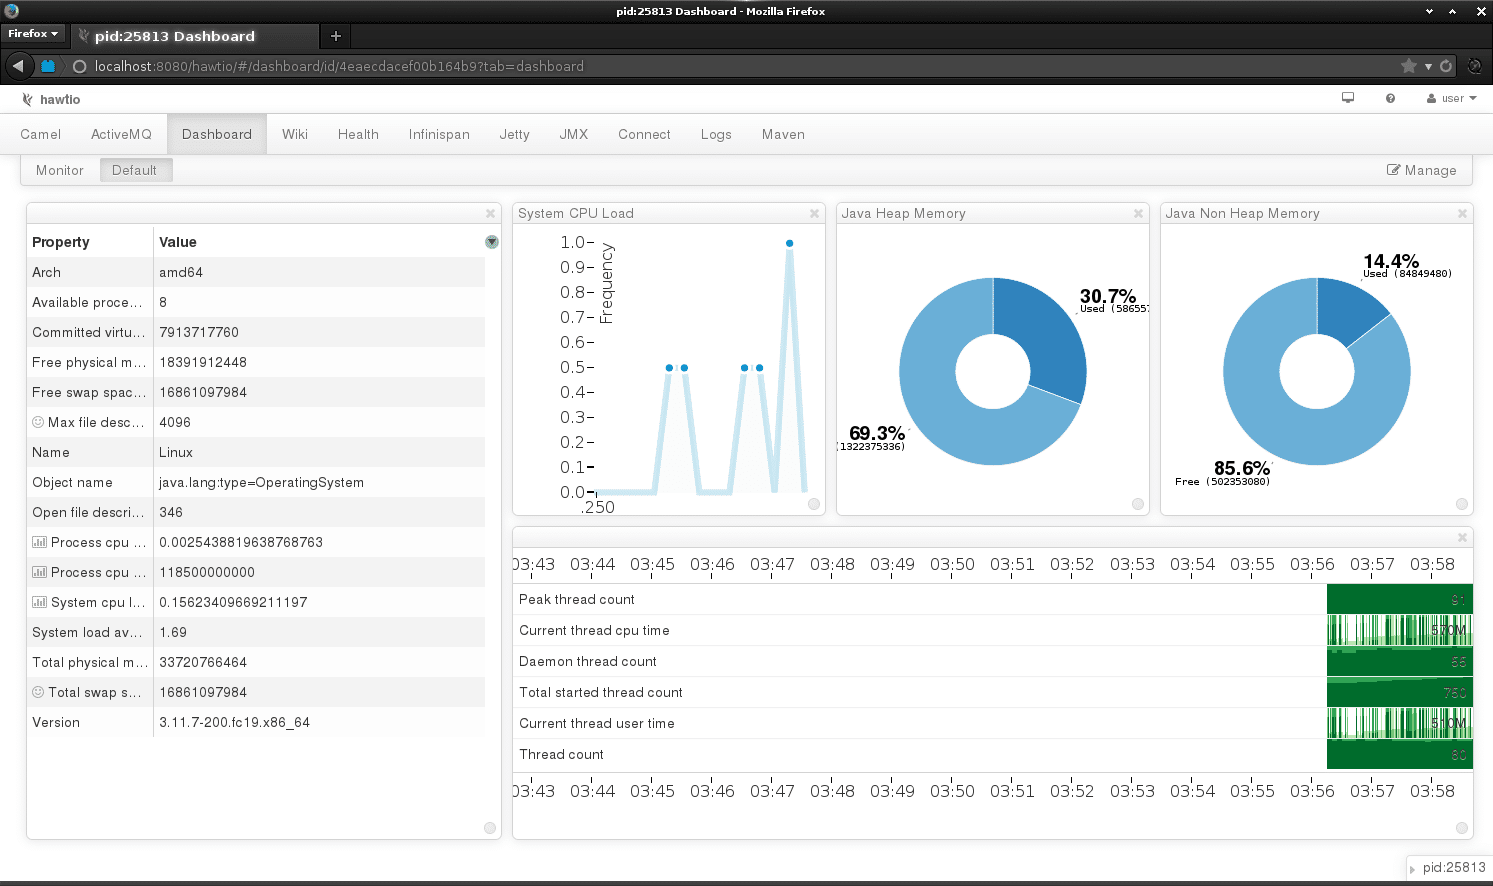
This JMX Monitoring Tool is a scalable online dashboard that controls Java applications and is very accurate. Hawt.io is compatible with a wide range of applications, including those built on top of WebSphere, Tomcat, WebLogic, Liberty, and many more. It is built on top of Jolokia, therefore naturally, the API endpoints of Jolokia are supported.
Key features:
- Endpoints for Jolokia API are available.
- Apache ActiveMQ, Apache Camel and other built-in plugins are available.
- OpenShift and Kubernetes are supported.
- Bootstrap and PatternFly UIs are supported.
If you want both a user interface and API endpoints in one JAR file, this is the best option.
10. Nagios

Java Management Extensions may be monitored using Nagios’ extensive monitoring (JMX). Nagios is a useful tool for increasing the availability of servers, services, and applications. Additionally, the JMX monitoring device aids in the discovery of network outages and protocol failures, and it also helps in the detection of unsuccessful procedure offers and batch processes. Many capabilities and many advantages are provided by the Nagios XI and Nagios Core systems when used with JMX monitoring.
Key features:
- Helps to boost the availability of servers and applications
- Detection of network disruptions in a short period.
- Reveals protocol flaws.
- Finds out what’s running in the background.
Most people use Nagios XI as their infrastructure monitoring instrument of choice. Nagios XI is relied upon by millions of consumers and a wide range of businesses, from Fortune 500 organizations to small businesses. Your customers and group members will appreciate the ease of use and customization provided by the program’s intuitive graphical user interface (GUI).
Nagios Core is open to third-party and community-developed add-ons and API connectors. About SLAs, for example, the device has accessible statistics to ensure that they are satisfied, and historical assessments give data that is critical. Additionally, you have the option of configuring accessibility for multiple users as well as user-specific views to ensure that customers get comprehensive information.
Conclusion
The Java Management Extensions (JMX) package contains a number of tools that may be used to manage and monitor a variety of applications and service-oriented networks. Extracting JMX metrics may be a difficult chore for developers and administrators, but with the help of the JMX monitoring tools described above, things will be a whole lot easier.
Java Management Extensions are an excellent investment if you wish to manage and monitor Java applications for your company (JMX). These also aid in the tracking of applications, the provision of timely notifications, and the resolution of concerns as they arise.
A few prominent JMX monitoring solutions are ManageEngine Applications Manager, Jolokia, Zabbix, Hawt.io, eG Enterprise, and Nagios, which track shared resources and determine the underlying cause of issues. JMX gathers management data in Java classes and manages and monitors each individual application, as well as the entire system. It also aids in the development of code that optimizes the use of network resources while being simple to administer.
