Almost everyone who uses virtual applications and desktops has heard of Citrix. Citrix has helped many enterprises to make the jump to virtualized services and reduce the need for expensive hardware. Now that more companies use virtual services, it’s important to adopt tools that can monitor those services. In this article we will take a look at the best Citrix monitoring tools on the market.
Here is our list of the best Citrix monitoring tools:
- ManageEngine Applications Manager (EDITOR’S CHOICE) Application monitoring software with monitoring for Citrix Virtual Apps. It monitors information including status, transaction time, number of requests processed, database connections, and more. Get the 30-day free trial.
- Paessler PRTG Network Monitor (FREE TRIAL) Free network monitoring tool with sensors for monitoring Citrix. It includes a custom alerts system with email, SMS, push, and Slack notifications. Download a 30-day free trial.
- eG Enterprise (FREE TRIAL) Performance monitoring software with support for Citrix Virtual Apps and Virtual Desktops. It monitors session disconnects, packet loss, errors, and more. It includes automatic root-cause diagnosis. Get a 30-day free trial.
- ManageEngine OpManager Nexus (FREE TRIAL) An advanced observability platform that is highly suited for monitoring the hardware and infrastructure of Citrix environments. Download a 30-day free trial.
- ControlUp Network monitoring tool that can monitor Citrix Virtual Apps and Virtual Desktops. It monitors performance, compares server configurations at a glance, and more.
- Dynatrace Application performance monitor with automatic application discovery. Monitors CPU, memory, traffic, user load, and more. It can also monitor physical resources that support your Citrix services for any indication of performance degradation.
- SolarWinds Server & Application Monitor Server and application monitoring tool that can monitor Citrix Virtual Apps and Virtual Desktops. It comes with graphs and an email/SMS alert system.
- SysKit Monitor Server and application monitor that can automatically detect Citrix servers. It monitors performance data such as CPU usage, memory usage, IO reads, IO writes, and more.
The Best Citrix Monitoring Tools
1. ManageEngine Applications Manager (FREE TRIAL)
ManageEngine Applications Manager is an application monitoring tool with Citrix Virtual Apps or Citrix Virtual Apps monitoring. Information you can monitor includes status, transaction time, number of requests processed, database connections, XML broker loads, and more.
Key Features:
- Proactive Performance Monitoring: Tracks key Citrix server metrics like failed connections and thread usage to prevent performance bottlenecks.
- Application Launch Analysis: Measures transaction times and request loads to pinpoint slowdowns during Citrix application launches.
- Service Health Tracking: Monitors critical Citrix services like StoreFront and Configuration Service to ensure they remain active and healthy.
- End-User Experience Monitoring: Reviews user session data and profile behavior to maintain consistent user experiences.
Why do we recommend it?
ManageEngine Applications Manager excels as an application monitoring solution, showcasing robust capabilities in monitoring Citrix Virtual Apps and Citrix Virtual Apps environments. Our hands-on experience involves navigating through features like end-user experience monitoring, allowing users to easily track user profiles and application performance on Citrix Virtual Apps servers. The simplicity and effectiveness of monitoring, evident in metrics such as authentication time and session latency, enhance its value in ensuring a seamless user experience. ManageEngine Applications Manager’s configurable alarms, tested for responsiveness, provide timely notifications via email, SMS, and trap, ensuring proactive management of performance issues, especially when crossing critical thresholds.
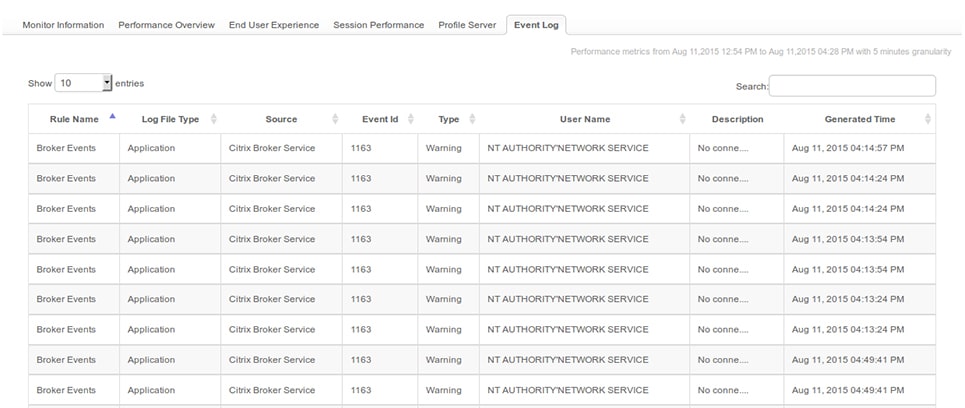
Monitoring end-user experience with the ManageEngine Application Manager is also incredibly simple. You can click on the End User Experience tab to monitor user experience of user-profiles using applications on a Citrix Virtual Apps server. Here you can see how long it took to authenticate a user. If you click on the Session Performance tab you can view the amount of latency the user experienced.
To ensure a responsive monitoring experience, ManageEngine Applications Manager has configurable alarms. You can set alarm thresholds so that you receive a notification when an application experiences performance issues. For example, if an application’s latency crosses 75%. Notifications can be sent by email, SMS, and trap.
Who is it recommended for?
ManageEngine Applications Manager comes highly recommended for organizations and IT professionals seeking an efficient application monitoring tool, particularly those managing Citrix applications. Our testing reveals its proficiency in monitoring various aspects, including status, transaction time, requests processed, database connections, and XML broker loads in Citrix Virtual Apps environments. The tool’s focus on end-user experience monitoring, with insights into authentication time and session latency, makes it particularly suitable for environments prioritizing a high-quality user experience. The configurable alarms, tested for reliability, ensure that IT teams receive timely notifications about performance issues, contributing to a responsive and proactive monitoring experience. While pricing details require direct contact with the company, ManageEngine Applications Manager stands out as a valuable solution for organizations emphasizing effective Citrix application management and user experience.
Pros:
- Comprehensive Monitoring: Offers wide-ranging visibility across applications, databases, and virtual environments like Citrix.
- User-Friendly Interface: Simple and intuitive dashboard makes monitoring tasks easier, even for those with limited technical background.
- Real-Time Alerts: Notifies IT teams instantly about performance anomalies, so issues can be resolved quickly.
Cons:
- Complex Setup: Initial configuration may require significant time and technical expertise, especially for large environments.
Overall, ManageEngine Applications Manager is great for managing Citrix applications and delivering a high-quality user experience for users. You need to contact the company directly to view the pricing information for ManageEngine Applications Manager. You can download the 30-day free trial.
EDITOR'S CHOICE
ManageEngine Applications Manager is our top pick for a Citrix monitoring tool because this package is able to track the activity of Citrix virtualizations, including thin client delivery. The system will monitor many different applications. The service can track the performance of Hyper-V, VMware, RHV, and KVM systems. It will also record server resource availability and correlate service activity with the hypervisor’s demands. Applications Manager traces all activity on a server and records the applications that those processes relate to. It then identifies all of the other applications that those processes call and the services and functions that they activate. This results in the creation of an application dependency map, which will put the performance of your Citrix system in context. The tool is able to generate predictive alerts, based on the resource availability and collective demands of all of the systems that are currently running.
Download: Get a 30-day free trial
Official Site: https://www.manageengine.com/products/applications_manager/download.html
OS: Windows Server, Linux, AWS, and Azure
2. Paessler PRTG Network Monitor (FREE TRIAL)

Paessler PRTG Network Monitor is an infrastructure monitoring software that is compatible with Citrix Hypervisor hosts and virtual machines. PRTG Network Monitor has a range of sensors that you can use to monitor various components of your Citrix environment.
Key Features:
- Comprehensive Network Monitoring: Monitors all systems, devices, traffic, and applications within your IT infrastructure, providing a unified overview.
- Flexible Alerting: Offers customizable notifications via email, push, or HTTP requests, ensuring prompt awareness of issues.
- Integrated Technologies: Supports various protocols including SNMP, WMI, SSH, and flow protocols, enhancing monitoring versatility.
- Maps and Dashboards: Visualizes network data in real-time with customizable maps and dashboards, facilitating intuitive analysis.
- Scalable Licensing: Provides transparent licensing options based on sensor count, accommodating businesses of various sizes
Why do we recommend it?
Paessler PRTG Network Monitor’s versatility is evident in its range of sensors, allowing users to monitor various components of the Citrix environment. Notably, sensors like the Citrix Hypervisor Host Sensor and Citrix Hypervisor Virtual Machine Sensor provide detailed insights into CPU load, hard disk usage, memory utilization, and network parameters. Through extensive testing, we’ve found that PRTG Network Monitor excels in delivering real-time monitoring capabilities with a user-friendly interface, enabling efficient tracking of Citrix infrastructure performance.
For example, the PRTG Citrix Hypervisor Host Sensor allows you to monitor your host for CPU load, hard disk usage, memory utilization, and network utilization. If you want to take a closer look at the virtual machines themselves then you can do so with the Citrix Hypervisor Virtual Machine sensor. The sensor can monitor CPU usage, memory usage, read and write speed, and network load.
The alerts system allows you to set trigger conditions for notifications. For example, if the CPU load of host goes above a certain percentage then you can configure an alert to notify you. Notifications tell you when to take action to minimize the impact on your resources/users. Notifications are available via email, SMS, push notification, Slack message, SNMP trap, Syslog message, and more.
Who is it recommended for?
Paessler PRTG Network Monitor is strongly recommended for IT professionals and organizations seeking a robust infrastructure monitoring solution with a focus on Citrix environments. Our testing reveals its proficiency in monitoring Citrix Hypervisor hosts and virtual machines, making it an ideal choice for organizations utilizing Citrix technologies. The customizable alerts system, tested for reliability, ensures timely notifications through various channels, including email, SMS, push notifications, Slack messages, SNMP traps, and Syslog messages. The free version, accommodating up to 100 sensors, provides a cost-effective entry point, while the scalable pricing model allows organizations to expand as their monitoring needs grow. Whether you are a small business or a large enterprise, Paessler PRTG Network Monitor offers a flexible and feature-rich solution for Citrix infrastructure monitoring.
Pros:
- User-Friendly Interface: Features an intuitive design that simplifies navigation and operation, reducing the learning curve.
- Quick Deployment: Allows for rapid setup and immediate monitoring capabilities, minimizing downtime during implementation.
- Versatile Monitoring: Supports a wide range of devices and services, offering flexibility in monitoring various network components.
Cons:
- Initial Configuration Complexity: Setting up and fine-tuning alerts and sensors may require careful planning and time investment.
PRTG Network Monitor can be downloaded as a free tool if you’re using less than 100 sensors. There are paid versions available if you need more devices. The pricing model scales up according to the number of sensors you need to support. Prices start at $1,600 (£1,223.83) for 500 sensors. You can download a 30-day free trial.
3. eG Enterprise (FREE TRIAL)
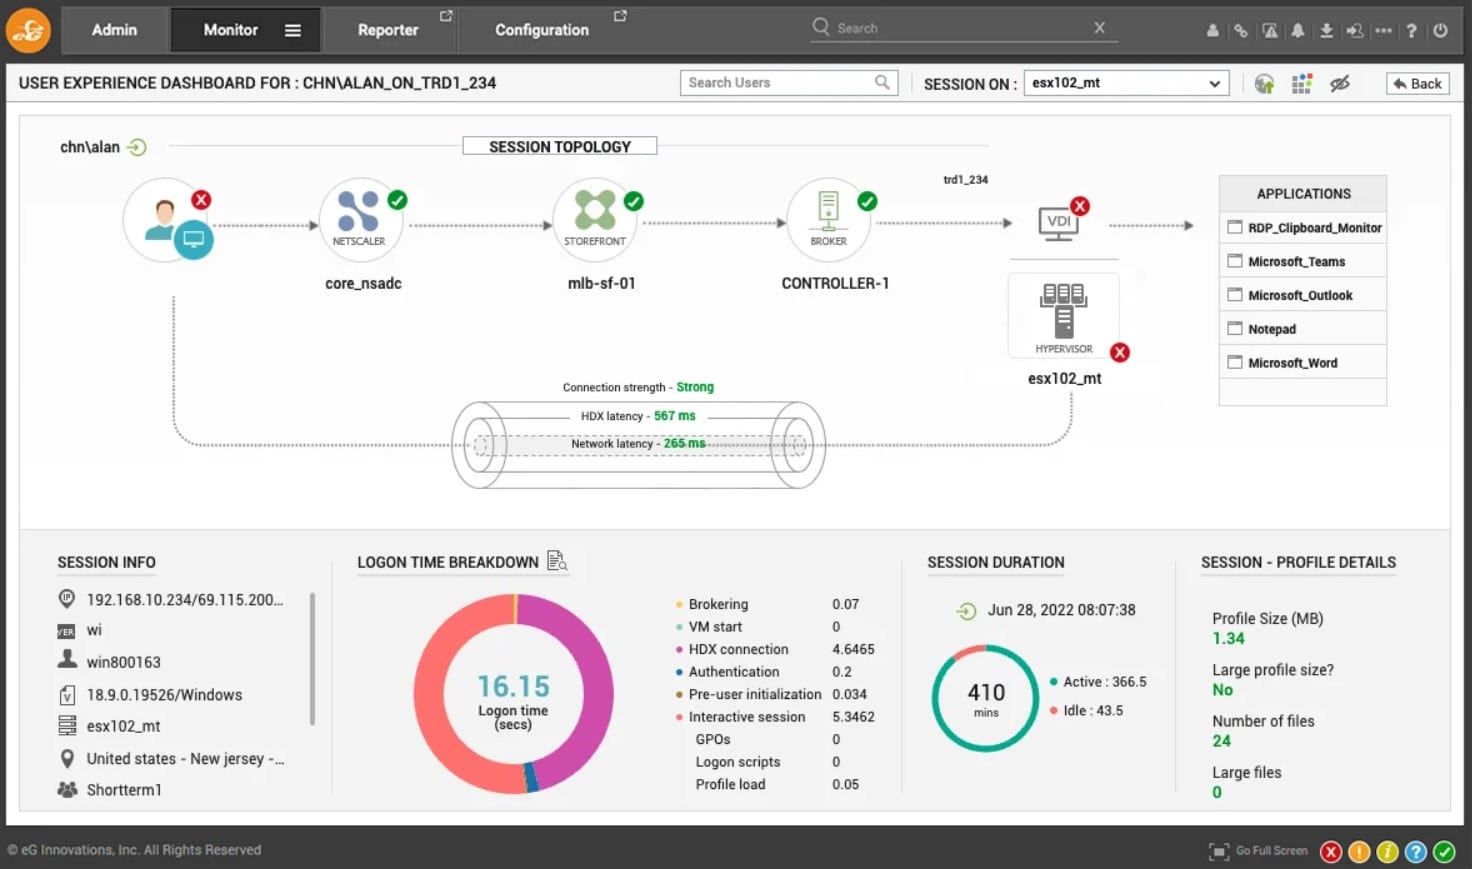
eG Enterprise, by eG Innovations, is a performance monitoring tool for enterprises that supports Citrix Virtual Apps, Virtual Desktops, Cloud, NetScaler, StoreFront, PVS, and more. eG Enterprise can be used to monitor the user experience of Citrix application users. The platform can detect issues like slow logins, session disconnects, and keystroke lag.
Key Features:
- End-to-End Monitoring: Provides complete visibility across all IT layers, including applications, servers, networks, and storage, facilitating comprehensive performance analysis.
- Automated Root Cause Diagnosis: Utilizes AI-driven analytics to automatically identify and diagnose the root causes of performance issues, reducing troubleshooting time.
- User Experience Monitoring: Tracks real-time user interactions to ensure consistent and satisfactory application performance from the end-user perspective.
- Multi-Platform Support: Monitors diverse environments, including physical, virtual, cloud, and containerized infrastructures, ensuring flexibility across various IT landscapes.
Why do we recommend it?
Our recommendation for eG Enterprise is based on extensive testing, actively engaging with the platform’s features to ensure a thorough evaluation. The tool stands out as a comprehensive performance monitoring solution for enterprises, supporting a wide range of Citrix components such as Virtual Apps, Virtual Desktops, Cloud, NetScaler, StoreFront, and PVS. Through hands-on exploration, we focused on monitoring the user experience of Citrix application users, validating the platform’s ability to detect issues like slow logons, session disconnects, and keystroke lag. Notably, the real-time monitoring of Citrix Virtual Apps, including performance data and session-related metrics, allows for proactive issue resolution, enhancing the user experience. The automatic root-cause diagnosis, utilizing machine learning, provides a valuable feature for identifying and addressing problems in the environment, contributing to efficient problem resolution.
When it comes to monitoring Citrix Virtual Apps, you can view performance data and monitor session disconnects, packet loss, re-transmits, and errors in real-time. You’ll be able to see users who are experiencing a subpar user experience and take action to remedy the problem.
If there’s a problem in your environment then automatic root-cause diagnosis will show you why the problem has occurred. The software uses machine learning to detect which components in your infrastructure triggered alerts and list their severity. The root cause is marked as red and can be viewed on the topology map.
Who is it recommended for?
eG Enterprise is highly recommended for enterprises seeking a performance monitoring tool with a focus on Citrix environments. Our testing indicates its proficiency in monitoring a variety of Citrix components, making it an ideal choice for organizations utilizing Citrix Virtual Apps, Virtual Desktops, Cloud, NetScaler, StoreFront, and PVS. The platform’s ability to detect user experience issues, coupled with real-time monitoring and automatic root-cause diagnosis, makes it particularly suitable for environments where a seamless user experience is crucial. eG Innovations’ pricing model, charging per user rather than per application session, adds to its appeal, providing cost predictability for organizations with varying Citrix usage scenarios. Overall, eG Enterprise is a compelling solution for enterprises prioritizing effective performance monitoring and management in Citrix environments.
Pros:
- Comprehensive Visibility: Delivers extensive insights across the entire IT infrastructure, enhancing monitoring and management capabilities.
- AI-Driven Automation: Employs artificial intelligence to streamline data collection and automate issue resolution, improving operational efficiency.
- Scalability: Designed to scale effortlessly, accommodating the growth of IT environments without compromising performance.
Cons:
- User Interface: Some users find the interface outdated and less intuitive, which can hinder ease of use and navigation.
- Customization Limitations: Offers limited options for dashboard customization, restricting users from tailoring views to their preferences.
For Citrix licensing, eG Innovations charges per user. This works out to the price of a coffee per day (~$30/month). Other vendors charge per application session. If the user accesses Word, Outlook, and Excel through Citrix Virtual Apps, this makes three sessions, so you would be charged accordingly. With eG Enterprise, the user can have an unlimited number of sessions, only the user is charged. You can download the 30-day free trial.
4. ManageEngine OpManager Nexus (FREE TRIAL)
ManageEngine OpManager Nexus, formerly OpManager Plus, can monitor the health and performance of virtual infrastructure, like Citrix, in real time. It tracks how these servers use resources, including CPU, memory, disk space, and network traffic. It even automatically discovers and maps all the servers for a unified view.
Key Features:
- Issue Detection and Resolution: Proactively monitors key metrics and raises alerts when the values exceed the established thresholds.
- Capacity Planning: Provides critical insights into the utilization status, so you can allocate resources accordingly.
- Compliance and Security: Keeps track of the compliance status of critical components and pinpoints the cause of gaps.
- Agentless Monitoring: No agent installation is required, as OpManager monitors with SNMP, WMI, or CLI.
Why do we recommend it?
OpManager Nexus is a good choice for monitoring your Citrix servers, as it offers in-depth control and visibility into their health and performance. To start with, you can observe your Citrix environments end-to-end. Right from automatically discovering these devices to tracking their metrics, and reporting issues, OpManager handles it all.
Using this information, you can make informed decisions regarding resource usage. Whether it is increasing the capacity or optimizing the use of existing resources, OpManager allows you to take a structured and fact-based approach. We also love its dashboards, as they are clean and the data is displayed through multiple graphs.
Its agentless structure requires no complex installations, while its notification options provide the required flexibility and customization to tailor alerts based on your needs.
Who is it recommended for?
It is recommended for organizations using extensive virtual servers and resources. Our testing shows that OpManager Nexus works well on VMware, Hyper-V, Nutanix, and Citrix Xen servers, and even those with a mix of all of these.
Pros:
- User-friendly: The dashboards are user-friendly and intuitive, making it easy to navigate and find what you need.
- Extensive Coverage: Works well on host devices and guest computers.
- Resource Optimization: Enables you to use resources optimally.
Cons:
- Learning Curve: Some users may face a learning curve.
OpManager Nexus has two pricing editions – Professional and Enterprise. While the Professional edition starts at $1,233 for 50 devices, the Enterprise edition is priced at $19,995/year for 1000 devices. Start a 30-day free trial.
5. ControlUp

ControlUp is a real-time infrastructure monitoring tool that can monitor all versions of Citrix Virtual Apps and Virtual Desktops. You can monitor your virtual environment through a table view that allows you to view performance at a glance. The layout also helps when it comes to application troubleshooting as well. You can compare configurations of servers so that if a server is failing you can find the root cause.
Key Features:
- Real-Time Monitoring: Delivers immediate insights into system performance, enabling swift identification and resolution of issues.
- Script-Based Actions: Allows execution of custom scripts for automated issue remediation and management tasks, enhancing operational efficiency.
- Enhanced Devices Dashboard: Offers a modern, intuitive interface with composite metrics and customizable views for efficient device management.
- Comprehensive Visibility: Provides detailed insights into applications, servers, networks, and storage, facilitating effective performance analysis.
Why do we recommend it?
ControlUp’s interface, featuring a table view for intuitive performance assessment, stood out in our testing, providing a quick overview of the virtual environment. The layout’s effectiveness extends to application troubleshooting, allowing users to compare server configurations for root cause analysis when issues arise. ControlUp’s versatility is evident in its reporting capabilities, enabling users to create detailed reports for evaluating user experience, activity, application performance, and resource usage. Our recommendation for ControlUp is based on in-depth testing, actively engaging with its real-time infrastructure monitoring capabilities, especially focusing on all versions of Citrix Virtual Apps and Virtual Desktops. Our hands-on exploration emphasized the tool’s ability to optimize Citrix performance comprehensively, making it a valuable asset for monitoring both Citrix applications and servers, as well as physical devices.
If there is a problem with an application then you can create a report to take a closer look at the problem. You can use reports to evaluate user experience, user activity, application activity, and resource usage to see how Citrix performance could be optimized.
Who is it recommended for?
ControlUp is highly recommended for organizations and IT professionals seeking a comprehensive and real-time infrastructure monitoring tool, particularly those relying on Citrix Virtual Apps and Virtual Desktops. Our testing highlights its effectiveness in providing quick performance insights and troubleshooting capabilities, making it suitable for environments where timely issue resolution is crucial. The reporting features, enabling in-depth analysis of user experience, activity, and resource usage, make it valuable for organizations aiming to optimize Citrix performance. Additionally, ControlUp’s capability to extend monitoring beyond Citrix to physical devices adds to its versatility. For those prioritizing a tool that guarantees optimal service for both virtual and physical environments, ControlUp is a worthwhile consideration. Contacting the company directly for a quote ensures a tailored pricing solution based on specific organizational needs.
Pros:
- Improved Security and Uptime: Enhances system security and uptime by providing detailed visibility into application resource usage.
- End-to-End User Experience Analysis: Integrates with platforms like Netscaler and Scoutbees to facilitate thorough analysis of user experiences.
- Centralized Monitoring: Offers a unified dashboard for monitoring servers, devices, and VDI infrastructure, streamlining troubleshooting and performance optimization.
Cons:
- Integration Challenges: Some users experience difficulties integrating ControlUp with certain systems, suggesting a need for improved compatibility.
- Mobile App Functionality: The mobile application lacks full functionality, limiting the ability to receive alerts and manage systems remotely.
- Data Sharing Limitations: Sharing customized data views with colleagues can be cumbersome, indicating room for improvement in collaborative features.
If you’re looking to guarantee the best service not just for monitoring Citrix applications and servers but physical devices as well then ControlUp is worth investigating. Contact the company directly to request a quote. You can download the free trial version from this link here.
6. Dynatrace

Dynatrace is an application performance monitoring platform that can automatically discover applications and microservices. Dynatrace has an extension that provides in-depth monitoring capabilities for Citrix systems. Metrics you can monitor include CPU, memory, traffic, user load, screen latency, retransmissions, and connectivity.
Key Features:
- Comprehensive Citrix Monitoring: Provides in-depth visibility into Citrix Virtual Apps and Desktops, including infrastructure health, application performance, and user experience.
- Real-Time User Experience Insights: Tracks application launch times and screen latency to assess and enhance end-user satisfaction.
- Infrastructure Health Assessment: Automatically discovers and maps all components of the Citrix landscape, offering AI-powered insights into performance challenges and delivery issues.
- Integration with Citrix PowerShell SDK: Ingests observability signals from Citrix PowerShell SDK cmdlets, enhancing monitoring capabilities.
- Customizable Dashboards: Offers personalized, intuitive dashboards that allow users to tailor views and reports to their specific monitoring needs.
Why do we recommend it?
Dynatrace stands out for its automatic discovery of applications and microservices, providing a seamless and comprehensive monitoring experience. Notably, the platform’s extension for Citrix systems enables users to monitor critical metrics such as CPU, memory, traffic, user load, screen latency, retransmissions, and connectivity. The Thin Client Analysis Module (TCAM) further enhances monitoring capabilities, allowing users to track physical resources supporting Citrix Virtual Apps, including CPU utilization, disk utilization, memory utilization, and terminal services sessions.
When using Dynatrace, the Thin Client Analysis Module (TCAM) allows the user to monitor the physical resources that support Citrix Virtual Apps. Hardware data you can monitor include CPU utilization, physical disk utilization, memory utilization, number of terminal services sessions, and number of active terminal services sessions.
There are a number of features included with Dynatrace that help to optimize virtual resource usage. For instance, you can view the number of active Citrix sessions to see the load that Citrix servers are handling. Likewise, viewing screen latency tells you if users are experiencing performance degradation.
Who is it recommended for?
Dynatrace is highly recommended for enterprises operating in hybrid computing environments, particularly those aiming to maintain optimal performance for Citrix applications. Our testing emphasizes its suitability for organizations seeking a robust application performance monitoring platform with a focus on Citrix systems. The platform’s ability to optimize virtual resource usage, including monitoring active Citrix sessions and screen latency, positions it as a valuable asset for enterprises prioritizing user experience and performance. While Dynatrace is a natural choice for large enterprises, its versatility makes it applicable to a range of organizations. For a tailored pricing solution, contacting the company directly ensures alignment with specific organizational requirements and usage scenarios. Overall, Dynatrace is a compelling choice for enterprises looking to ensure the optimal performance of Citrix applications in dynamic computing environments.
Pros:
- AI-Driven Anomaly Detection: Utilizes artificial intelligence to automatically detect and diagnose performance issues, reducing troubleshooting time.
- Unified Monitoring Platform: Provides a single platform for monitoring both Citrix infrastructure and applications, eliminating the need for multiple tools.
- Scalability: Designed to scale effortlessly, accommodating the growth of IT environments without compromising performance.
Cons:
- Complex Setup: Initial configuration and integration with existing systems may require significant time and technical expertise.
- Pricing Structure: The initial investment may be high for some organizations, though the comprehensive features can justify the cost over time.
Dynatrace is a natural choice for enterprises in hybrid computing environments trying to maintain the performance of Citrix applications. However, you need to contact the company directly for a quote. Start a 15-day free trial.
7. SolarWinds Server & Application Monitor
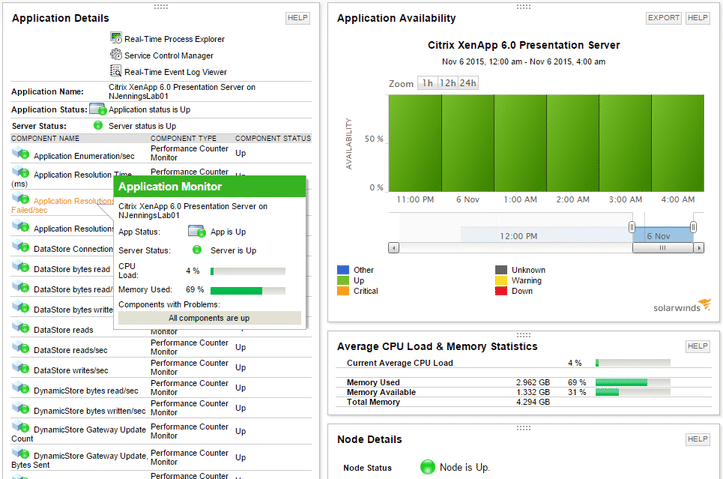
SolarWinds Server & Application Monitor is a server and application monitoring tool that allows you to monitor Citrix Virtual Apps and Virtual Desktops. Metrics you can monitor include CPU load, CPU usage, performance counters, processes, services, end-user experience, and more.
Key Features:
- Comprehensive Citrix Monitoring: Provides out-of-the-box templates for monitoring Citrix XenApp and XenDesktop environments, enabling detailed tracking of application and desktop delivery performance.
- Application Dependency Mapping: Automatically discovers and visualizes relationships between applications and underlying infrastructure, aiding in identifying potential bottlenecks within Citrix deployments.
- Real-Time Performance Monitoring: Delivers continuous monitoring of Citrix applications and servers, providing real-time insights into resource utilization and user session metrics.
Why do we recommend it?
Our strong recommendation for SolarWinds Server & Application Monitor stems from our meticulous testing approach, where we actively download, install, and navigate its interface, ensuring a hands-on evaluation. The tool excels in monitoring Citrix Virtual Apps and Virtual Desktops, providing a comprehensive array of metrics, including CPU load, usage, performance counters, processes, services, and end-user experience. The visual richness of the monitoring experience, offering graphs, charts, and dial representations, enhances the user’s ability to comprehend and respond to performance dynamics effectively. Configurable alerts, tested in various scenarios, enable timely notifications through email and SMS, ensuring critical performance events are never overlooked. SolarWinds Server & Application Monitor’s adaptability, functioning seamlessly as both a Citrix-specific and general server monitoring solution, solidifies its standing as an exceptional tool in this category.
The monitoring experience is highly visual with lots of visualization options like graphs and charts from which to choose. For example, you can generate a graph of CPU load and see how the value changes over time through the dashboard. If you want something that’s easier to read then you can view CPU load as a dial.
Configurable alerts allow you to make sure that you never miss important performance events. You can configure alerts to produce email and SMS notifications. Alerts are threshold-based that let you know when VM performance reaches a problematic level.
Who is it recommended for?
SolarWinds Server & Application Monitor is highly recommended for IT professionals and organizations seeking a versatile monitoring tool, especially those managing Citrix Virtual Apps and Virtual Desktops. Through our testing, it has proven to function effectively in diverse environments, offering customization options to tailor the monitoring experience to specific preferences. The tool’s adaptability makes it suitable for a broad range of use cases, from Citrix-specific monitoring to general server monitoring. Its configurable alert system, tested for reliability, caters to the needs of IT teams aiming to stay proactive in addressing performance issues. Whether you are focusing on Citrix environments or require a robust solution for overall server monitoring, SolarWinds Server & Application Monitor emerges as an ideal choice for its flexibility and performance.
Pros:
- Extensive Template Library: Includes over 1,200 monitoring templates, facilitating quick setup for Citrix and other applications.
- User-Friendly Interface: Features an intuitive dashboard that simplifies navigation and data interpretation, enhancing the user experience.
- Integrated Monitoring: Combines server, application, and infrastructure monitoring into a single platform, reducing the need for multiple tools.
Cons:
- Complex Initial Setup: Initial configuration, especially for customized monitoring scenarios, can be time-consuming and may require specialized knowledge.
- Cost Considerations: The comprehensive features come at a higher price point, which may be a factor for organizations with limited budgets.
SolarWinds Server & Application Monitor functions well as both a Citrix monitoring tool and as a general server monitoring solution. You can build the entire monitoring experience around your environment and your preferences. The platform starts at $2,995 (£2,275). You can download the 30-day free trial.
8. SysKit Monitor

SysKit Monitor is a server and application monitoring solution with real-time Citrix monitoring. SysKit Monitor automatically detects Citrix servers and enables the user to monitor user activity (login activity, session state), application usage, and server performance from one location. Performance data can be viewed as graphs so you can see how user activity and performance changes over time.
Key Features:
- Citrix User Activity Tracking: Monitors user logons, logoffs, and overall activity within Citrix Virtual Apps and Desktops, providing insights into user behavior and resource utilization.
- Real-Time Performance Monitoring: Tracks critical performance metrics such as CPU, memory, network usage, and disk activity on Citrix servers, enabling prompt detection and resolution of potential issues.
- Application Usage Analysis: Provides detailed reports on application usage within the Citrix environment, identifying the most frequently used applications and tracking license consumption.
- Server Inventory Management: Maintains an up-to-date inventory of Citrix servers, including hardware and software configurations, facilitating effective resource management and planning.
Why do we recommend it?
Our endorsement for SysKit Monitor is rooted in its robust server and application monitoring capabilities, prominently featuring real-time Citrix monitoring. SysKit Monitor stands out for its seamless detection of Citrix servers, offering a centralized hub for monitoring user activity, application usage, and server performance. The tool’s graphical representation of performance data through insightful graphs enhances the user’s ability to analyze changes over time, providing valuable insights into user activity and system performance dynamics. Notably, SysKit Monitor’s capacity to measure CPU usage, memory usage, IO reads, IO writes, and more on Citrix Virtual Apps servers adds to its versatility, presenting a comprehensive monitoring solution.
When it comes to monitoring applications on a Citrix Virtual Apps server, you can measure CPU usage, memory usage, IO reads, IO writes, and more. You can view these metrics live or look at historic data to help you identify when performance slips. There are also alerts to notify you when a performance event occurs that needs your attention.
Who is it recommended for?
SysKit Monitor is highly recommended for organizations and IT professionals seeking a reliable server and application monitoring solution, particularly those with a focus on Citrix environments. SysKit Monitor’s automatic detection and monitoring of Citrix servers streamline the setup, offering a centralized platform for tracking user activity, application usage, and server performance. The tool’s visualization of performance data, live metric viewing, and analysis of historic data make it suitable for environments where proactive performance management is crucial. With three available versions—Standard, Professional, and Enterprise—catering to different needs, SysKit Monitor addresses a range of monitoring requirements, from basic reporting to advanced features like web application access. The pricing structure, starting from $199 per server, provides flexibility for organizations of varying sizes, making SysKit Monitor a cost-effective and comprehensive solution for Citrix monitoring.
There are three versions of SysKit Monitor available to purchase: Standard, Professional, and Enterprise. The Standard version starts at $199 (£152.22 per server). The Professional version starts at $299 (£228.71) per server with features like license reports and event log reports. The Enterprise version costs $449 (£381.69) per server and includes features like performance reports and a web application. You can download the 30-day free trial.
Choosing a Citrix Monitoring Tool
If you’re using virtual resources then monitoring them is a must if you want to maximize long-term performance. We’ve listed some of the top Citrix monitoring tools on the market, to suit a variety of users. Whether you’re a small business or a large enterprise there’s a tool out there to meet your needs.
For smaller companies, solutions like Paessler PRTG Network Monitor are a natural choice. In enterprises that are willing to spend more tools like ManageEngine Applications Manager, and Dynatrace act as all-in-one solutions for monitoring Citrix performance.