
If there is one thing that all networks have in common, it is that they need to be managed consistently in order to perform at their best. Only the best Simple Network Management Protocol (SNMP) monitoring tools can help to look out for the signs of performance degradation. The use of SNMP monitoring is easily one of the most effective ways for a network administrator to ensure the stability of the network and its connected devices.
SNMP monitoring is the practice of SNMP polling devices throughout your network and pulling information on the health of all connected devices. An SNMP monitor will be able to tell you whether a system is up, down, or compromised. By having this information at your fingertips, you can take immediate action to solve.
Here is our list of the best SNMP Monitoring tools:
- AdRem NetCrunch EDITOR’S CHOICE A comprehensive IT monitoring solution that supports multiple SNMP protocols and versions to collect and analyze all the data passing through your network. It can also receive and forward SNMP traps. Download a 30-day free trial.
- ManageEngine OpManager (FREE TRIAL) An on-premises monitoring system for networks and servers that relies on SNMP procedures for autodiscovery and automated network monitoring. Available for Windows Server and Linux. Start a 30-day free trial.
- Paessler PRTG Network Monitor (FREE TRIAL) A package of monitoring tools that uses SNMP for its network monitoring system from the moment it sets itself up through autodiscovery. Available for Windows Server or as a SaaS platform. Get the 30-day free trial.
- Site24x7 Network Monitoring (FREE TRIAL) This cloud-based SaaS package provides network discovery and documentation procedures that provide a network inventory and a topology map as well as continuous monitoring thanks to SNMP. Access a 30-day free trial.
- Zabbix A free network, server, and application monitor that offers live activity tracking with SNMP plus capacity forecasting. Runs on Linux, Unix, or macOS.
- Nagios XI A full stack monitor that offers a range of monitoring techniques including SNMP-based device health tracking and can be extended with plug-ins. Runs on Linux or over Docker.
- OpenNMS Free (Horizon) and paid (Meridian) versions of this network monitoring package both use SNMP for device discovery and performance tracking. Runs on Windows Server, Linux, and Docker.
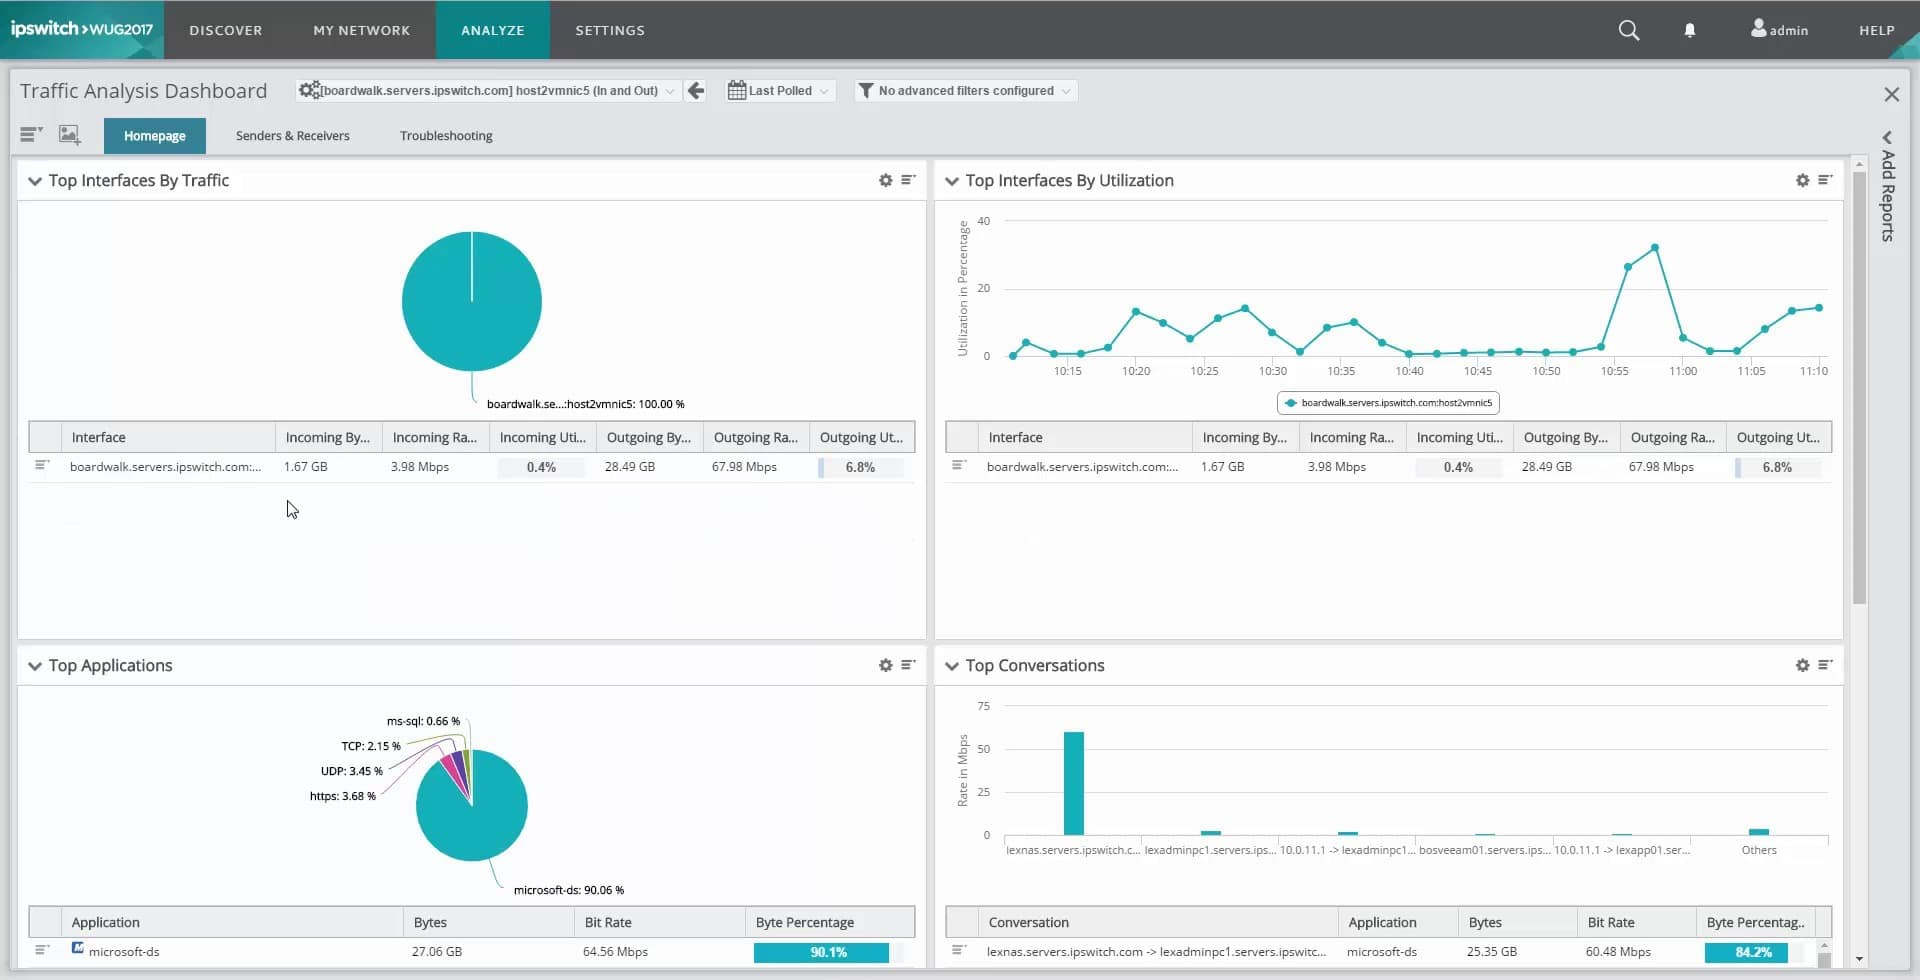
- Progress WhatsUp Gold This network performance monitor is an SNMP-based system and focuses on device activities and statuses. It can be extended by add-ons, which include a traffic analysis service. Runs on Windows Server.
- Cacti A free package for monitoring networks, servers, and applications with an attractive console that presents data in charts and graphs. It uses SNMP for its network monitoring service. Available for Windows, Windows Server, and Linux.
Keeping your SNMP monitoring constant and addressing performance issues as they occur ensures that your service stays online. You have the all-important opportunity to intercept problems before they take root and threaten your service.
Here are the best SNMP monitoring tools available on the market:
The Best SNMP Monitoring Tools
1. AdRem NetCrunch (FREE TRIAL)
AdRem NetCrunch is an IT system monitoring solution that uses SNMP to monitor devices and their availability and performance. It supports v1, v2, and v3 versions, so it can monitor almost any SNMP-enabled device in your network.
A notable aspect of this tool is that it can receive traps and notifications from v3 and forward them to other SNMP managers for further processing. This feature ensures that the alerts are not missed in the handling process.
NetCrunch also comes with 125+ preconfigured SNMP monitoring packs for seamless network management. With these packs, you can monitor all popular tools right out of the box.
Another important feature is the extensive SNMP MIB database. It comes with 8,700 modules across diverse vendors, making it easy to integrate any new tool into your monitoring platform. Each of these MIB modules is also available in the form of source code for easy customization. You can also edit it easily with the built-in MIB editor.
The pricing for NetCrunch starts at $3,600 in the Professional edition and $5,950 for the Enterprise edition.
Download a 30-day free trial.
EDITOR'S CHOICE
Our editors have selected NetCrunch as the best SNMP monitoring tool due to its extensive coverage and flexibility. Since it supports all SNMP versions, it can monitor any SNMP-enabled device on your network. Moreover, its ability to integrate new devices through 8,700 MIB modules is noteworthy. Another aspect that we love is the flexibility it offers through the SNMP profiles feature. This feature supports the secure handling of authentication details, thereby simplifying the setup and maintenance of SNMP devices. This blend of security and versatility adds value to any organization.
Download: 30-day FREE Trial
Official Site: https://www.adremsoft.com/netcrunch/download/
OS: Windows Server - Self-hosted server
2. ManageEngine OpManager (FREE TRIAL)
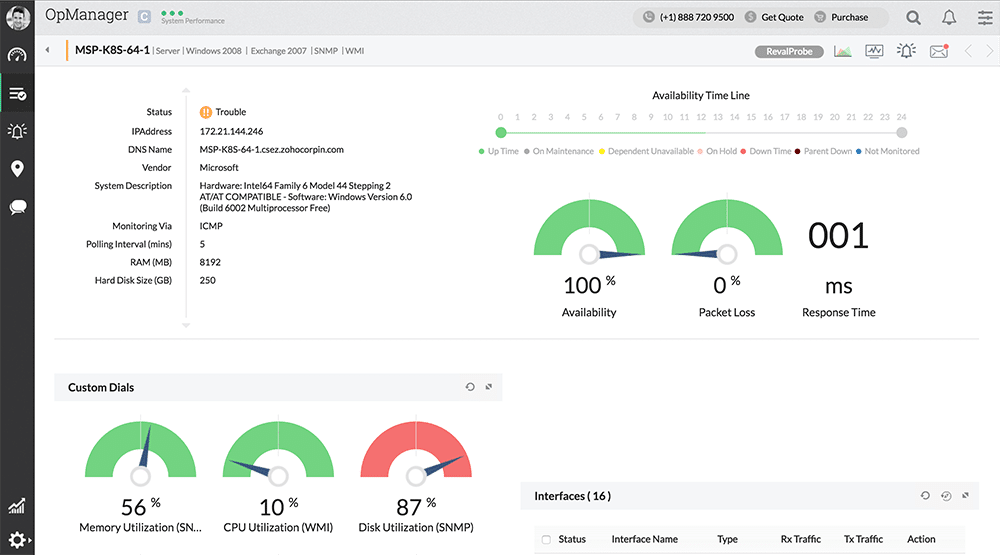
ManageEngine OpManager is a network performance monitor that brings potent SNMP monitoring capabilities and adds them to a contemporary user interface. This tool can handle almost 300 SNMP traps a second. However, Infrastructure monitoring is the bread and butter of this program’s monitoring abilities. The dashboard is customizable and allows you to drag and drop page elements to make monitoring as painless as possible.
In terms of set up, ManageEngine OpManager has its own automatic network discovery abilities. This helps to keep your monitoring environment up to date. When it comes to staying on top of new threats, ManageEngine OpManager allows you to take a proactive approach by automating basic troubleshooting and maintenance. In the event that something more serious takes place, you can view alerts pointing to the problem.
ManageEngine OpManager is compatible with Linux and Windows. On Windows, the ManageEngine OpManager platform is available on 2012 R2, 2012, 2008 R2, 2008, 2003 Server, Vista, 7, and 2000. One of the best things about this program is that there is a freeware version for smaller enterprises monitoring less than 10 devices.
There are three pricing options available for ManageEngine OpManager: Essential, OpManager Plus and Enterprise. The Essential version can be purchased for $595 (£456) and supports up to 25 devices. Likewise, OpManager Plus can be purchased for $995 (£763) for 25 devices. If you require more bandwidth then the Enterprise edition supports up to 500 devices for $16,495 (£12,658). You can download ManageEngine OpManager for a 30-day free trial.
3. Paessler PRTG Network Monitor (FREE TRIAL)

Another top-of-the-range SNMP monitor is Paessler PRTG Network Monitor, a Windows-based network monitoring tool that offers SNMP and ICMP polling to help you check up on the status of your connected devices. This platform has its own network discovery feature where you can scan for devices by IP range. Scanning for devices in this way means that you don’t have to waste time with manual configurations.
One of the strongest features of PRTG Network Monitor is its alerts and notifications system. It allows you to do the basics like sending notifications to an email or SMS but also allows you to write your own notification scripts with the API. When combined with custom notification triggers this really allows you to structure your own monitoring environment however you like.
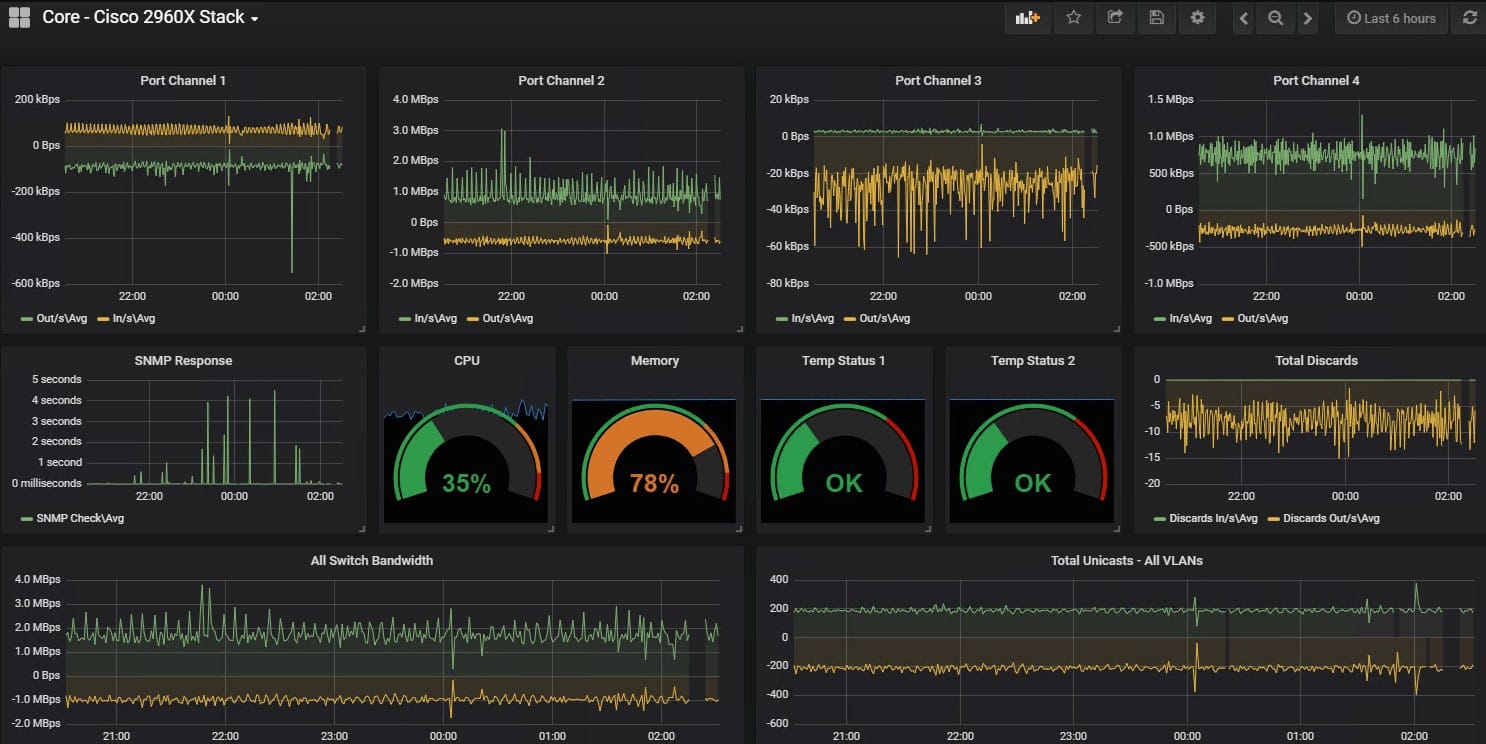
It is worth mentioning that the quality of visualization and displays in PRTG Network Monitor is second to none. While some displays and sensors can be a little daunting at first, once you get used to them you can read them in seconds. Visualization on PRTG Network Monitor includes color-coded dials, graphs and network maps. PRTG Network Monitor offers users a scalable pricing structure. If your needs increase, then you can simply move up to the next bracket of the pricing plan. This means there is little to no risk of outgrowing PRTG Network Monitor.
PRTG Network Monitor offers a freeware option for small businesses who need less than 100 sensors. The normal price range starts from $1,600 (£1,227) for PRTG with 500 sensors. PRTG 1000 can be purchased for $2,850 (£2,186) with 1000 sensors. The next largest versions are PRTG 2500 which is $5,950 (£4564) for 2500 sensors and PRTG 5000 for $10,500 (£8,056) with 5000 sensors. If you need unlimited servers you can purchase PRTG XL1 for $14,500 (£11,125) or PRTG XL5 for $60,000 (£46,034). You can also download PRTG Network Monitor on a 30-day free trial.
4. Site24x7 Network Monitoring (FREE TRIAL)

Site24x7 Network Monitoring is part of a cloud system that is able to monitor local systems from its location in the cloud by installing an agent program. That agent acts as the SNMP Manager. It broadcasts SNMP requests and gathers all responses, uploading to the Site24x7 server for analysis.
The system server receives SNMP data and uses it to create a hardware inventory. This includes all network-connected devices, such as firewall appliances storage devices, printers, and endpoints, as well as switches and routers. This inventory is kept up to date with each SNMP scan.
The Site24x7 Network Monitoring module generates a Layer 2 network topology map on demand. This is based on the data held in the network inventory, so when an SNMP search updates the inventory, the network map also gets updated automatically.
The local agent passes SNMP Traps to the server where they become alerts in the console. You can set up the system to forward alerts to technicians by email, SMS, or voice call. The system can also generate alerts if its performance thresholds get tripped or if a network device runs short of resources.
Site24x7 sells packages of monitoring tools rather than subscriptions to individual modules. An example is the Infrastructure plan, which includes the Network Monitoring module. The price for this plan starts at $9 per month when paid annually. You can get this package on a 30-day free trial.
5. Zabbix
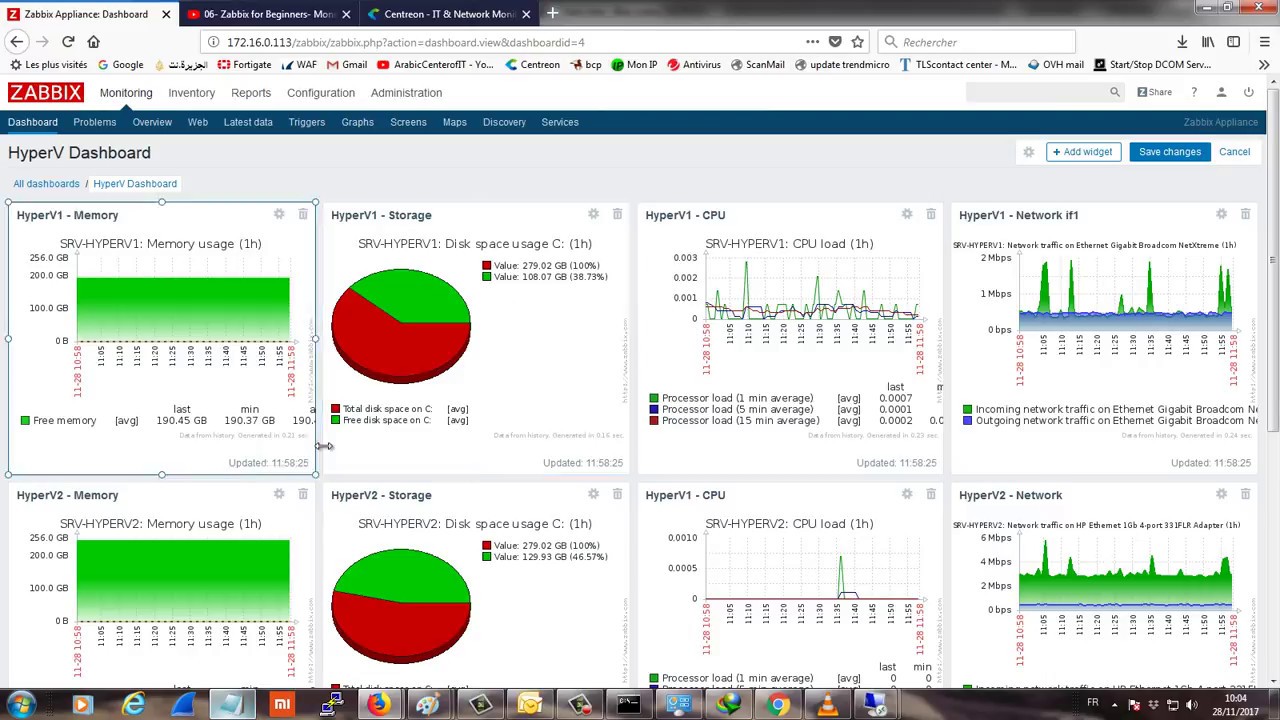
There are few open-source network monitoring tools that deliver as compelling a user experience as Zabbix. Zabbix operates through a web-GUI. This tool uses SNMP and IPMI so that you can monitor the health of devices such as routers and switches for signs of poor performance. The Zabbix agent is well-designed with basic displays that help you to find the exact data you need.
In terms of SNMP monitoring capabilities, Zabbix SNMP support is available from devices with v1, v2, or v3 SNMP agents. This tool allows the user to collect SNMP in two ways: SNMP polling mode or the snmptrap daemon utility. Combining SNMP polling with SNMP traps provides you with complete visibility over SNMP-enabled devices.
When it comes to configurations, Zabbix is as simple as you want to make it. You can autodiscover devices to see not just when new devices are added or removed but when configuration changes occur as well. This simplicity carries over to monitoring templates as well. You can use out-of-the-box monitoring templates to help you or you can design your own configurations. The out-of-the-box templates are great for new users while more experienced users can design their own configurations from scratch.
While Zabbix offers a strong overall design it has been known to experience difficulties coping with networks with over 1,000 nodes. As such this means its best for smaller businesses. Zabbix can be downloaded for free on CentOS, Debian, Oracle Linux, Red Hat Enterprise Linux, and Ubuntu. You can download Zabbix directly from their site.
6. Nagios XI

Nagios XI is well-known for its diverse SNMP monitoring capabilities. As one of the most popular network monitoring products on the market, Nagios XI delivers a solid agentless monitoring experience with SNMP. You can view network health, send SNMP traps, and monitor resources like Windows Event Logs to stay on top of day-to-day events.
This tool is also very easy to use. This is showcased by its use of configuration wizards. Configuration wizards take you through the process of setting up monitoring for a variety of devices and services. For instance, there is a Linux SNMP wizard that shows you how to monitor a Linux workstation or server. These eliminate the guesswork from using Nagios XI and help to speed along the onboarding process.
The only drawback with Nagios XI is that it doesn’t have an autodiscovery feature. This means that you’re forced to manually configure your network. While this isn’t a dealbreaker it is certainly less convenient than some of the alternatives on this list with autodiscovery.
Nagios XI is available on Microsoft (through VMWare or Virtualbox), Linux and VMware. The price of Nagios XI starts from $1,995 (£1,530) for the standard edition. The other version of Nagios XI is the Enterprise edition which is available from a price of $3,495 (£2,681). This includes scheduled reporting, capacity planning reports, and web-based server console access. You can also download Nagios XI on a 60-day free trial.
7. OpenNMS
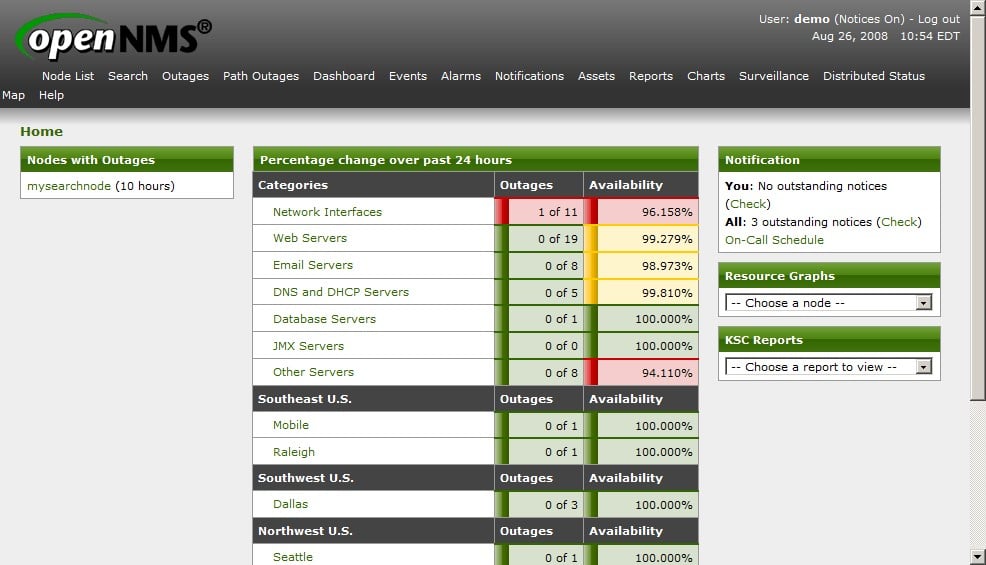
OpenNMS is another excellent open-source SNMP monitoring tool. OpenNMS has been designed to monitor network performance by collecting data through the use of SNMP, WMI, JMX, NRPE, and XMP. The SNMP polling abilities of this tool have the ability to make sure your infrastructure is in good health. You can also use SNMP data to discover new devices throughout your network.
While OpenNMS’s design is easy to use, it feels outdated when compared to the top products on this list. However, that doesn’t stop it from delivering a first-rate monitoring experience. Like all of the top SNMP monitoring tools, you can configure alarms to notify you in the event a key service goes down. You can also configure alarms by threshold so that if a device’s usage moves above or below a predefined parameter it will let you know.
Visualization is one area that OpenNMS performs very strongly. There are a variety of visual displays such as graphs, pie charts, and maps which help to show you the key trends across your network. There is even a heatmap function so that you can look to see if there are any weak points in your network connectivity. This provides you with a more comprehensive perspective when it comes to time to troubleshoot.
Overall this is a program you should definitely consider if you want to monitor your network on a budget. OpenNMS can be installed on CENTOS, RHEL, Debian, Ubuntu, Windows Server, and Docker. If you’re interested in downloading OpenNMS you can get it for free directly from their site.
8. Progress WhatsUp Gold
Progress WhatsUp Gold uses SNMP monitoring to keep tabs on your network and provide real-time updates on the performance of your network infrastructure. This is kept updated with an autodiscovery feature that you can use to find devices automatically. WhatsUp Gold is available on the following operating systems: Windows Server 2008 R2, 2012, 2012 R2, or 2016.
You can configure your own alert criteria to keep you notified when a device goes down. When using this program you’re always aware of what is happening thanks to how well laid out the design is. For instance, on the home dashboard, you can view your Current Device Status which shows a numerical, color-coded display telling you how many devices are classified as Up, Down, Maintenance, or Unknown. From this position it’s very easy to launch straight into troubleshooting or combing through your network. You can view key metrics like ping availability, interface errors, and interface utilization.
WhatsUp Gold also has a premium network topology map. You can view your devices plotted on a canvas to see how they connect to each other. This is color-coded so you can tell if you need to take action from a single glance.
WhatsUp Gold is available as an annual subscription and license. The Premium annual subscription features network monitoring, server monitoring, cloud service monitoring, a topology map, alerts, and custom dashboards. This is the same for the Premium license version as well. The Total Plus license takes these features and adds network traffic analysis, application monitoring, virtualization monitoring, and configuration management. If you’d like to try out WhatsUp Gold you can do so by downloading the free trial.
9. Cacti

Cacti is an SNMP monitoring tool that takes usage data and displays in graph format. Cacti doesn’t have a fancy GUI or an abundance of features but it does have a back-to-basics approach to network monitoring. Cacti puts complete emphasis on data monitoring rather than its design. The RRD graphs provide you with all the information you need to develop a sophisticated impression of your network.
While the design of Cacti appears quite dated it is actually quite scalable. Templates allow you to define a graph or data source template allowing you to customize the graph structures according to your needs. This provides you with the basic visibility you need to monitor effectively.
Even though Cacti is a small network monitoring tool it boasts a sizeable online following. The Cacti forums have over 20,000 users and 160,000 posts. So if you’re ever having difficulties with Cacti this is an excellent resource for helping you to find a solution.
Cacti is available for Windows and Linux. Cacti can be installed on a variety of Linux distributions including; Gentoo, Debian, Redhat/Centos, Fedora, and SUSE. However, you also need MySQL, PHP, RRDTool, net-snmp, Apce, and IIS in order to operate it. If you’d like to download Cacti you can do so for free.
Best SNMP Monitoring Tools
After examining all the tools on this list we have to give the nod to ManageEngine OpManager and Paessler PRTG Network Monitor. These solutions are scalable and suitable for SMEs and larger companies alike.


