
One of the most well-known and widely used open-source network monitoring tools is Cacti. Cacti gives you the ability to monitor a variety of parameters and view them from a dashboard that is both user-friendly and up-to-date. Cacti was originally developed as a web application for the LAMP (Linux, Apache, MySQL, and PHP) stack, but over the years it has become capable of running on Windows as well. In this article, we will be looking at the best Cacti monitoring alternatives.
Here is our list of Best Cacti monitoring Alternatives:
- Site24x7 Network Monitoring EDITOR’S CHOICE This SaaS package provides network monitoring, including a Cisco Meraki monitor, and it also offers tracking for server resources and middle-ware activity. Access a 30-day free trial.
- ManageEngine OpManager (FREE TRIAL) Performs real-time monitoring of several essential characteristics, including memory, bandwidth, and CPU use, to assist in determining the underlying cause of issues relating to network latency and performance degradation. Start a 30-day free trial.
- ManageEngine Netflow Analyzer (FREE TRIAL) Users can control file configurations throughout the network with the help of NetFlow Analyzer, which ensures compliance for businesses. Start a 30-day free trial.
- Paessler PRTG (FREE TRIAL) Capable of generating maps and dashboards that include live information, from which you can quickly gain an insight into the present health of your infrastructure as well as the challenges that are driving it. Start a 30-day free trial.
- SolarWinds Network Performance Monitor An industry standard when it comes to network monitoring and management, and their ever-growing offerings and rock-solid support are always there around the clock if you need assistance with any of their Software packages.
- Nagios It is the enterprise monitoring tool that we use to keep track of all servers and network devices that require notifications to be sent to supporting staff.
- LibreNMS A full-fledged network monitoring system that offers support for a wide variety of device types and suppliers, such as Linux, Foundry, Cisco, and a great number of other option
- Netdata It is a tool that can run on virtual machines (VMs), containers, Internet of Things (IoT) devices, and physical devices.
Cacti may be widely utilized across a variety of industries; however, it does have several drawbacks, including a complicated configuration procedure that may be riddled with errors, challenges in changing the configuration, and effectively managing change, challenges in installing plugins, and several other challenges. Before deciding on the solution that is most suited to meet the requirements of your company, it is worthwhile to look at the best cacti monitoring alternatives.
The Best Cacti Monitoring Alternatives
1. Site24x7 Network Monitoring (FREE TRIAL)

Site24x7 Network Monitoring is a SaaS module that is provided as part of the Site24x7 Infrastructure plan. The service provides network device status monitoring and traffic analysis. You also get monitoring for servers, virtualizations, containers, and cloud platforms in the Infrastructure package. This system will monitor wireless networks as well as LANs.
Key Features:
- Delivered from the cloud with a web-based console
- Customizable monitoring screens with graphs and data tables
- Network device monitoring with SNMP
- Traffic monitoring with NetFlow, IPFIX, sFlow, J-Flow, CFlow, AppFlow, and NetStream
- Included with server and middleware monitors
- Identifies top traffic generators
- Includes performance thresholds that trigger alerts when crossed
Why do we recommend it?
Site24x7 Network Monitoring stands out as a top-tier Cacti alternative due to its cloud-based delivery, providing a web-based console for easy access and management. The service offers comprehensive network device status monitoring and traffic analysis, making it a versatile solution for monitoring wireless networks and LANs. With customizable monitoring screens, SNMP-based device monitoring, and support for various traffic monitoring protocols like NetFlow and IPFIX, Site24x7 ensures a thorough and real-time view of network performance. The inclusion of server, virtualization, container, and cloud platform monitoring further enhances its capabilities.
The package provides constant scanning of a network and that discovers all devices and registers them in an inventory. The system also draws up a Layer 2 network topology map. These system documentation features are constantly updated.
Continuous device monitoring is implemented with SNMP and there are also Ping-based tests available. SNMP Traps and performance dips provoke alerts, which can be forwarded as notifications by email or SMS.
Network traffic monitoring is implemented by statistics gathering protocols, such as NetFlow, J-Flow, and IPFIX. These extract stored statistics from switches, routers, and other network equipment. Again, alerts are available for irregular traffic patterns or device availability problems.
Who is it recommended for?
Site24x7 Network Monitoring is well-suited for network administrators, IT professionals, and businesses that prioritize real-time monitoring, customizable screens, and a wide array of supported protocols. The system’s ability to identify top traffic generators, continuous device monitoring with SNMP, and alerting mechanisms for irregular traffic patterns make it ideal for enterprises looking for a comprehensive and scalable network performance monitoring solution.
The Site24x7 Infrastructure plan watches over all equipment behind applications. However, there is a degree of application monitoring in this package as well. For example, virtualizations and containers are covered by this plan. You can assess the Site24x7 Infrastructure system with its network monitoring unit with a 30-day free trial.
EDITOR'S CHOICE
Site24x7 Network Monitoring is our top pick for a Cacti Monitoring alternative because this platform has so much more to offer than the on-premises Cacti product. While Cacti is a great little tool for those who have no money at all, the system is not that great and the low price of Site24x7 means that you get so much more for just a few dollars per month. Site24x7 is a cloud-based service so you don’t have to worry whether or not you have the right operating system on-site to host it. The console is accessed through any standard Web browser and you can monitor multiple sites through it with one account. Site24x7 delivers all of its subscribers both network device status monitoring and traffic analysis. This package also provides network configuration management and log management. You get monitoring for endpoints and cloud platforms as well with Site24x7 and its plans include performance tracking and analysis for on-premises software and Web applications. The Site24x7 package is pretty hard to beat.
Download: Access a 30-day FREE Trial
Official Site: https://www.site24x7.com/signup.html?pack=44&l=en&lp=1
OS: Cloud-based
2. ManageEngine OpManager (FREE TRIAL)
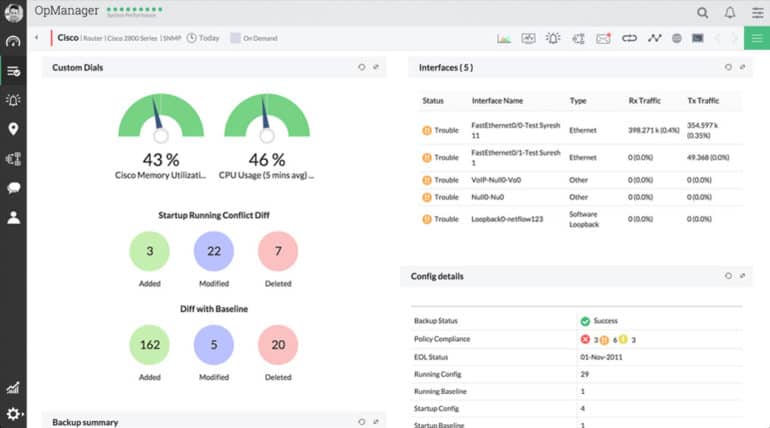
Users can monitor the availability, traffic, packet loss, performance metrics, and reaction time of a wide variety of devices with ManageEngine OpManager. These devices include servers, routers, switches, and virtual machines. OpManager is designed to provide automatic notifications to relevant users via email or text message if any piece of equipment fails.
Key Features:
- A simple and uncomplicated setting up procedure
- Capabilities for creating exceptional graphs
- Mobile application available
- You can manage and monitor daemon processes in addition to background processes
- Errors can be configured to be automatically handled, which will assist you in achieving a higher application uptime.
Why do we recommend it?
ManageEngine OpManager earns its recommendation as a strong alternative to Cacti due to its user-friendly setup process, exceptional graph creation capabilities, and the availability of a mobile application for on-the-go monitoring. The platform provides comprehensive monitoring, including availability, traffic, packet loss, and performance metrics for various devices, making it suitable for servers, routers, switches, and virtual machines. OpManager’s ability to automatically handle errors contributes to achieving higher application uptime, while its support for sFlow, IPFIX, jFlow, and NetFlow ensures effective analysis and balancing of network traffic.
Through the use of sFlow, IPFIX, jFlow, and NetFlow, OpManager analyzes the patterns of network traffic and the amount of bandwidth required by various devices and applications. This analysis is done to set traffic so that it is balanced across the system. Users can view all of their performance indicators as well as their bandwidth use on a single screen.
The extensive reports that are generated by OpManager not only offer a graphical depiction of the current state of affairs but also aid in auditing and the process of maintaining compliance with industry standards. In addition to this, it can be of assistance to those responsible for making decisions on capacity planning, resource usage, and other issues.
It compiles all of this data and displays it to you in the form of reports and user-friendly dashboards. Based on these specifics, you will be able to determine the underlying reason and promptly troubleshoot the issue.
The characteristics of this program for comprehensive database monitoring allow for the tracking of the availability, health, and performance of essential database servers. You can do a gap analysis to proactively resolve issues and prevent them from having an impact on your infrastructure by using the information that has been provided.
Who is it recommended for?
ManageEngine OpManager is recommended for users and organizations seeking an easy-to-set-up network monitoring solution with robust capabilities. Its mobile application makes it convenient for administrators and IT professionals to monitor and manage network devices remotely. The program’s features, such as comprehensive database monitoring, proactive issue resolution through gap analysis, and detailed reports and dashboards, make it suitable for a wide range of businesses looking to maintain optimal network performance and troubleshoot issues promptly.
3. ManageEngine Netflow Analyzer (FREE TRIAL)

ManageEngine Netflow Analyzer gathers and analyzes data, and then a report will be provided to you on who is using your bandwidth and for what purpose. When it comes to optimizing network flow monitoring, traffic analysis, and network forensics, this can be of tremendous assistance.
Key Features:
- Exclusive solution for monitoring bandwidth usage
- Determines which non-standard applications are consuming an excessive amount of your bandwidth.
- Provides detailed reports
- An outstanding resource for computer and network forensics
Why do we recommend it?
ManageEngine NetFlow Analyzer is strongly recommended as an exclusive solution for monitoring bandwidth usage, conducting traffic analysis, and performing network forensics. Its capability to determine bandwidth consumption by non-standard applications and provide detailed reports sets it apart as a valuable resource for optimizing network flow monitoring. The inclusion of deep packet inspection (DPI) allows businesses to monitor application traffic and gain visibility into network delivery issues, making it an essential tool for enhancing network performance and troubleshooting.
You won’t simply be able to monitor traffic with the assistance of ManageEngine NetFlow Analyzer; you’ll also be able to spot performance issues and troubleshoot them. Not only are you able to spot traffic irregularities, bandwidth hogs, and downtimes with the help of its extensive forensics and troubleshooting reports, but you can also track every hop and latency either historically or in real time.
Deep packet inspection (DPI), which is included, enables businesses to monitor application traffic and obtain visibility into network delivery problems. In addition, the solution enables businesses to collect insights into the requirements of the information technology department and develop reports to illustrate business forecasts.
The advanced security analytics module (ASAM) of NetFlow Analyzer enables businesses to perform zero-day testing with the assistance of a variety of security technologies, including firewalls, intrusion detection, and prevention software, and network behavior analysis. It is offered on a subscription basis that is paid every month, and assistance is provided by documentation, phone, and email.
Who is it recommended for?
ManageEngine NetFlow Analyzer is recommended for businesses and IT professionals seeking a specialized solution for monitoring and optimizing bandwidth usage. Its detailed reports and extensive forensics and troubleshooting capabilities make it particularly valuable for identifying performance issues, tracking bandwidth usage patterns, and ensuring network security. The advanced security analytics module (ASAM) further positions it as a reliable choice for businesses looking to conduct zero-day testing and enhance their overall network security posture.
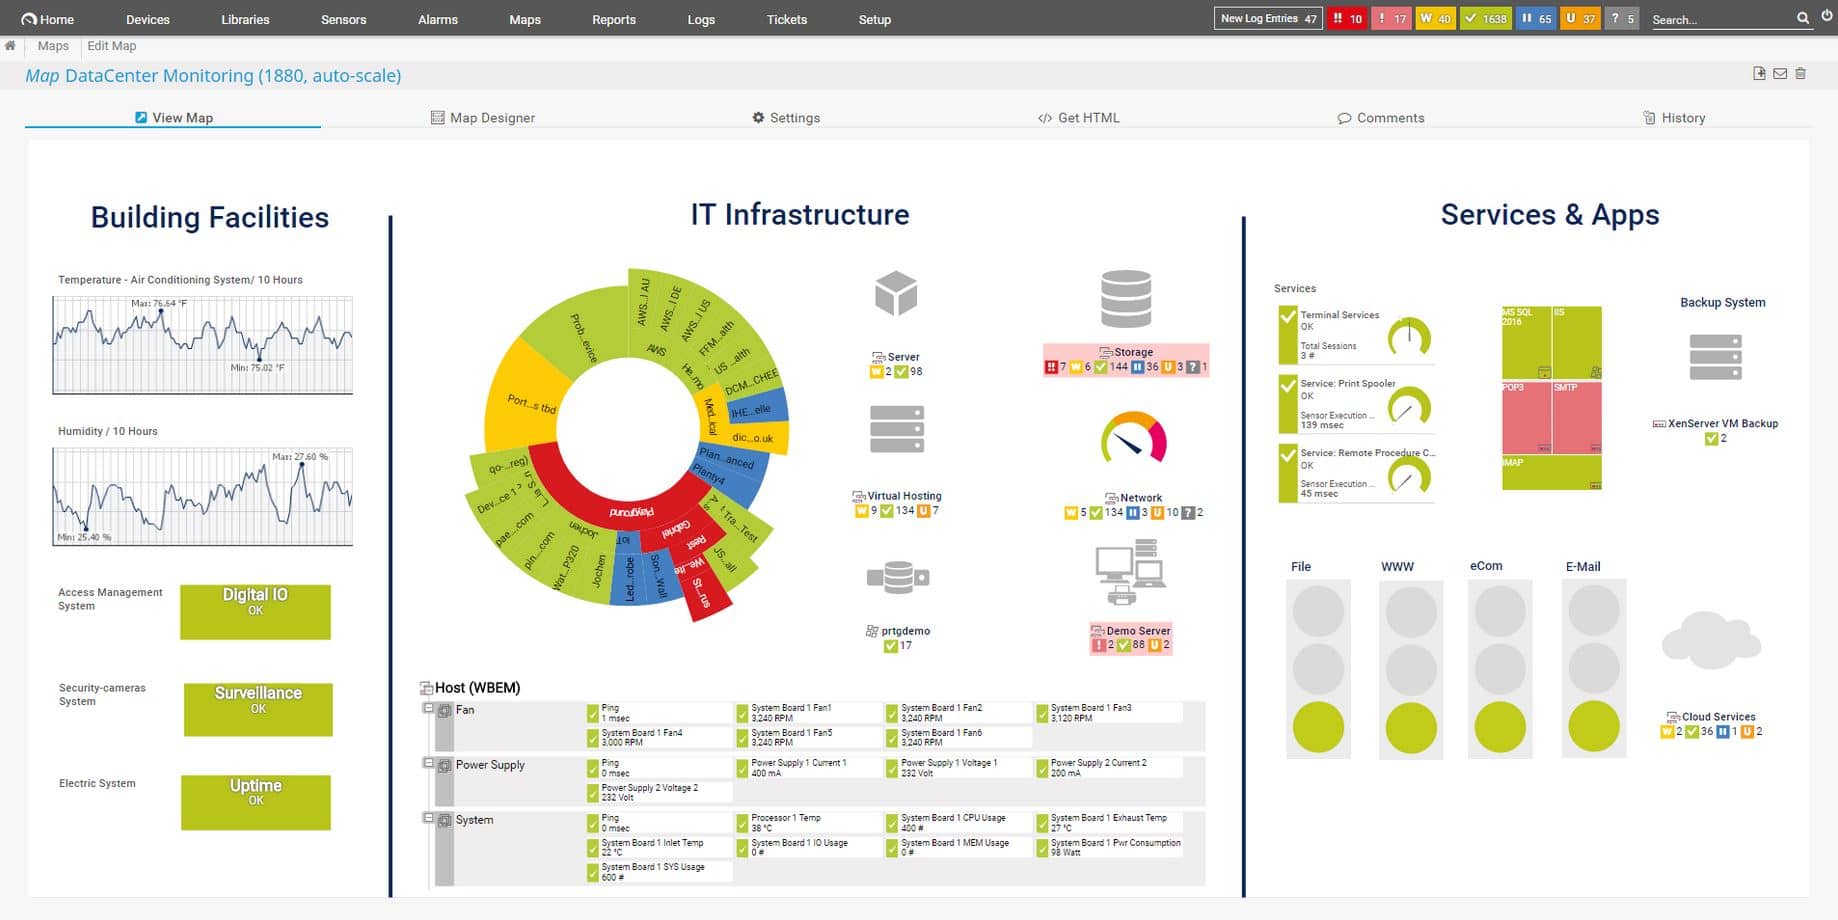
4. Paessler PRTG (FREE TRIAL)
If you can get past the licensing scheme, Paessler PRTG is an outstanding management platform that’s designed squarely for IT professionals who not only know what they’re doing but also what they’re managing. If you can get past the licensing arrangement, you’ll find that this platform has a lot to offer. It supports a wide variety of devices, has a deep feature set, and is simple to use.
Key Features:
- A sensor-based system that enables users to monitor and pay for only the items that they require.
- Comprehensive capabilities for monitoring the network.
- A very reliable warning system.
Why do we recommend it?
Paessler PRTG is an exceptional management platform designed for seasoned IT professionals who are well-versed in both network management and system administration. While the licensing scheme may pose initial challenges, the platform’s extensive feature set, support for a wide range of devices, and user-friendly interface make it a standout choice for network monitoring. PRTG operates on a sensor-based system, allowing users to monitor and pay for specific items tailored to their requirements. The platform’s robust capabilities for comprehensive network monitoring, coupled with a reliable warning system, make it a compelling choice for organizations seeking an effective and efficient solution.
Paessler PRTG analyzes the traffic data coming from your networking devices and notifies you of any excessive use of your bandwidth in addition to showing you exactly where your bandwidth is being consumed. You can examine these aspects using the centralized dashboard, or you may generate reports to discuss them with your team.
When analyzing the state of your network’s architecture and bandwidth, the PRTG makes use of several monitoring protocols, including SNMP, WMI, and NetFlow. Because of this, it is an exceptionally dependable technique that has a low risk of producing false-positive results.
Your entire IT infrastructure can be monitored by PRTG, and it supports all of the most important technologies. Some of these include SNMP, WMI, and Windows Performance Counters, SSH, Traffic analysis using flow protocols or packet sniffing, HTTP requests, REST APIs returning XML or JSON, Ping, and SQL, amongst many others. It also has a PRTG map builder, which allows you to create individualized dashboards by using the software.
Who is it recommended for?
Paessler PRTG is recommended for IT professionals and organizations with a solid understanding of network management. The platform’s flexibility in supporting various devices, coupled with its sensor-based approach, makes it suitable for those who want to monitor specific elements of their IT infrastructure. Despite potential challenges in the licensing arrangement, PRTG’s deep feature set and reliability in analyzing network traffic, bandwidth usage, and overall IT infrastructure position it as a valuable tool for organizations of varying sizes.
5. SolarWinds Network Performance Monitor

The SolarWinds Network Performance Monitor (NPM) provides complete network fault monitoring and performance management in a system that adapts and expands to the requirements of an organization’s network monitoring system. Users can collect and examine availability, real-time and historical statistics from routers, switches, or WMI-enabled devices straight from a web browser. These statistics can be collected from any SNMP-, ICMP-, or WMI-enabled device.
Key Features:
- Fast detection, diagnosis, and resolution of network performance issues to prevent downtime
- Able to react to various condition checks, events that are connected, and device dependencies
- Calculate automatically the dates when the capacity will be exhausted, using customizable thresholds that are based on peak and average demand.
- Alternatives for visualizing the critical path
- Outstanding notifications system that allows for complete personalization
- A streamlined and user-friendly interface that may be adapted to your specific requirements.
- Capabilities of auto discovery as well as automatic generation of network topology maps
Why do we recommend it?
SolarWinds Network Performance Monitor (NPM) earns its spot as one of the best Cacti monitoring alternatives due to its comprehensive network fault monitoring and performance management capabilities. It stands out with its ability to swiftly detect, diagnose, and resolve network performance issues, preventing downtime effectively. The program’s robust features include automatic calculation of capacity exhaustion dates, customizable thresholds, and an exceptional notifications system. With SNMP monitoring and auto-discovery functions, NPM provides essential metrics and generates topology maps for an insightful overview of your network.
SNMP monitoring is utilized by the program to obtain the most important metrics about your network. A topology map of your network can also be easily generated using its auto-discovery functions, which are quite useful. You have the flexibility to tailor the NPM to meet your requirements thanks to its availability for deployment on-premises as well as in the cloud.
SolarWinds Network Performance Monitor is compatible with Windows Server 2012 R2, 2019, and 2016. It can also be installed on Windows Server 2016. In addition, it can integrate with the remaining components of the SolarWinds suite as well as the Orion platform, provided that you already have those components installed. Solar winds are also the company that set the standard for this industry.
You’ll have a much easier time isolating problems and getting to the bottom of them if you utilize NPM because it lets you generate custom maps and visual routes. In addition to this, it connects with Orion Maps to help you make sense of the different information that exists inside your network and provide you with a perspective on the wider picture. These visualizations bring to light any potential bottlenecks in the flow of traffic that may occur between the nodes that make up your network.
Who is it recommended for?
SolarWinds NPM is recommended for organizations seeking an advanced Cacti alternative with robust fault monitoring and performance management features. It is well-suited for network administrators and IT professionals who prioritize fast issue resolution, customizable notifications, and the flexibility to adapt the interface to specific requirements. The program’s compatibility with various Windows Server versions and integration with the SolarWinds suite make it suitable for a wide range of enterprises looking for a scalable and efficient network monitoring solution.
You can try SolarWinds Network Performance Monitor through a free and fully functional 30-day trial.
6. Nagios
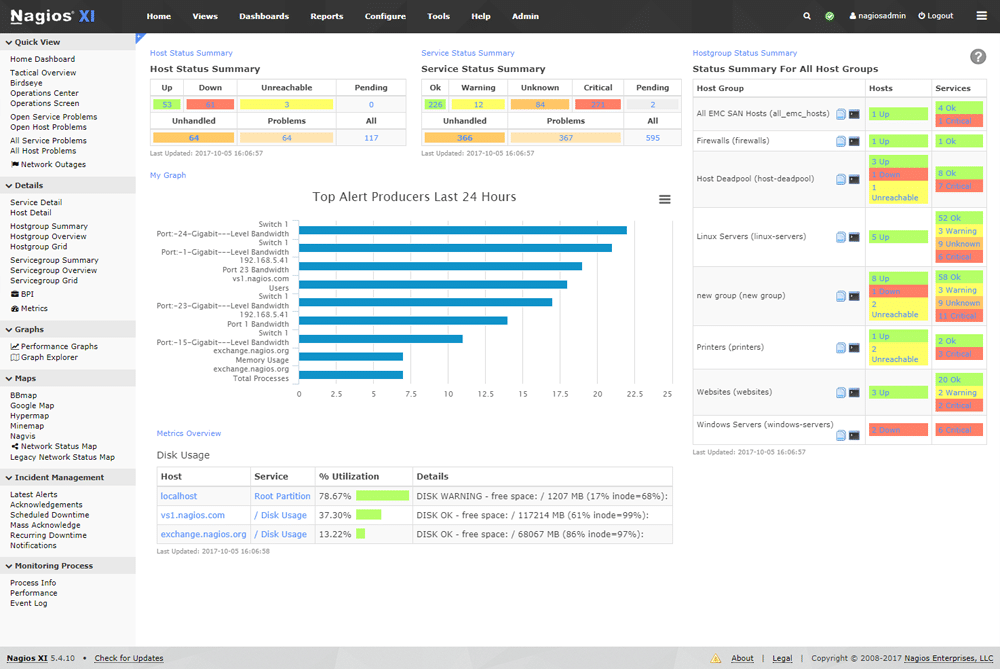
Nagios is quite effective at performing the standard monitoring of servers and network devices. If you have an environment that has to be monitored using numerous fundamental protocols, Nagios will function effectively for you right out of the box. It also operates with a very high degree of dependability.
Key Features:
- If you have good event handlers, you can automatically restart any applications that have failed.
- Capabilities for selective access provide you with the ability to determine who sees what.
- A vast online community with more than one million members who are currently active.
- Excellent integrations suite.
- Extremely scalable, much more so than cacti by a substantial margin.
- Keeps an eye on a wide range of standardized measures.
- Complies with established protocols (SNMP).
Why do we recommend it?
Nagios stands out as a highly effective and reliable monitoring solution for servers and network devices, offering robust functionality right out of the box. With capabilities for automatic application restart through event handlers, selective access control, and a vast online community of active members, Nagios ensures a comprehensive and dependable monitoring experience. Its extensive integrations suite, scalability, and adherence to standardized protocols, such as SNMP, make it a top choice for organizations looking to monitor and manage their network infrastructure effectively.
When used in situations with seven nodes and hosts or fewer, the Nagios monitoring software is provided free of charge. The pricing of the paid version begins at $1995 for the license and is based on the number of users. Additionally, there is a wide selection of free training choices for Nagios that can be found online. There is a free trial included with both of Nagios’ commercial editions.
When it comes to monitoring networks, Nagios is head and shoulders above Cacti. Cacti does have some network monitoring functionalities, but it is ideally combined with Datadog or RRDtool for maximum effectiveness. On the other hand, Nagios may be integrated with additional network monitoring solutions, which gives it an advantage in this respect.
Since the tool makes use of the Core 4 monitoring engine, it not only provides you with a high level of performance but also has a relatively low level of consumption, making it extremely cost-effective in terms of resource use.
Nagios is the enterprise monitoring tool that we use to keep track of all servers and network devices that require notifications to be sent to supporting staff. The majority of our information technology workers as well as other departments that are responsible for managing individual apps make use of it. It is a very critical tool that we employ to guarantee that the services and apps that we host and provide support for are running as expected.
Who is it recommended for?
Nagios is recommended for organizations and IT professionals seeking a powerful monitoring tool with broad capabilities. Its scalability, reliability, and compatibility with established protocols make it suitable for environments of varying sizes. Nagios is particularly well-suited for scenarios with seven nodes or hosts or fewer, as it offers a free version for such use cases. Whether used by IT staff or other departments managing specific applications, Nagios serves as a critical tool for ensuring the smooth operation of services and applications, making it an indispensable asset for comprehensive network monitoring.
7. LibreNMS

LibreNMS is a fully-fledged network monitoring system that offers support for a wide variety of device types and suppliers, such as Linux, Foundry, Cisco, and a great number of other options. As a direct consequence of this, it is one of the tools on this list that can be used immediately after it has been purchased. In addition to this, it has auto-discovery features that help you set it up in the shortest amount of time feasible.
Key Features:
- The entirety of the LibreNMS API is capable of quickly retrieving, managing, and graphing massive amounts of data.
- Able to generate bills for bandwidth based on the amount of data used.
- Horizontal scaling is an option to consider after your company reaches a certain size.
- Compatible with RANCID, collected, SmokePing, Oxidized, and a plethora of more solutions
- A wide selection of authenticating techniques is at your disposal.
Why do we recommend it?
LibreNMS stands out as a comprehensive network monitoring system that supports a diverse range of device types and suppliers, including Linux, Foundry, Cisco, and more. The tool’s immediate usability post-purchase and auto-discovery features make it a quick and efficient choice for organizations looking to set up network monitoring swiftly. The LibreNMS API is a standout feature, enabling the rapid retrieval, management, and graphing of large datasets. With the ability to generate bandwidth usage bills, support for horizontal scaling, compatibility with various solutions like RANCID and SmokePing, and a wide range of authentication methods, LibreNMS offers a robust and flexible network monitoring solution.
Both bandwidth monitoring and location-based mapping are within the scope of the tool’s capabilities. In addition to having an open application programming interface (API), LibreNMS can also be locally hosted on most Linux distributions. In addition, there are apps for both Android and iOS.
LibreNMS is ready to function out of the box with a wide variety of vendors, including Cisco, HP, Juniper, and most other brands that are likely supported. It is packed with functions that you would never use for any device, and it can be integrated with a wide variety of plugins that assist with maintenance of configuration settings and mapping of weather patterns.
Who is it recommended for?
LibreNMS is recommended for organizations of varying sizes seeking a versatile network monitoring system. Its broad device compatibility makes it suitable for those with diverse IT environments, including Cisco, HP, Juniper, and more. The tool’s immediate functionality out of the box and user-friendly auto-discovery features cater to users looking for quick and efficient deployment. Additionally, the availability of Android and iOS apps enhances accessibility for monitoring on the go. Whether you need bandwidth monitoring, location-based mapping, or integration with various plugins, LibreNMS provides a comprehensive solution for effective network monitoring.
8. Netdata

Monitoring of system and application health and performance in real-time is provided by Netdata, which is a distributed service. It is a monitoring agent that has been well optimized that you will deploy on all of your systems and containers. Using highly interactive online dashboards, Netdata offers unrivaled insights into everything taking place on the systems it administers, including web servers, databases, and applications. These insights are provided in real time.
Key Features:
- Detection and monitoring of your services and applications on an automatic basis
- Able to monitor dozens of metrics on each node simultaneously
- An outstanding presentation within the dashboard itself
- A more developed warning system
- A bespoke database management system
Why do we recommend it?
Netdata can monitor numerous metrics simultaneously on each node, presenting these insights through highly interactive online dashboards. The tool’s advanced warning system and bespoke database management system contribute to its effectiveness. Whether operating independently or integrated into existing monitoring toolchains like Prometheus and Grafana, Netdata ensures continuous monitoring without interfering with primary system operations. Its efficiency, versatility across various operating systems, and the ability to quickly identify infrastructure issues make Netdata a powerful and free open-source monitoring solution.
It can operate independently, without the use of any third-party components, or it may be connected with previously established monitoring toolchains (Prometheus, Graphite, OpenTSDB, Kafka, Grafana, etc.). Netdata is meant to run continuously on all systems (physical and virtual servers, containers, and Internet of Things devices) without interfering with the systems’ primary operations, making it a quick and effective data storage solution.
When it comes to the utilization of available resources, the tool is both quick and incredibly efficient. It is designed to function faultlessly across all operating systems. Using the millions of indicators that it monitors; it will immediately identify any slowdowns or problems that are occurring within your infrastructure.
In addition to that, it features powerful visualization capabilities as well as an alerting mechanism. Additionally, it is open-source and free. In addition to this, the tool will save all of your current metrics to RAM and will write past data to your disk so that you may have a record of them indefinitely.
Who is it recommended for?
Netdata is recommended for organizations and users looking for a real-time, comprehensive monitoring solution for both systems and applications. Its automatic detection and monitoring features make it suitable for those who prioritize ease of use and quick deployment. Whether you are running physical servers, virtual servers, containers, or IoT devices, Netdata operates seamlessly across various environments. The tool’s open-source nature and free availability make it accessible to a broad user base. Netdata’s ability to save current metrics to RAM and archive past data to disk ensures a continuous and reliable record of performance metrics for ongoing analysis and troubleshooting.
Cacti Monitoring Alternatives – Editor’s Choice
All of these tools offer a fantastic replacement for Cacti, with some of them simply surpassing its functionality and others performing particular aspects of their job more effectively.


