As the list of cyber threats increases, there is a growing need for security teams to work smarter by leveraging AI. AIOps platforms enable companies to automate monitoring tasks like root cause analysis and anomaly detection to deliver a more comprehensive monitoring experience. In this article, we’re going to look at the nine best AIOps platforms on the market.
Here is our list of the best AIOps Platforms:
- ManageEngine OpManager Plus EDITOR’S CHOICE An advanced AIOps platform offering AI and ML-driven insights, real-time alerts, and automated remediation for seamless IT operations. Start a 30-day free trial.
- Site24x7 (FREE TRIAL) As a cloud-based service, this platform uses artificial intelligence to automate monitoring tasks, uncover anomalies, and generate forward-looking operational insight. Get a 30-day free trial.
- ManageEngine Applications Manager (FREE TRIAL) An AIOps platform that offers full-stack visibility across your cloud and on-premises applications. Start a 30-day free trial.
- Dynatrace Application performance monitoring AI-engine, autodiscovery feature, dependency mapping, custom alerts, and more.
- AppDynamics Application performance management tool with AI-driven anomaly detection, relationship maps, automatic runtime protection, and more.
- Splunk Enterprise Infrastructure monitoring software with anomaly detection, predictive analytics, real-time alerts, reports, and more.
- Datadog Infrastructure monitor and application performance management tool with machine learning, anomaly detection, alerts, automated root-cause diagnostics, and more.
- PagerDuty Incident response platform with an automated response, real-time status updates, alerts, analytics, recommendations, and more.
- Instana Application performance management tool with automatic dependency discovering, trace analytics, anomaly detection, and more.
- Netreo Infrastructure monitoring software with autodiscovery, topology mapping, SNMP monitoring, alerts, automated root cause analysis, and more.
- New Relic One Service and application monitoring platform with dashboards, analytics, 300+ integrations, real-time alerts, and more.
- Logic Monitor Agentless infrastructure monitoring software with 2000+ integrations, anomaly detection, alerts, root cause analysis, and more.
The above list includes tools for Windows, macOS, and Linux. As part of our comparison, we’re going to examine tools that offer AI-driven anomaly detection, automated root cause analysis, and forecasting that can be used to proactively and efficiently manage security incidents or performance issues.
The Best AIOPs Platforms
1. ManageEngine OpManager Plus (FREE TRIAL)
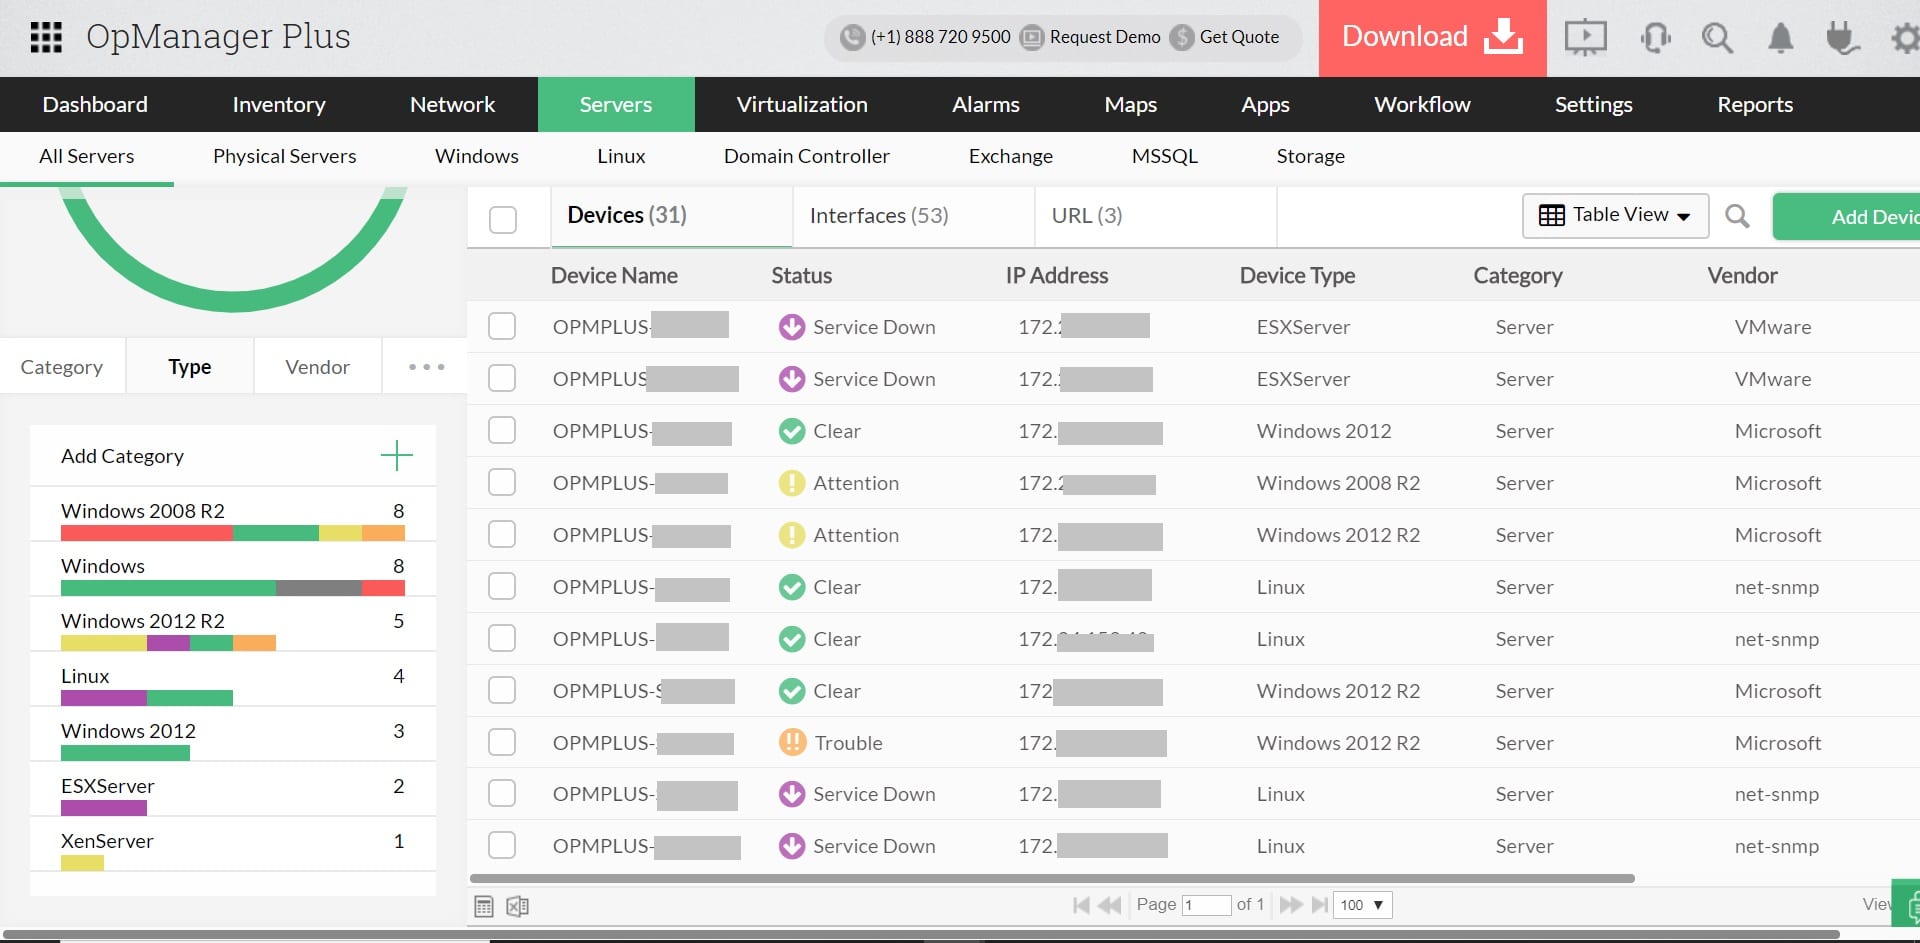
ManageEngine OpManager Plus is one of the best AIOps platforms available, offering advanced AI and ML-based algorithms to streamline a wide range of IT operations. Its AIOps functionalities start with efficient data gathering and noise reduction, filtering out irrelevant data to help IT teams manage alerts and detect incidents proactively. This significantly reduces the effort required by IT teams and increases overall efficiency. The platform’s AI and ML-based alerts enable automated threshold configuration, adapting to the environment’s behavior in real-time and ensuring critical performance metrics are closely monitored.
OpManager Plus excels in providing real-time notifications through seamless integrations with communication tools like Slack, Microsoft Teams, and Telegram, which helps reduce mean time to repair (MTTR) and minimizes network downtime. Its cross-domain correlation capabilities aggregate data, identify relationships, and provide a comprehensive overview, enabling IT teams to understand and address issues quickly. This functionality also improves event management and the analysis of key performance indicators. Root cause analysis tools in OpManager Plus allow IT teams to drill down to the underlying causes of issues, leading to faster remediation and reduced troubleshooting time.
The platform’s automated remediation and topology mapping features enhance network administration by visually representing the entire network infrastructure and automating predefined actions to resolve known issues quickly. Additionally, OpManager Plus offers improved capacity planning through ML-powered report forecasting, helping predict resource exhaustion and ensuring optimal resource utilization. The forecasted performance metrics provide trend lines based on historical data and current usage trends, allowing IT teams to foresee changes in performance metrics and take proactive measures.
Start by downloading a 30-day free trial.
EDITOR'S CHOICE
ManageEngine OpManager Plus is our top choice for an AIOps platform due to its advanced AI and ML-based capabilities that significantly enhance IT operations. Its data gathering and noise reduction features streamline the monitoring process, ensuring IT teams can focus on critical alerts without being overwhelmed by irrelevant data. The platform’s real-time notifications and seamless integrations with tools like Slack and Microsoft Teams enable rapid response to potential issues, reducing downtime and improving network reliability. OpManager Plus’s robust root cause analysis tools provide deep insights into network issues, allowing for quick and effective problem resolution. Additionally, the automated remediation and topology mapping features simplify network management, making it easy to visualize and address issues across the entire infrastructure. The predictive analytics for capacity planning and performance metrics ensure that organizations can proactively manage their resources, maintaining optimal performance and preventing future issues.
Download: Get a 30-day free trial
OS: Windows, Linux, Cloud-based
2. Site24x7 (FREE TRIAL)

Site24x7 brings artificial intelligence into IT operations so monitoring, detection, and issue handling can be automated. The platform applies machine learning to large volumes of operational data in order to recognize abnormal behavior and anticipate potential service disruptions before end users experience the impact. That proactive model helps IT teams intervene sooner, often before a developing issue turns into a critical incident, which reduces downtime and improves overall efficiency.
Key Features:
- Network discovery
- Predictive alerts
- Historical analysis
- Anomaly detection
Its AIOps functionality also extends to automated root cause analysis, which helps teams trace performance issues and bottlenecks back to their source across complex infrastructures. Site24x7 uses pattern recognition to connect events with metrics, allowing issues to be identified with greater speed and precision.
The platform also connects with other monitoring tools, giving teams a unified environment for overseeing cloud services and on-premises infrastructure together without burying them in excessive amounts of monitoring data.
Because the service is cloud based, it not only helps accelerate response times but also supports stronger stability and efficiency across IT environments as a whole. That makes it a useful option for organizations looking to apply AI-driven IT operations management. You can assess the platform with a 30-day free trial.
3. ManageEngine Applications Manager (FREE TRIAL)

ManageEngine Applications Manager is an enterprise-ready AIOps platform that leverages the power of AI-driven insights to identify potential issues and pinpoint their root cause. It combines data from web servers, application servers, virtual resources, public cloud services, and other sources, and analyzes them for insights.
Key Features:
- Agentless monitoring
- Unified views
- Extensive coverage
- Insightful reports and graphs
This platform uses AI to provide in-depth root cause analysis, so you can troubleshoot quickly and more effectively. In particular, we love its flexible alarm configurations that puts the focus on critical alerts. It even provides the contextual information associated with each alert.
Additionally, its out-of-the-box graphs and reports are also a big plus. These dashboards display information for easy understanding and at the same time, is comprehensive enough to help you get the bigger picture. Its trend analysis and planning graphs in particular are useful for decision makers.
The annual subscription for the Professional edition starts at $395 for 10 monitors and one user. The Enterprise edition starts at $3,995 for 100 monitors with one user. Start a 30-day free trial.
4. Dynatrace
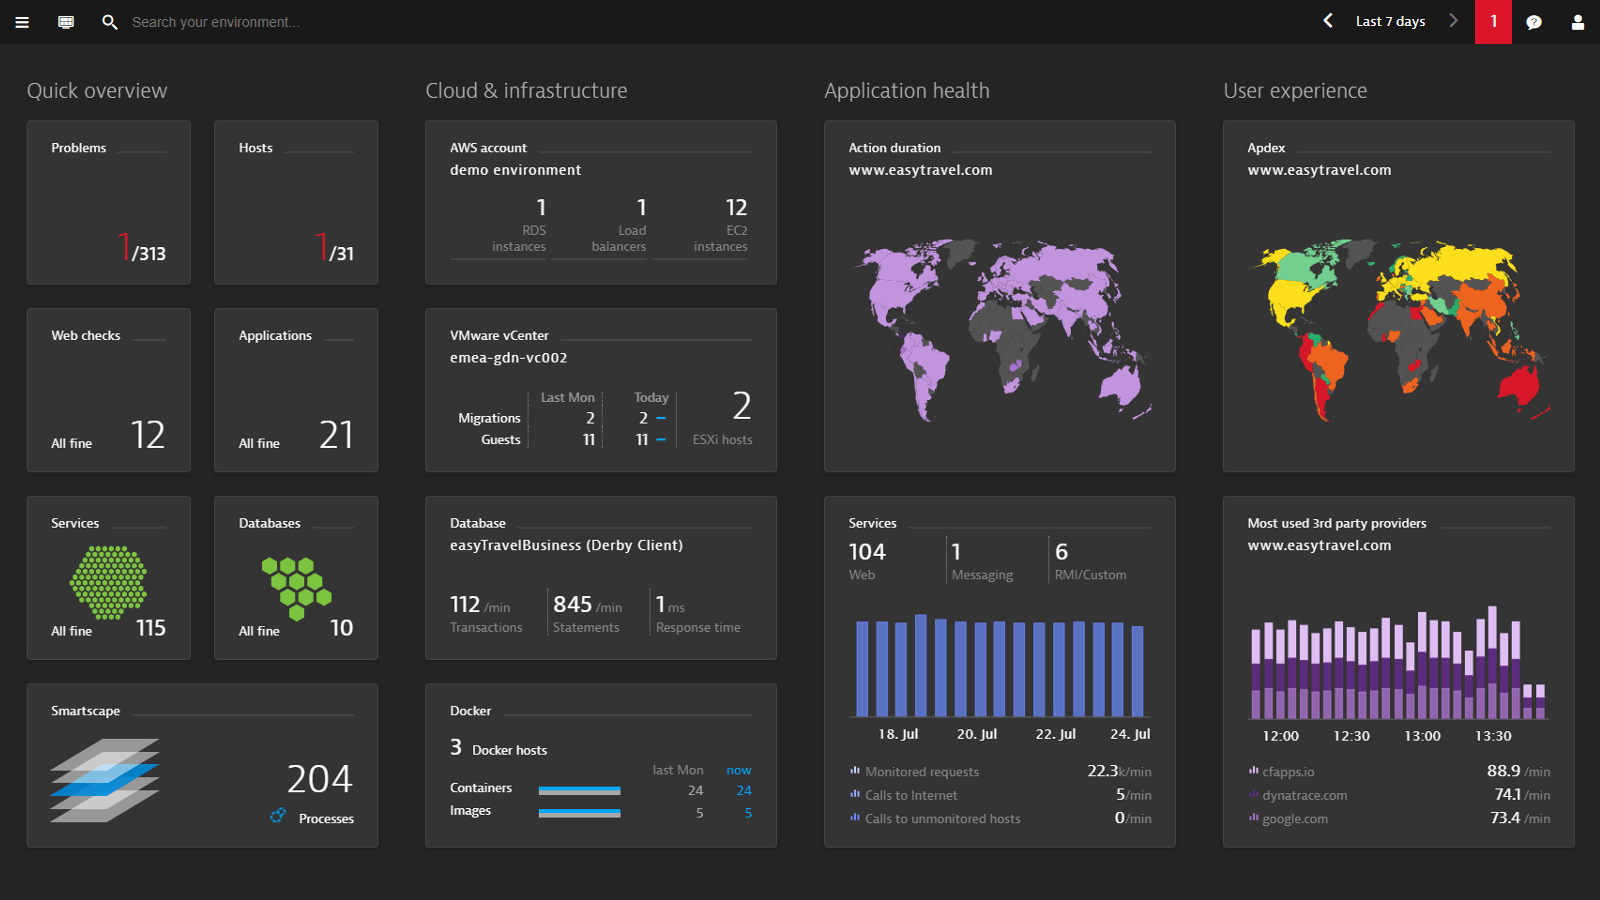
Dynatrace is an application performance monitoring solution that you can use to monitor application performance with an AI engine called Davis. The AI can automatically discover dependencies throughout your application stack and all them to a dependency map.
Key Features:
- Davis AI engine
- Autodiscovery
- Dependency map
- Custom alerts
The dependency map provides you with end-to-end visibility of your entire virtual environment so that you can see the relationships between every entity, enabling you to troubleshoot performance issues from a top-down perspective.
A custom alert system notifies you when performance metrics cross a predefined baseline threshold. Dynatrace establishes a baseline for the performance of services and creates notifications when there is abnormal activity. The AI can also assess whether the abnormal activity is false positive or indicative of a broader problem.
Dynatrace is an excellent choice for enterprises looking for an AI-powered application monitoring solution. It is available on Windows. The Full-stack monitoring package starts at $69 (£48.73) per month for 8GB per host. You can start the 15-day free trial via this link here.
5. AppDynamics
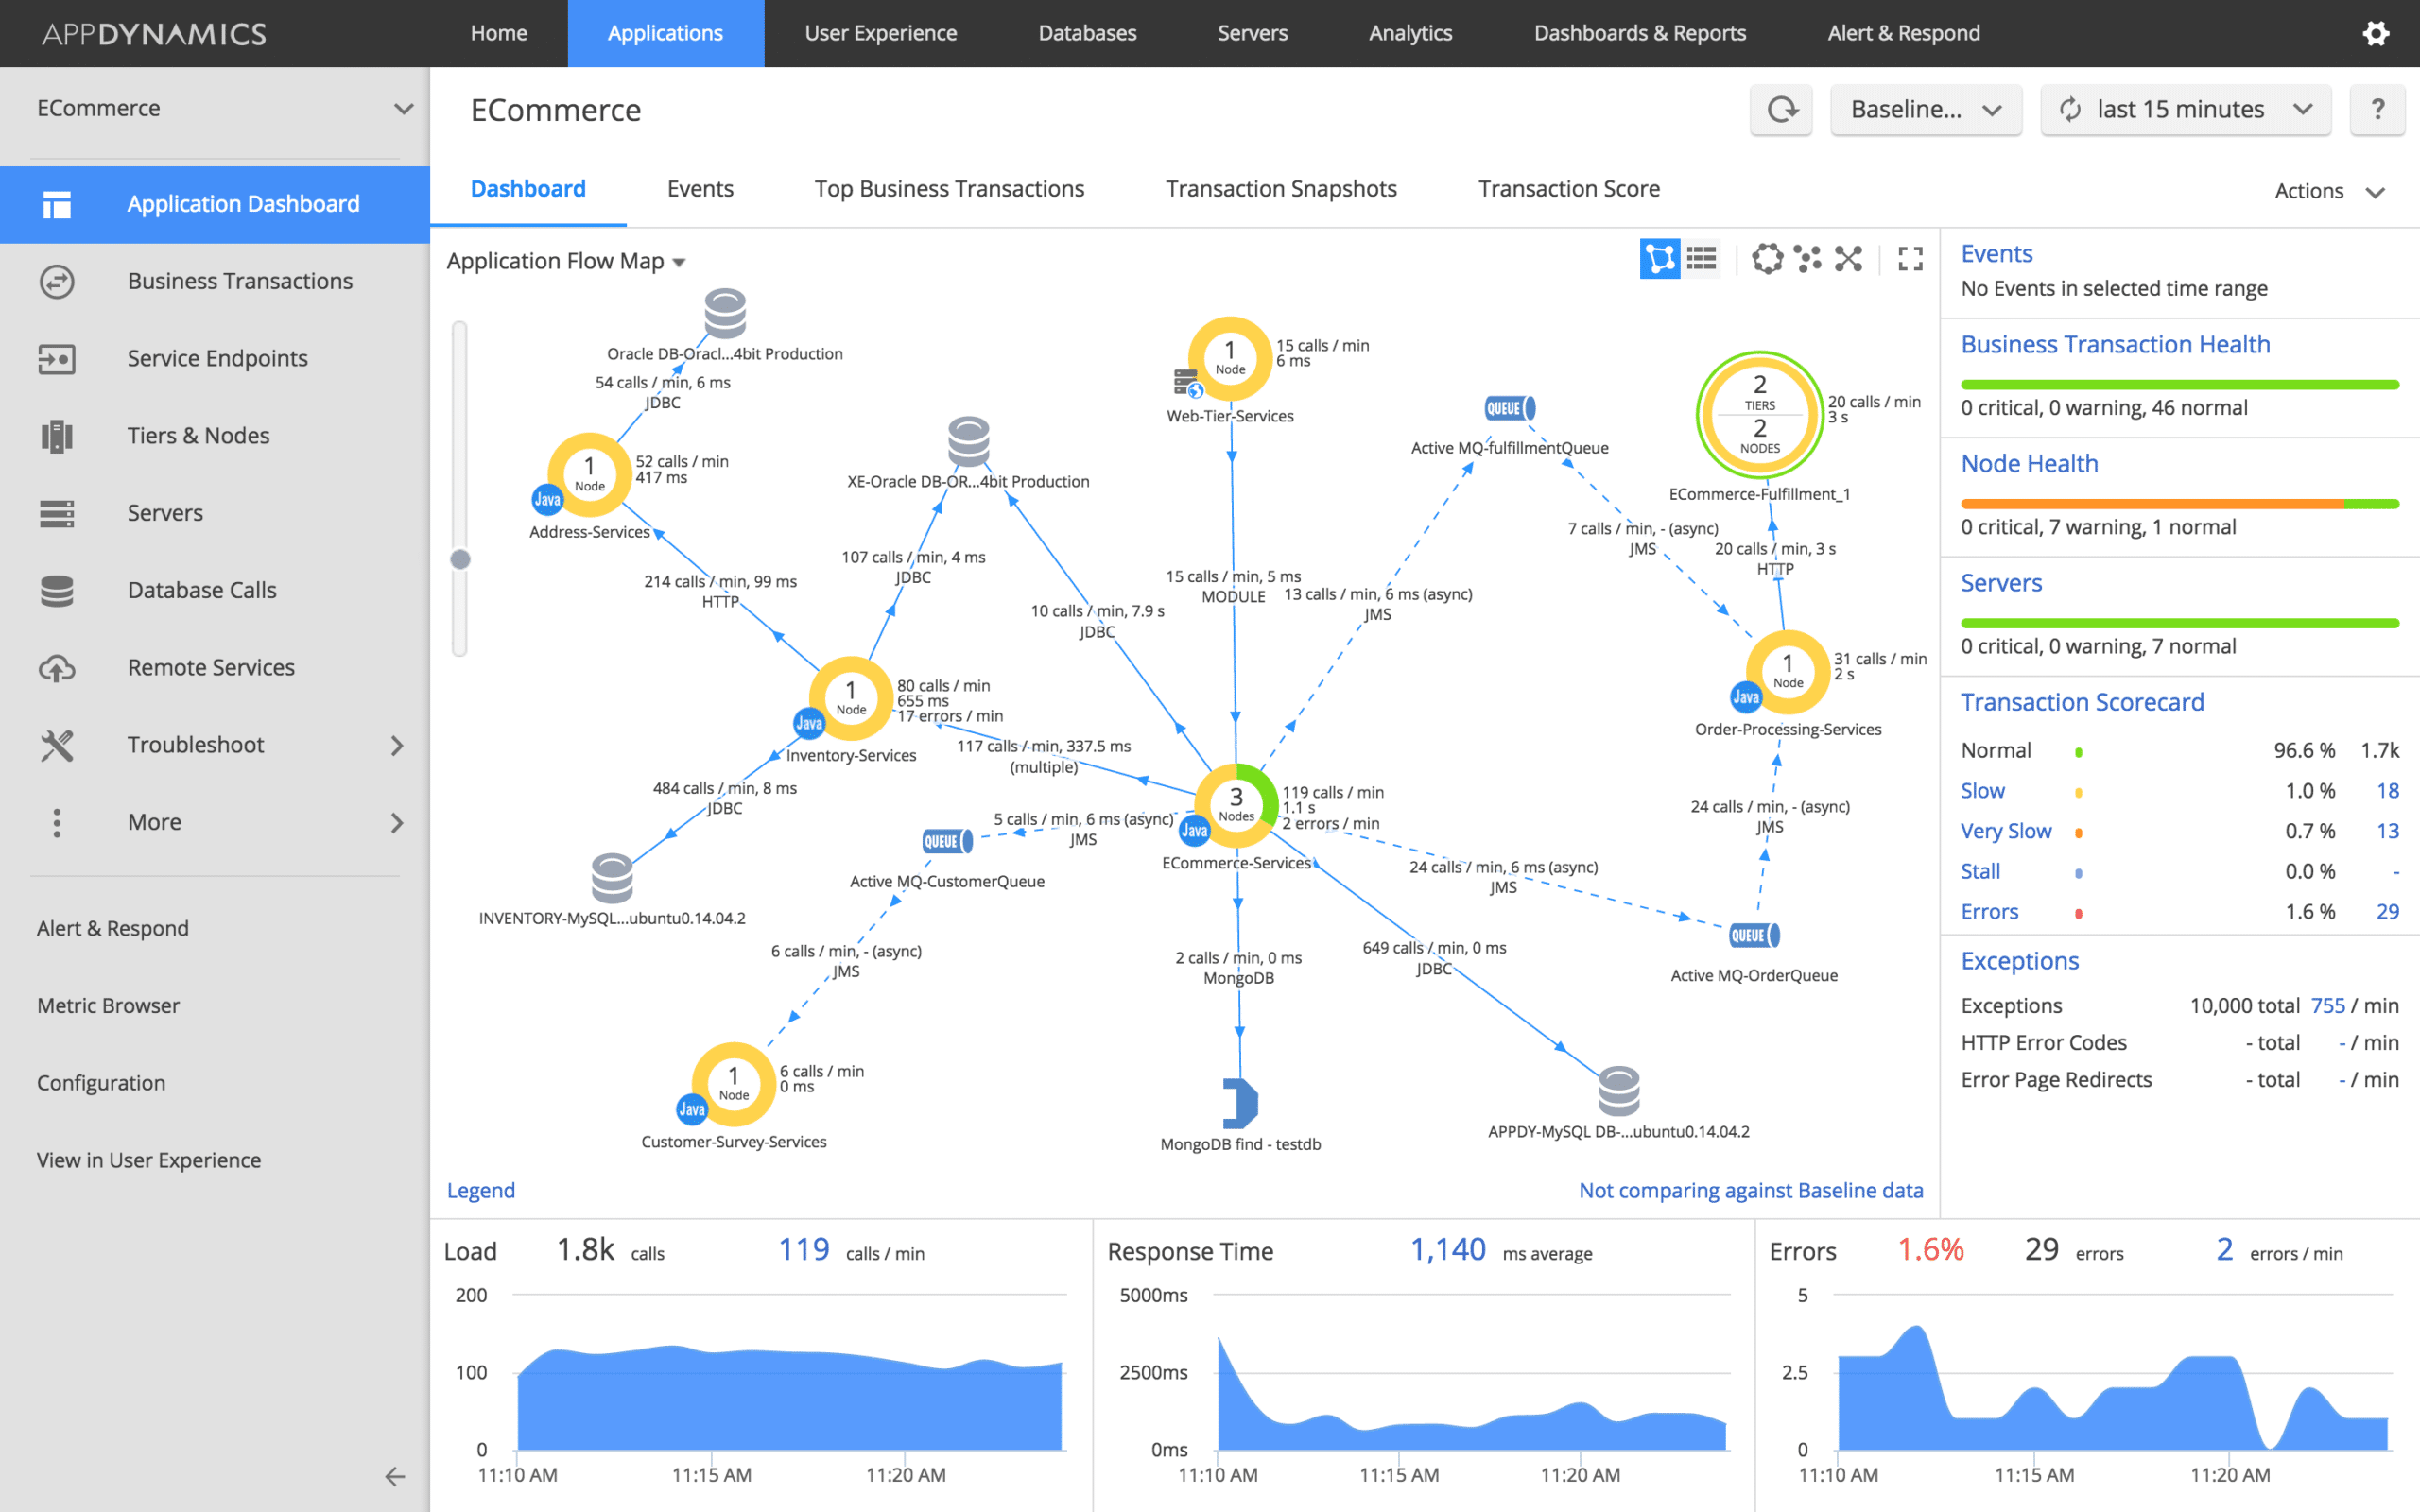
AppDynamics is an application performance management solution that provides an AI-driven performance monitoring experience. With AppDynamics, you can monitor the performance of applications in real-time, right down to code-level transactions.
Key Features:
- Real-time application monitoring
- Cognition engine
- Root-cause diagnostics
- Automatic runtime protection
- Dependency map
The platform comes with a cognition engine that uses machine learning to automatically detect performance anomalies and begin root cause diagnostics. The platform can also automatically map the relationships between application components and dependencies.
Automatic runtime protection enables the software to identify application code dependencies and configuration vulnerabilities and block them automatically. Highlighting these vulnerabilities gives you a heads-up on commonly overlooked vulnerabilities that malicious entities can use to steal your private information.
AppDynamics is a good fit for enterprises that require an application monitoring solution with automated root cause diagnostics. It is available on Windows and Linux. Pricing starts at $6 (£4.24) per month for the Infrastructure Monitoring Edition. You can start the 15-day free trial via this link here.
6. Splunk Enterprise
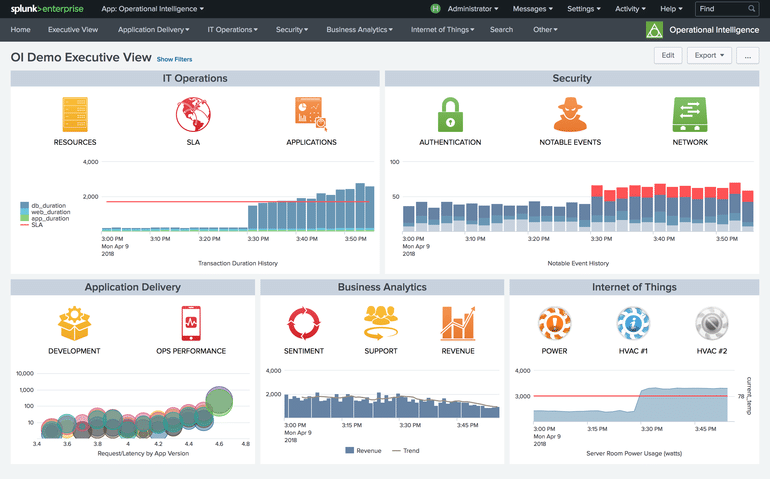
Splunk Enterprise is an infrastructure monitoring tool that you can use to monitor websites, applications, and devices. The platform comes with The Machine Learning Toolkit, which allows you to build machine learning models and use features like anomaly detection and predictive analytics to monitor your environment.
Key Features:
- Anomaly detection
- Predictive analytics
- Alerts
- Reports
Real-time alerts update you on changes to your environment, and automated alert actions automatically respond to alerts by sending emails and executing remediation scripts. Administrators can choose what alert actions are available to users.
You can extend the platform further by choosing from over 1000 apps and add-ons from Splunkbase, an app marketplace. Some of the applications you can deploy include the Cisco Networks App for Splunk Enterprise and the Splunk App for PCI Compliance.
Splunk Enterprise is one of the top AIOps platforms for enterprises that want to build their machine learning models and automate their network monitoring strategy. It is available on Windows, Linux, and macOS. You need to contact the company directly to view pricing information. You can download the program for free via this link here.
7. Datadog
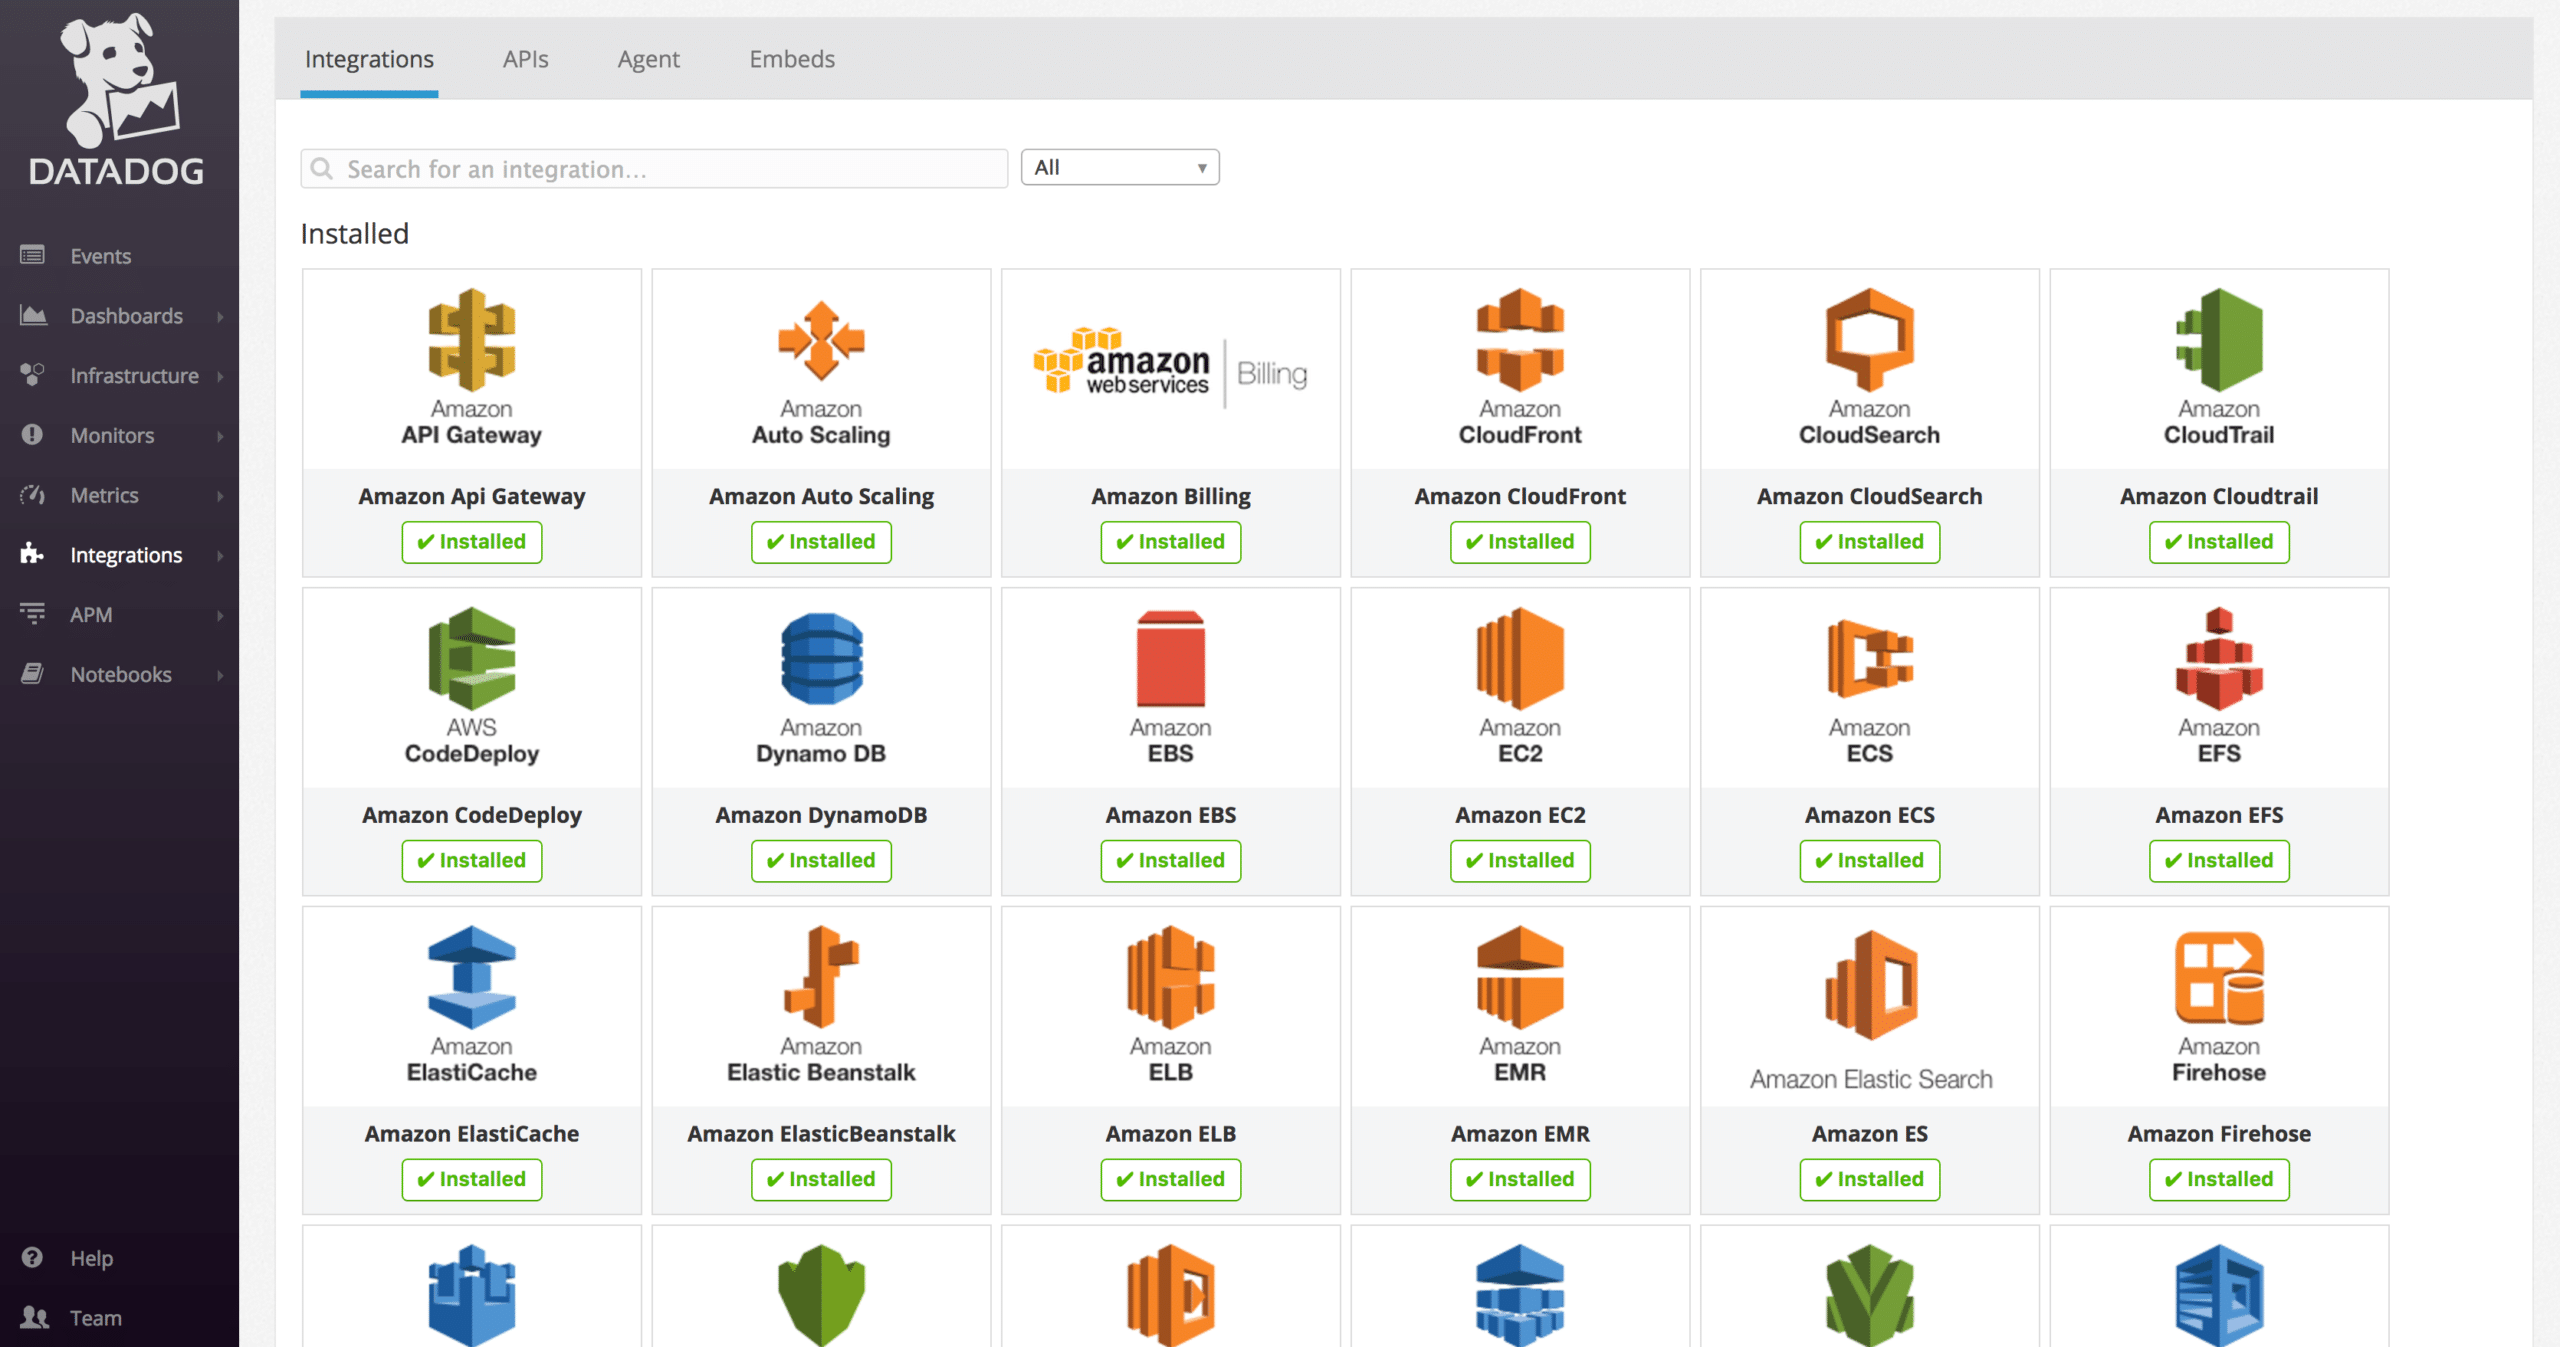
Datadog is an infrastructure monitoring and application performance management tool that provides end-to-end visibility of your entire IT environment. With Datadog, you can build real-time dashboards with visual displays like graphs and charts that can be broken down further by tags such as host or device.
Key Features:
- Custom dashboards
- Alerts
- Anomaly detection
- Root-cause diagnostics
- 600+ Vendor Integrations
The software uses machine learning to provide an anomaly detection system that automatically notifies you about anomalous activity and generates alerts. Alerts inform you about performance issues by channels such as email, PagerDuty, and Slack. You can set trigger conditions for alerts to determine what activity generates an alert.
Automated root-cause diagnostics then speed up the troubleshooting process. However, if you prefer a reactive approach, the software also predicts future bottlenecks and issue notifications in advance. For example, if you’re running low on disk space, the software can notify you weeks in advance so you can take action before there is any operational disruption.
Datadog is an excellent solution for enterprises that require a tool with simple but effective machine learning support. It is available on Windows, Linux, and macOS. Pricing starts at $15 (£10.59) per host per month. The free version also available that supports up to 5 hosts with 1-day metric retention. You can try it for free here.
8. PagerDuty
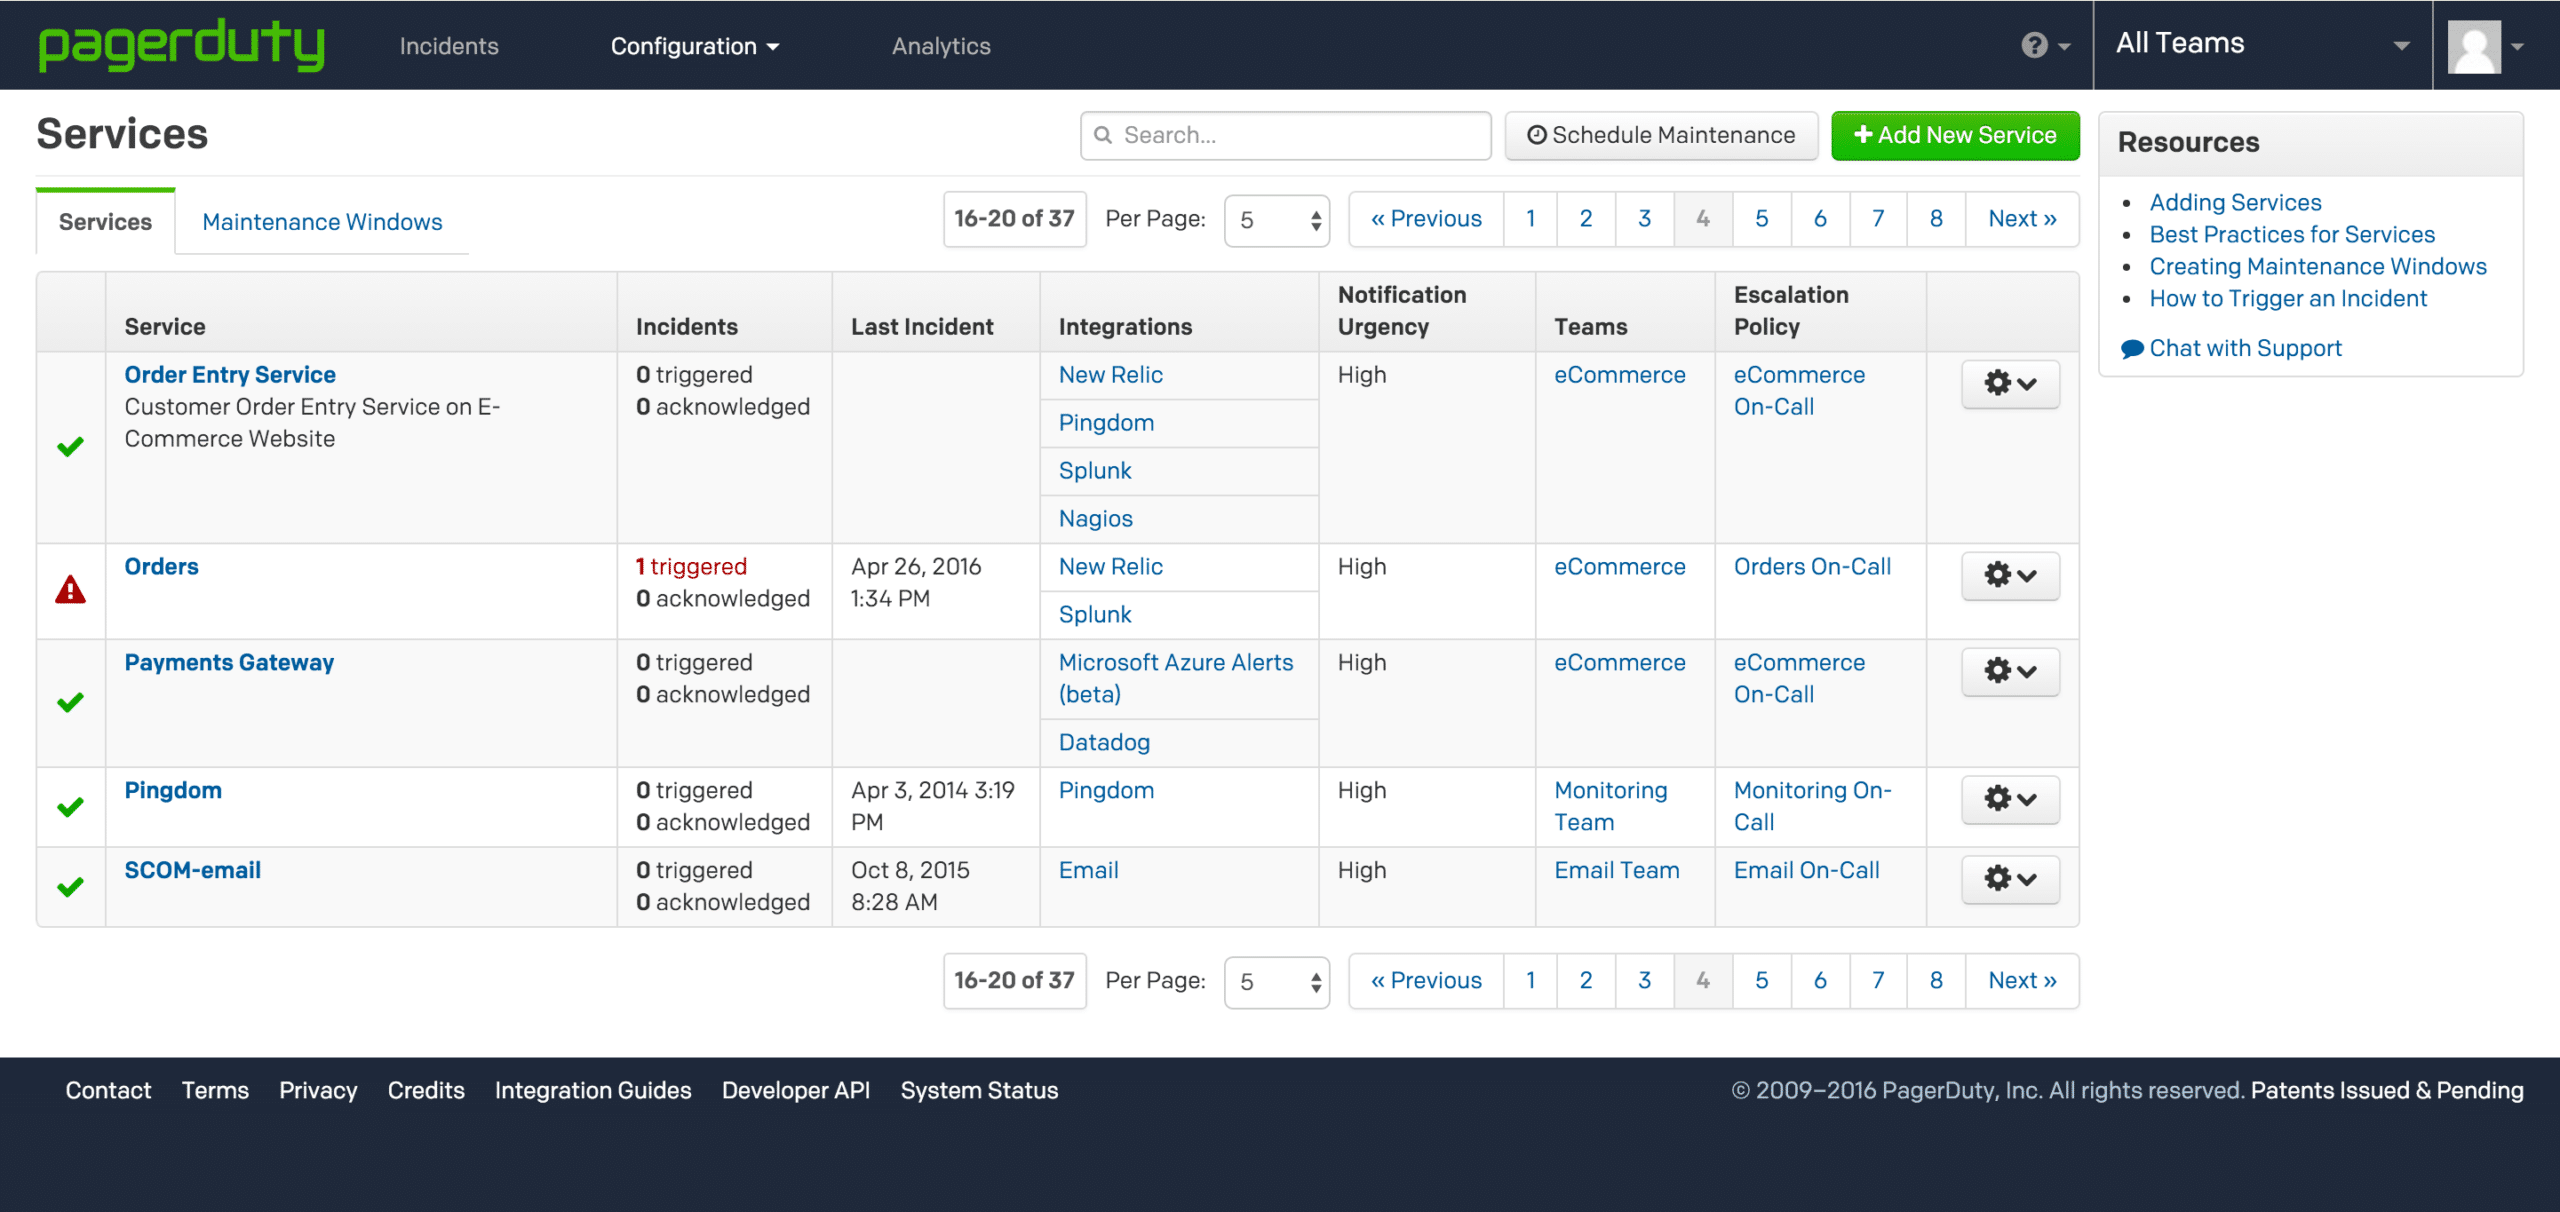
PagerDuty is an incident response platform that provides event intelligence and AIOps capabilities. With PagerDuty, you can automate your incident response process with response automation to deliver more effective incident remediation and real-time dependency monitoring to improve visibility.
Key Features:
- Live status updates
- Analytics
- Personalized performance recommendations
- 500+ integrations
A built-in machine learning feature helps make the incident management process simpler by automatically grouping alerts under single incidents so that you can see all the information related to a particular incident.
Analytics provide you with personalized recommendations to remediate performance issues and reduce the number of alerts your system generates. Analytics can integrate with Slack so that you can easily keep an eye on network performance while you’re working on other projects.
PagerDuty is suitable for organizations that need an automated tool for enhancing the incident response process. Free version available for up to three users per month. Paid versions start at $19 (£13.42) per user per month. It is available on Linux. You can start the 14-day free trial via this link here.
9. Instana

Instana is an application performance management tool you can use to monitor the performance of applications. Instana leverages AI to automatically discover and map application dependencies. Other features like filter-based analysis, distributed trace analytics, and open source tracing analytics also help augment the user’s monitoring experience.
Key Features:
- Application monitoring
- Websites end-user monitoring
- Autodiscovery
- Tracing analytics
- Anomaly detection
- Alerts
Web end-user monitoring enables you to monitor the user experience that visitors to your website are getting by tracing and correlating browser requests and identifying JavaScript errors. Web monitoring helps ensure that you deliver a solid user experience.
The AI also offers an anomaly detection function, which can automatically identify abnormal behavior, pinpoint events correlated to the root cause, and generate an alert for the user to follow up. This is useful because it provides you with more context that you can use to respond to performance issues and security incidents more effectively.
Instana is an excellent tool for enterprises looking for an application performance management tool that leverages AI. It is available as a SaaS service or self-hosted service on-premises or in the cloud. Pricing starts at $75 (£52.96) per host per month. You can sign up for the 14-day free trial via this link here.
10. Netreo

Netreo is an infrastructure monitoring platform that can automatically discover and map your infrastructure. Netreo supports monitoring SNMP devices and can monitor the CPU, memory, disk usage, disk I/O, network bandwidth, network errors, and round-trip latency of SNMP-enabled devices.
Key Features:
- SNMP monitoring
- Automatic network mapping
- Configuration management
- Automated root cause analysis
- Alerts
One of the most valuable features included with Netreo is configuration management which you can use to minimize vulnerabilities in your network. The context-aware configuration management feature can detect and alert you to changes to device configurations. You can also view configuration changes as part of a calendar or timeline.
Alerts notify you whenever a device or a set of devices begin experiencing performance issues and notifies you so that you can investigate. Preset alert thresholds for device performance provide automated monitoring support so that you monitor your network effectively out-of-the-box. Automated root cause analysis automatically identifies the cause of performance issues, saving you from having to waste time troubleshooting.
Netreo is a superb infrastructure monitoring tool for enterprises that require SNMP monitoring. It is available as a SaaS or on-premises deployment. Pricing starts at $5 (£3.53) per resource, per month up to 250 resources. You can request a demo via this link here.
11. New Relic One
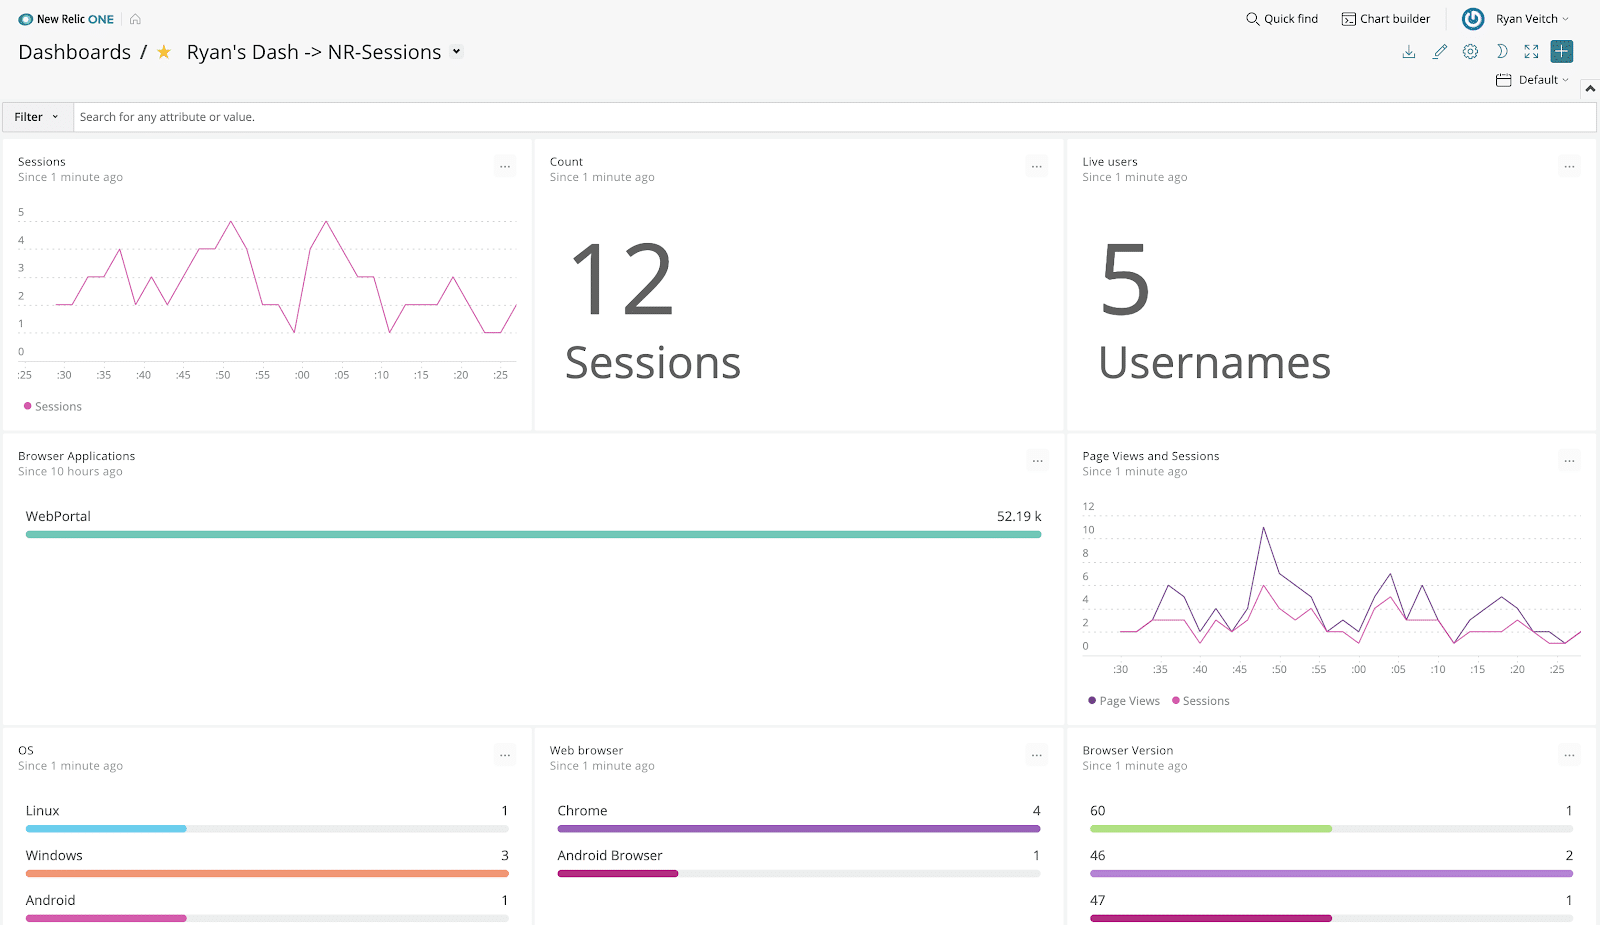
New Relic One is a service and application monitoring platform that allows you to monitor your entire virtual IT environment. With New Relic One, you can monitor your entire environment through the New Relic One and Grafana dashboards. Here you can monitor metrics, events, and logs taken from devices and services throughout your network. The dashboard comes packed with graphs and charts, making it easy to assess performance from a glance.
Key Features:
- Dashboard
- 300+ integrations
- Real-time alerts
- NRQL query language
The platform includes a query language called NRQL, which enables the user to generate analytics and charts. Data you can query includes APM events, browser monitoring events, mobile monitoring events, infrastructure events, synthetics events, and custom events.
There are also over 300 agents and integrations, including AWS, Terraform, Google Cloud, Apache, Azure, Cassandra, CentOS, Docker, Elasticsearch, IIS, Kubernetes, and more. Real-time notifications let you know about any problems with your infrastructure, allowing you to keep an eye on your entire IT environment.
New Relic One is one of the top AIOps platforms recommended for enterprises requiring a full-stack monitoring experience. It is available on Windows, Linux, and ARM. Free version available that supports one full user. The standard version includes one free full user, unlimited free basic users, and $99 (£69.91) per month per extra full user. You can sign up here.
12. LogicMonitor
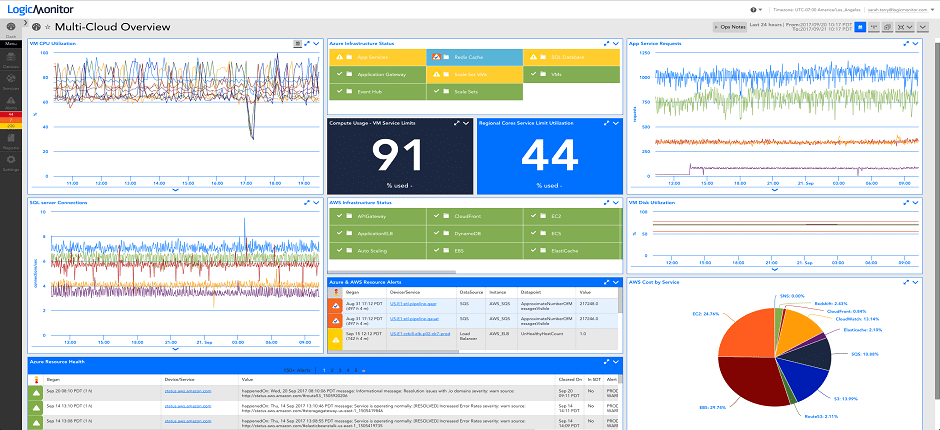
LogicMonitor is an agentless infrastructure monitoring tool that you can use to monitor your network, servers, containers, databases, storage and services with over 2000 integrations. AI Ops features like automated discovery and topology mapping allow you to monitor your network geographically.
Key Features:
- Topology mapping
- Root cause analysis
- Anomaly detection
- 2,000+ integrations
- ServiceNow CMDB integration
- Reports
The platform comes with an anomaly detection feature that produces alerts whenever it discovers anomalous performance parameters. There are also anomaly detection graphs highlighting baseline activity in blue and abnormal activity in red alongside a timeline. This allows you to see precisely when performance issues started.
LogicMonitor is a reliable infrastructure monitoring solution for those who desire a tool with plenty of automation options. Collector is available on Windows and Linux. To view pricing information for this product, you need to contact the company directly to request a quote. You can start the 14-day free trial via this link here.
The Best AIOps Platforms: Editor’s Choice
If you want to optimize the efficiency of your network monitoring, then AIOps platforms are one of the best ways to do this. A platform with a solid AI will help increase your threat detection and response capabilities while freeing up your employees to work on other tasks.
Tools like ManageEngine OpManager Plus are an excellent starting point for a streamlined monitoring experience with automated threat detection and root cause analysis. However, before purchasing any solution, we recommend you research and try out multiple platforms to ensure that you get a solution that’s right for your environment.