Unlike a regular SQL server, PostgreSQL comes with its own unique set of capabilities and challenges. This means you’ll want a monitoring tool that can specifically cater to PostgreSQL and all of its features.
Here’s our list of the best PostgreSQL monitoring tools:
- Site24x7 Infrastructure EDITOR’S CHOICE SaaS package from a cloud platform offers monitoring tools for servers, services, networks, and cloud platforms and it can be expanded by a plug-in for PostgreSQL monitoring. Access a 30-day free trial.
- Paessler PRTG Network Monitor (FREE TRIAL) Comes with a specific PostgreSQL sensor and is ideal for those who need additional monitoring. Start a 30-day free trial.
- ManageEngine Applications Manager (FREE TRIAL) Can manage and monitor multiple RDBMSs and servers. Start a 30-day free trial.
- ManageEngine OpManager Nexus (FREE TRIAL) End-to-end monitoring tool with deep visibility into the health, query performance, and resource usage of your PostgreSQL database and the critical business applications that run on it. Download a 30-day free trial.
- Datadog APM Best all-round PostgreSQL monitor with quick deployment and out-of-the-box insights.
- SolarWinds Database Performance Monitor Provides detailed monitoring and proactive automation.
- ClusterControl Available both as a free and paid tool.
The best PostgreSQL monitoring tools
1. Site24x7 Infrastructure (FREE TRIAL)
Site24x7 Infrastructure is a SaaS package from the Site24x7 cloud platform. It includes monitoring tools for networks, servers, services, and cloud systems. It can be expanded by plug-ins that add extra product monitoring capabilities and there is one of these available for Postgre Monitoring.
Key Features:
- Comprehensive PostgreSQL Monitoring: Monitors critical PostgreSQL metrics such as connections, backend processes, cache hit ratios, transactions, deadlocks, and more, ensuring complete visibility into database performance.
- Auto-Discovery of Instances: Automatically detects all PostgreSQL instances, enabling quick visualization and streamlined monitoring setup.
- Customizable Alerts: Provides highly configurable alerts to notify administrators of anomalies or performance issues, ensuring timely action.
- Integration with AppLogs: Seamlessly integrates with Site24x7 AppLogs for in-depth analysis of PostgreSQL logs, supporting proactive issue resolution and performance optimization.
- Intuitive Dashboard: Features an easy-to-navigate dashboard that simplifies monitoring, making it accessible for both novice and experienced teams.
Why do we recommend it?
Site24x7 Infrastructure is recommended for its comprehensive SaaS package, covering networks, servers, services, and cloud systems, with dedicated Postgres Monitoring capabilities. The tool’s extensibility through plug-ins provides flexibility to adapt to diverse monitoring needs. It offers centralized live reporting, summarizing data across multiple instances, and detailed graphs for individual Postgres instances, presenting key statistics. Site24x7 Infrastructure’s holistic approach, integrating Postgres Monitoring with server and network monitoring, enables swift root cause analysis of performance issues. The cloud-based console ensures accessibility from anywhere, with the option to create individual access accounts for enhanced security.
The tool can consolidate live reporting for all of your instances and it is able to provide a summary across sites. The console also supplies graphs for the performance of each individual Postgres instance. Examples of statistics that you get from the Site24x7 Postgres Monitoring system include active and idle user counts, cache activity and capacity utilization, buffer-related statistics, checkpoint and data recovery action impact, and committed transaction counts.
Other modules in the Infrastructure plan include server and network monitoring. These services work in parallel with the Postgres Monitoring service and report on any performance issues that arise. This provides instant root cause analysis if application performance starts to slow. The administrator will immediately see whether that problem is caused by the database, the server, or the network.
The console for the Infrastructure package is resident in the cloud and it can be accessed from anywhere through any standard Web browser. Administrators can create individual access accounts for technicians, which enhances system security by providing accountability. Site24x7 also offers an MSP plan, which enables the creation of sub-accounts to keep the data of clients separate.
Who is it recommended for?
Site24x7 Infrastructure is ideal for organizations seeking a versatile SaaS solution for comprehensive infrastructure monitoring, including dedicated Postgres Monitoring. Its plug-in extensibility caters to diverse monitoring requirements, allowing users to tailor the solution to their specific needs. The cloud-based console offers flexibility, enabling monitoring from any location through standard web browsers. The tool’s ability to create individual access accounts enhances security and accountability. The MSP plan is valuable for service providers, facilitating data segregation for clients through sub-accounts. Site24x7 Infrastructure provides a unified platform for efficient and informed administration, whether monitoring servers, networks, or Postgres instances.
Pros:
- Extensive Metric Coverage: Tracks a wide range of PostgreSQL performance metrics, offering a detailed view of database health and efficiency.
- Simplified Integration: Integrates seamlessly into PostgreSQL environments without requiring extensive setup or manual intervention.
- Proactive Issue Management: Customizable alerts and detailed reports ensure potential problems are addressed before they impact operations.
- Scalable for Diverse Environments: Adapts to the needs of small and large infrastructures, making it versatile for different organizational sizes.
- Detailed Reporting and Insights: Delivers comprehensive analytics and reports, aiding in capacity planning and long-term performance management.
Cons:
- Limited Custom Reporting: Some users may find the options for generating highly tailored reports to be less flexible than expected.
The price of the Infrastructure plan starts at $9 per month when paid annually. Site24x7 Infrastructure is available for a 30-day free trial.
EDITOR'S CHOICE
Site24x7 Infrastructure is our top pick for a PostgreSQL monitoring tool because it implements monitoring procedures to track activity within a database and also resource availability on the supporting server. This tool will identify the root cause of performance problems in your database, which might not actually have anything to do with the database instance itself. The delivery of results could be down to a network error or a shortage of resources on the server. The tool will show these causes immediately if performance issues arise with your database. The system focuses on database throughput and service utilization rather than the execution details of each query. The Site24x7 platform is also able to monitor other DBMSs, including SQL Server, MySQL, Oracle, and DB2. The service will raise an alert if a problem is detected in a database instance. These alerts can be forwarded to technicians by SMS, email, voice call, push notification, or RSS feed. Site24x7 offers packages that include bundles of monitoring tools for all levels of the service stack and you get network configuration management and log management as well.
Download: Get a 30-day free trial
Official Site: https://www.site24x7.com/signup.html?pack=44&l=en
OS: Cloud based
2. Paessler PRTG Network Monitor (FREE TRIAL)
Paessler PRTG is a well-known network monitoring tool that can be installed on a wide variety of applications and servers. What most people don’t know is that PRTG has specifically built-in sensors to monitor PostgreSQL databases.
Key Features:
- Comprehensive PostgreSQL Monitoring: Offers native sensors for PostgreSQL, enabling real-time monitoring of essential metrics such as query execution times, database size, and active connections. This facilitates prompt detection and resolution of performance issues.
- Customizable Queries: Users can define specific SQL queries to monitor particular aspects of their PostgreSQL databases, allowing for tailored monitoring that aligns with unique organizational needs.
- Alerting and Notifications: Provides configurable alerts that notify administrators of potential issues, such as slow queries or resource constraints, ensuring timely intervention to maintain optimal database performance.
- Historical Data Analysis: Stores historical monitoring data, enabling trend analysis and capacity planning to anticipate future resource requirements and prevent performance bottlenecks.
- Integration with Network Monitoring: Beyond database monitoring, PRTG integrates PostgreSQL oversight into broader network and infrastructure monitoring, offering a unified view of system health and performance.
Why do we recommend it?
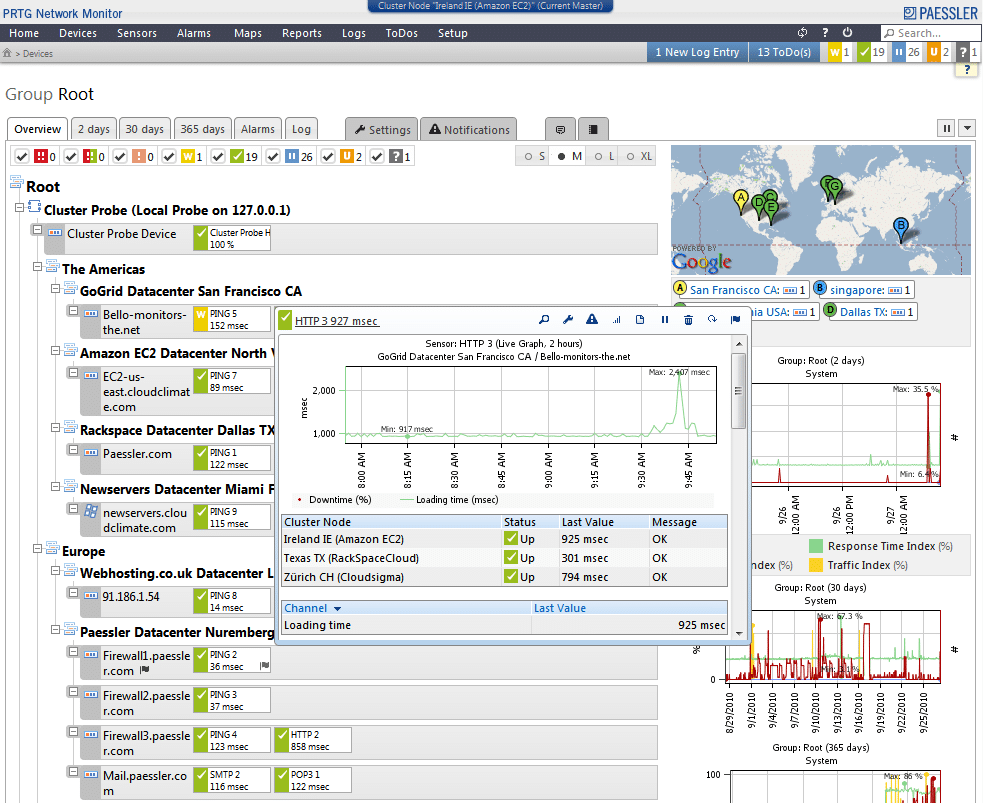
Paessler PRTG Network Monitor is recommended for its versatility as a comprehensive network monitoring tool that seamlessly integrates PostgreSQL database monitoring. It provides dedicated sensors specifically designed for PostgreSQL, offering detailed insights into execution time, connection activities, transactions, and query performance. The dashboard allows users to execute queries, view query-related information, and monitor server host metrics such as temperature, CPU usage, disk I/O, and uptime. PRTG’s customizable thresholds and alerting mechanisms, including automated scripts and notifications via email, SMS, or push notifications, enhance proactive issue detection. Its scalability and the option to expand monitoring scope to other applications and servers make it a robust choice for organizations anticipating future monitoring needs.
The sensor can measure the execution time on an entire request including details like connection buildup, disconnections, transactions handled, and query execution. Through the dashboard, you can run queries and view additional information such as the number of rows that were addressed by the query, as well as show defined values sorted by individual channels.
Server host metrics like temperature, CPU usage, disk I/O, and uptime are also captured and recorded by the PRTG sensor. You can easily set thresholds and conditions around these metrics to either execute an automated script or send out an alert. These alerts can be sent via email, SMS, or push notifications to both Android and iOS devices.
Just like Datadog, PRTG gives you the option to increase your scope of monitoring beyond just PostgreSQL. This makes PRTG an ideal choice if you think you’ll need an additional application or server monitoring down the road.
Who is it recommended for?
Paessler PRTG Network Monitor is recommended for organizations seeking a versatile network monitoring solution with dedicated PostgreSQL monitoring capabilities. Its PostgreSQL sensors cater to users monitoring database-specific metrics, while the broader application allows seamless expansion to monitor additional applications and servers. The customizable alerts and notifications make it suitable for proactive issue resolution, appealing to both small businesses and large enterprises. The pricing structure, based on the number of requests and sensors, ensures scalability, making it adaptable to the size and monitoring requirements of different organizations.
Pros:
- User-Friendly Interface: Intuitive dashboard simplifies the setup and management of PostgreSQL monitoring, making it accessible even for those with limited experience.
- Comprehensive Monitoring Capabilities: Ability to monitor various aspects of PostgreSQL databases, combined with its network monitoring features, provides a holistic view of the IT environment.
- Customizable Monitoring: The flexibility to create tailored SQL queries allows organizations to focus on metrics that are most relevant to their specific operational needs.
- Scalability: Designed to handle the monitoring needs of both small businesses and large enterprises, making it a versatile solution as organizational needs evolve.
- Proactive Issue Detection: The alerting system enables IT teams to address potential problems before they escalate, minimizing downtime and maintaining performance standards.
Cons:
- Cost Considerations: While PRTG offers a free version with limited sensors, scaling up to monitor extensive infrastructures may involve significant licensing costs.
Pricing for PRTG varies and is closely tied to how many requests a sensor receives, as well as how many sensors are deployed throughout an organization. Pricing for Paessler PRTG starts at $1600 (£1,284) for 500 sensors, but you can try out PRTG through a 30-day free trial.
3. ManageEngine Applications Manager (FREE TRIAL)
If it connects to a network, chances are ManageEngine Applications Manager can monitor it, and PostgreSQL servers are no exception. ManageEngine has been well-known in the app monitoring space for quite some time, and its experience in database management really shows in complex PostgreSQL environments.
Key Features:
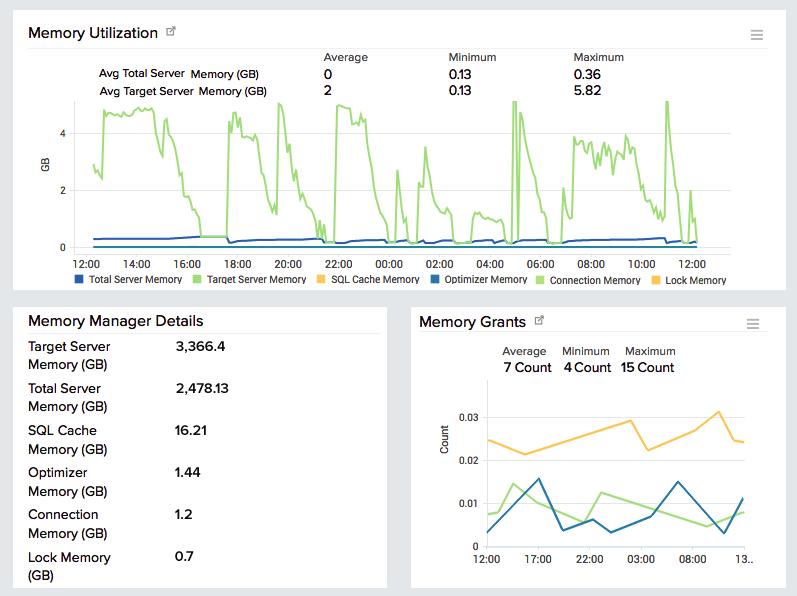
- Comprehensive PostgreSQL Monitoring: Provides real-time visibility into critical PostgreSQL performance metrics, including response time, query performance, session details, and database utilization, enabling proactive issue identification and resolution.
- Session Management: Monitors active sessions, identifying long-running or blocked queries, and provides insights into session statistics to help optimize database performance.
- Lock and Buffer Analysis: Tracks lock statistics and buffer usage, offering insights into potential performance degradation due to lock contention or inefficient buffer management.
- Disk and Index Monitoring: Keeps tabs on disk usage and index statistics, assisting in capacity planning and identifying unused or redundant indexes that may slow down data modification and backup processes.
- Customizable Alerts and Reporting: Allows setting thresholds for various performance metrics, triggering alerts for anomalies, and provides detailed reports for informed decision-making.
Why do we recommend it?
ManageEngine Applications Manager is recommended for its extensive monitoring capabilities, particularly in complex PostgreSQL environments. With a proven track record in application monitoring, ManageEngine leverages a customized PostgreSQL agent that efficiently gathers insights directly from the server. The platform excels in collecting raw data on resource utilization, cache hits, disk usage, and buffer statistics. What sets ManageEngine apart is its ability to generate an overall health report, offering a comprehensive view of the PostgreSQL database’s wellness. The platform’s adeptness in uncovering issues like idle locks enhances its troubleshooting capabilities, making it a reliable choice for organizations seeking effective PostgreSQL monitoring and performance management.
ManageEngine uses a customized PostgreSQL agent that installs directly on the server itself to pull insights into the dashboard. The installation of the agent only takes a few minutes, and as soon as it is completed data begins to populate your backend dashboard.
On the surface, ManageEngine collects raw data such as resource utilization, cache hits, disk usage, and buffer statistics, but it also goes a step further. The platform takes this information and creates an overall health report that scores the overall wellness of the PostgreSQL database. ManageEngine reads between the lines by uncovering issues like idle locks, which are the true cause of long wait times and slow queries.
As complex databases change over time, keeping a pulse on your overall performance can be difficult. To help aid in the long-term tracking of your PostgreSQL health, ManageEngine comes with the option to set dynamic performance baselines. These baselines keep in proportion with your traffic and allow the system to detect anomalous behavior.
Who is it recommended for?
ManageEngine Applications Manager is recommended for organizations dealing with complex PostgreSQL environments and seeking a robust solution for comprehensive monitoring. It caters to users looking to monitor various aspects, including resource utilization, cache hits, and disk usage, in PostgreSQL servers. The platform’s ability to detect and address issues such as idle locks makes it suitable for businesses prioritizing efficient troubleshooting and performance optimization. Additionally, the option to set dynamic performance baselines positions ManageEngine as an ideal choice for organizations aiming to track PostgreSQL health over the long term and identify gradual performance degradation.
Pros:
- Agentless Monitoring: Enables monitoring without the need for additional agents, simplifying deployment and reducing overhead.
- User-Friendly Interface: Features an intuitive dashboard that consolidates key performance indicators, facilitating easy monitoring and management.
- Scalability: Supports monitoring of multiple PostgreSQL instances, making it suitable for organizations of varying sizes.
- Integration Capabilities: Offers integration with other ManageEngine products and third-party tools, enhancing overall IT infrastructure monitoring.
- Cost-Effective: Provides a comprehensive set of features at a competitive price point, delivering value for investment.
Cons:
- Customization Complexity: Advanced customization and integration may require technical expertise, posing challenges for users without a technical background.
This feature is especially useful for identifying long-term gradual performance degradation. You can test-drive the full version of ManageEngine Applications Manager with a 30-day free trial.
4. ManageEngine OpManager Nexus (FREE TRIAL)
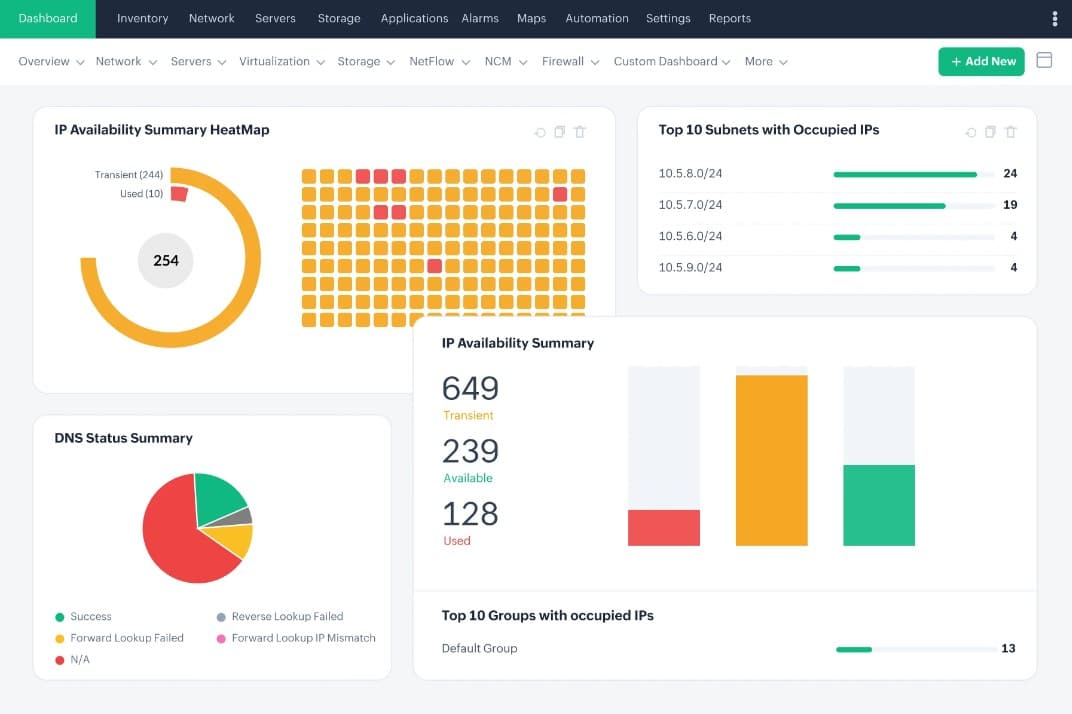
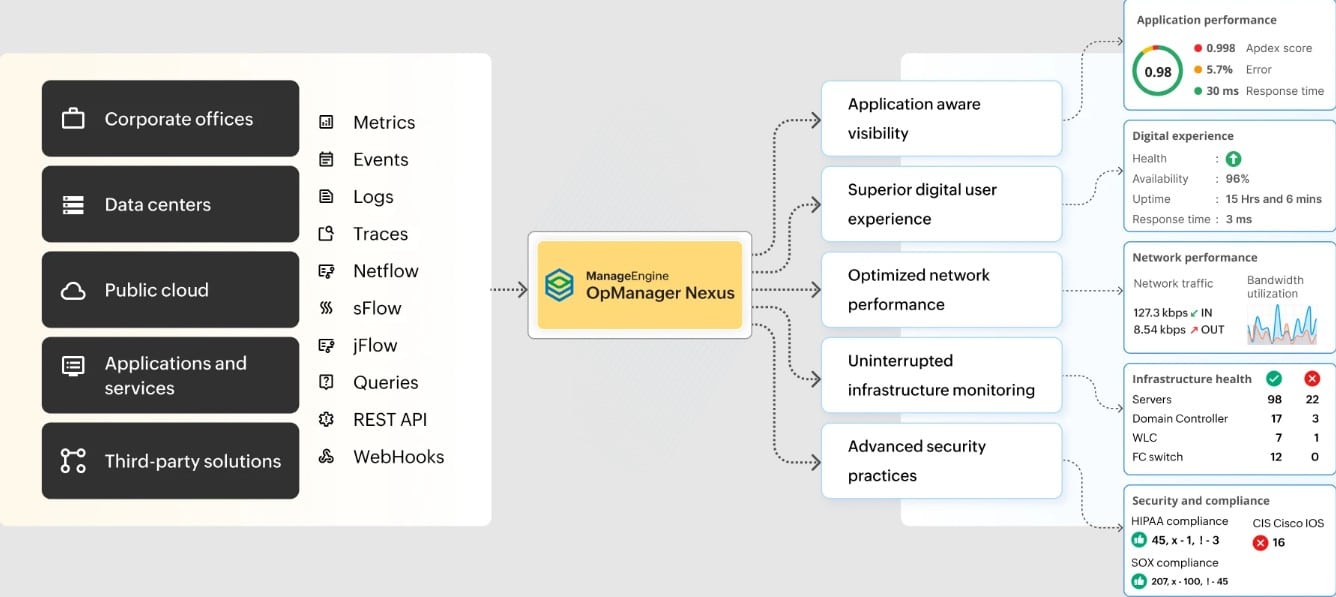
ManageEngine OpManager Nexus, formerly OpManager Plus, is a good choice for PostgreSQL databases as it can monitor query performance and resource utilizations through a single pane. Its ability to provide deep visibility into key database metrics, like connections, I/O speed, and memory, helps detect issues early on.
Key Features:
- Slow Queries: Analyzes execution times and database objects to Identify slow queries.
- Issue Tracking: Tracks replication latency, errors, response time per transaction, and speed of database calls to identify and track issues.
- Thresholds: Enables you to set static and dynamic thresholds to monitor workloads.
- Intuitive Dashboards: Comes with intuitive dashboards and reports for easy understanding of metrics.
- Out-of-the-box Scripts: Offers out-of-the-box scripts that can make it easy to start monitoring right away,
Why do we recommend it?
OpManager Nexus is a good choice for monitoring PostgreSQL databases for many reasons. Firstly, it can monitor thousands of database instances without any deployment overhead, making it ideal for large enterprises. It can even automatically discover new instances and start monitoring them without requiring any manual configuration.
Another standout aspect is that OpManager Nexus monitors a wide range of related metrics to give you accurate insights about the database issues. It can identify issues and their root causes accurately, and even back it up with automated remediation workflows. Its ML-based forecasts come in handy as well.
Who is it recommended for?
It is recommended for organizations with multiple PostgreSQL instances. Also, a good choice for database administrators.
Pros:
- Extensive Coverage: Monitors a wide range of metrics to cover almost every aspect of your database.
- Visualization: Generates dashboards and reports that make it easy to understand.
- Remediation: Provides workflows to automate remediation and trigger specific actions.
- Alerts: Sends alerts through multiple channels.
- Issue identification: Correlates data to identify multiple issues.
Cons:
- Learning Curve: Some users may face a learning curve.
When it comes to costs, the Professional edition starts at $1,233 for 50 devices, while the Enterprise edition starts at $19,995 for 1000 devices. Start a 30-day free trial.
5. Datadog APM

Datadog APM has been growing rapidly over the years and is becoming known for its easy-to-use interfaces and extensive reporting capabilities. While Datadog can support the monitoring of many applications, it’s one of the only few platforms that have a dedicated PostgreSQL integration that supports PostgreSQL queries.
Key Features:
- Comprehensive PostgreSQL Monitoring: Integrates seamlessly with PostgreSQL, providing real-time visibility into query performance, latency, throughput, and error rates. This integration enables precise identification of performance bottlenecks and inefficiencies within your database operations.
- End-to-End Tracing: Offers distributed tracing capabilities that follow requests across your entire stack, including PostgreSQL queries, allowing for a holistic view of application performance and facilitating rapid root-cause analysis.
- Customizable Dashboards and Alerts: Enables the creation of tailored dashboards to monitor key PostgreSQL metrics and set up alerts for specific thresholds, ensuring timely awareness and response to potential issues.
- Seamless Integration with Datadog Ecosystem: Integrates PostgreSQL monitoring with other Datadog services, such as infrastructure monitoring and log management, providing a unified platform for comprehensive observability.
- AI-Powered Anomaly Detection: Utilizes machine-learning algorithms to detect anomalies in PostgreSQL performance metrics, proactively identifying issues before they impact end-users.
Why do we recommend it?
Datadog APM stands out for its rapid growth, user-friendly interfaces, and extensive reporting capabilities. Notable for supporting the monitoring of various applications, Datadog APM takes the lead by offering a dedicated integration for PostgreSQL queries. Upon agent installation and permission assignment, users can seamlessly monitor the health and performance of their databases. Datadog’s out-of-the-box PostgreSQL screen board provides default metrics, showcasing critical information such as locks, replication delays, and specific PostgreSQL query results. The inclusion of code-level performance with distributed tracing further enhances insights, with auto-instrumentation expediting trace collection from recognized frameworks and libraries. The platform’s flexibility in configuring custom alerts, covering error rate, throughput, and latency, contributes to its status as a comprehensive solution for PostgreSQL monitoring.
After installing the agent and assigning the necessary permissions you can begin monitoring the health and performance of your database. By default, all of your metrics come prepopulated in an out-of-the-box PostgreSQL screen board. This page displays locks, replication delays, or the result of any PostgreSQL query you want to view.
To get even further insights into your PostgreSQL environments, code-level performance with distributed tracing can be charted and monitored through the Datadog APM. This APM is bundled with the same agent for installation earlier and is fairly simple to set up.
Datadog uses auto-instrumentation which helps speed up the trace collection process from well-known frameworks and libraries. If you want to use custom traces you can easily tag parts of your own code so you can follow the path of each and every request.

Managing integrations through a simple app-like dashboard.
Setting up PostgreSQL alerts in Datadog is quick and intuitive. Multiple alerts can be configured and then toggled on or off depending on your needs. Default service alerts include error rate, throughput, and latency monitoring, but can be completely customized around any service of query you’d like.
Automated alerts help put you in a proactive state to identify issues before they become company-wide hassles. You can configure alerts to notify you if a certain amount of dead rows have accumulated, or if replication delay increases beyond a certain threshold.
If you have a team working in your PostgreSQL environment you can route specific alerts to certain team members or groups depending on if it’s maintenance related, emergency-related, or informational.
Who is it recommended for?
Datadog APM is recommended for organizations seeking a dynamic and user-friendly solution for PostgreSQL monitoring. With its extensive reporting capabilities and dedicated PostgreSQL integration, Datadog APM caters to users looking for detailed insights into database health and performance. The platform’s adaptability to auto-instrumentation for trace collection and customizable alerts makes it suitable for diverse PostgreSQL environments. Whether monitoring error rates, throughput, or latency, Datadog APM offers flexibility, making it an ideal choice for proactive identification of issues and efficient alert management. This recommendation extends to teams collaborating in PostgreSQL environments, where customized alerts can be routed to specific members or groups based on the nature of the notification.
Pros:
- Holistic Observability: Combines application performance monitoring with database insights, offering a complete view of system health and performance.
- Scalability: Designed to handle monitoring needs from small-scale applications to large, complex infrastructures, adapting to organizational growth.
- User-Friendly Interface: Features intuitive dashboards and visualization tools that simplify the monitoring and analysis of PostgreSQL performance data.
- Proactive Issue Detection: AI-driven anomaly detection helps in identifying and addressing potential problems before they escalate, maintaining system reliability.
- Extensive Integration Capabilities: Supports a wide range of integrations beyond PostgreSQL, allowing for consolidated monitoring across various services and platforms.
Cons:
- Learning Curve: The extensive feature set may present a learning curve for new users, necessitating training to fully leverage the platform’s capabilities.
The platform also streamlines your monitoring efforts. If you ever decide there are other applications you want to monitor, Datadog likely has an agent for it. You can test out Datadog to start monitoring your PostgreSQL through a 14-day free trial.
6. SolarWinds Database Performance Monitor
SolarWinds Database Performance Monitor (DPM) is a SaaS tool designed to help you monitor virtually any database, including PostgreSQL. Since DPM lives in the cloud, there are no components to update and no central server that needs configuration.
Key Features:
- Comprehensive Monitoring: Provides real-time visibility into database performance metrics, including query execution times, wait events, and resource utilization, enabling proactive issue identification and resolution.
- Anomaly Detection: Utilizes machine learning algorithms to detect unusual patterns in database behavior, allowing for early detection of potential performance issues.
- Cross-Platform Support: Supports monitoring of various database platforms, including MySQL, PostgreSQL, Amazon Aurora, MongoDB, and Redis, offering flexibility across diverse environments.
- Customizable Dashboards: Offers intuitive dashboards that can be tailored to display key performance indicators relevant to specific organizational needs, enhancing monitoring efficiency.
- Alerting and Reporting: Provides configurable alerts and detailed reports, facilitating timely responses to performance deviations and informed decision-making.
Why do we recommend it?
SolarWinds Database Performance Monitor (DPM) secures a notable position on our list due to its efficiency as a cloud-based SaaS tool for comprehensive database monitoring, including robust support for PostgreSQL. Its cloud-native architecture eliminates the need for cumbersome updates or intricate central server configurations, streamlining the deployment process. The installation of the data collector is swift, allowing for both manual and script-based deployment, while the agent employs auto-discovery mechanisms to identify all databases and networked resources efficiently. DPM’s commitment to security is evident through its utilization of both in-flight and at-rest encryption for data transmission between the agent and the dashboard, ensuring minimal intrusiveness with optimal operational security. With its ability to detect and automatically address issues such as throughput, high latency, file locks, and index utilization, DPM provides a user-friendly dashboard that facilitates seamless toggling between global and granular views of queries and tables. The platform’s extensive set of analysis tools, including queuing theory and regression analysis, empowers users to gain deep insights into the relationships between hardware resources and specific queries.
Getting the data collector installed only takes a few minutes and can be deployed either manually, or en masse via a script. Once deployed, the agent is designed to auto-discover all databases and networked resources by utilizing traffic monitoring and system view inspections.
All data that moves between the agent and your dashboard uses both in-flight and at-rest encryption to ensure the least amount of intrusiveness while maintaining the best possible operational security.
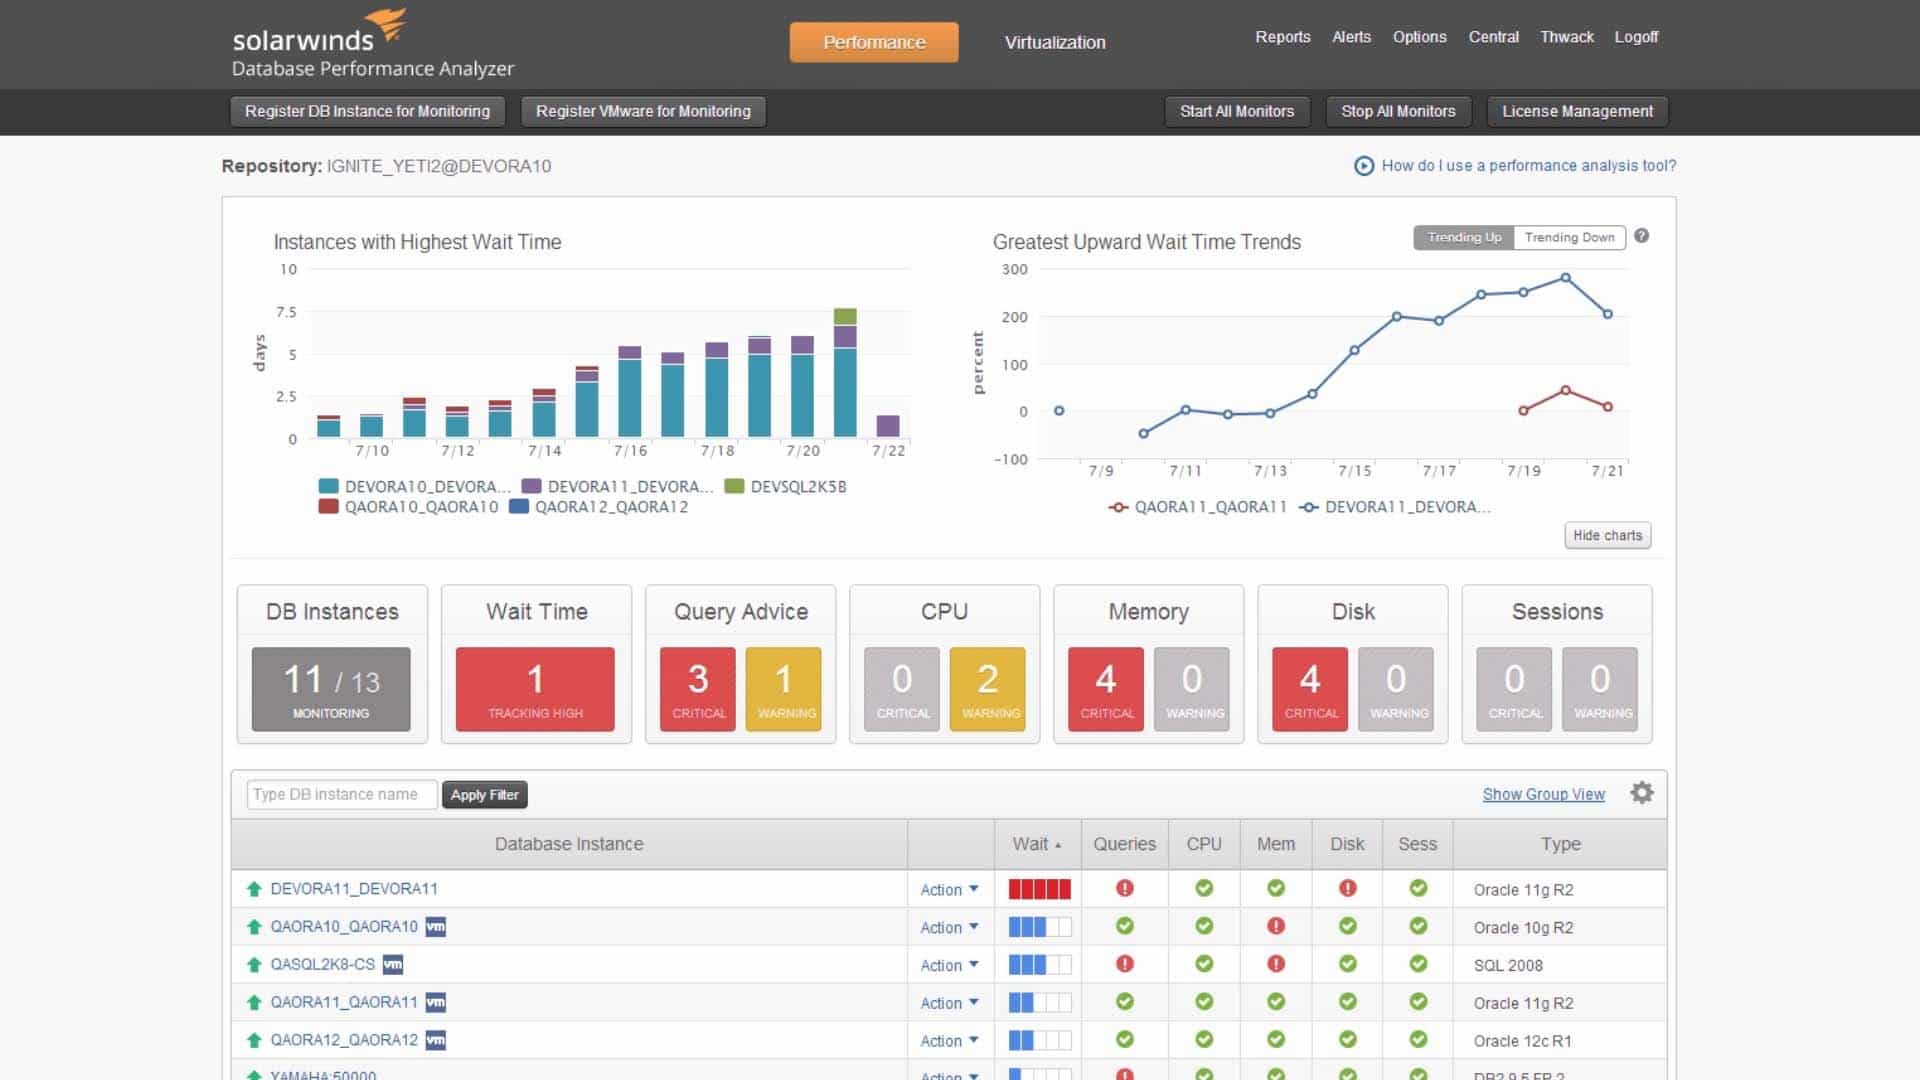
Issues such as throughput, high latency, file locks, and index utilization can all be detected and even automatically fixed through the DPM platform. Through a simple dashboard, you can toggle from a global view to a line-by-line code view of your queries and tables in just a few clicks.
DPM has a broad set of analysis tools that give you the flexibility to get as granular as you need to be. SolarWinds DPM can also classify and monitor multi-dimensional data on processes, users, databases, and queries, on top of tracking resource consumption such as CPU and disk usage.
Who is it recommended for?
SolarWinds Database Performance Monitor is highly recommended for organizations seeking a cloud-native, SaaS-based solution for PostgreSQL monitoring. Its streamlined deployment process and auto-discovery capabilities make it suitable for users looking for a hassle-free setup. DPM’s commitment to security, evidenced by robust encryption measures, makes it an ideal choice for businesses prioritizing data protection. The platform’s comprehensive analysis tools and user-friendly dashboard cater to a broad spectrum of users, from those requiring a global view to those delving into granular details of queries and tables. Whether you are managing databases, monitoring resource consumption, or conducting in-depth analysis using advanced techniques, SolarWinds DPM offers flexibility and efficiency.
Pros:
- User-Friendly Interface: Features an intuitive and easy-to-understand interface, making it accessible for users with varying levels of expertise.
- Real-Time Analysis: Offers real-time analysis capabilities, allowing for prompt identification and resolution of performance issues.
- Broad Database Support: Supports a wide range of database systems, enabling centralized monitoring across heterogeneous environments.
- Scalability: Designed to handle monitoring needs from small-scale applications to large, complex infrastructures, adapting to organizational growth.
- Proactive Issue Detection: Machine learning-based anomaly detection helps in identifying and addressing potential problems before they escalate, maintaining system reliability.
Cons:
- Cost Considerations: Comprehensive features and scalability come at a higher price point, which may be a consideration for smaller organizations with limited budgets.
Advanced analysis techniques like queuing theory and regression analysis can be applied to data right from the reporting dashboard to provide deep insights into the relationships between hardware resources and specific queries. You can test out SolarWinds Database Performance Monitor completely free through a 14-day trial.
7. ClusterControl for PostgreSQL
Last on our list is ClusterControl, which combines PostgreSQL database monitoring with deployment automation. If you find yourself deploying multiple instances of PostgreSQL databases, ClusterControl can automatically deploy and configure these for you on the fly.
Key Features:
- Automated Deployment and Provisioning: Simplifies the setup and configuration of database clusters, reducing manual effort and minimizing errors.
- Real-Time Monitoring and Alerting: Provides intuitive dashboards for monitoring database performance, with customizable alerts to notify administrators of potential issues.
- Backup and Recovery: Offers robust backup management, including scheduled backups and point-in-time recovery, ensuring data integrity and business continuity.
- Performance Optimization: Includes tools for analyzing and tuning performance, helping to identify and resolve bottlenecks for improved database efficiency.
- Security and Compliance: Features access control and encryption to protect data and ensure compliance with industry regulations.
Why do we recommend it?
ClusterControl stands out as a comprehensive solution that seamlessly integrates PostgreSQL database monitoring with deployment automation. Particularly advantageous for organizations managing multiple instances of PostgreSQL databases, ClusterControl streamlines the process by automating deployment and configuration tasks. The tool’s automatic configuration relies on an interactive wizard, ensuring a thorough setup of all parameters before initiating deployment. A unified dashboard provides a centralized view of the activity and status of all database instances, simplifying monitoring tasks. ClusterControl goes beyond conventional metrics, incorporating full database life-cycle management into its platform. Preconfigured report tabs offer quick insights into essential aspects like largest databases, top queries, alarms, and database growth, eliminating the need for manual dashboard creation or queries.
The automatic configuration works by setting up your template through an interactive wizard. This step-by-step process ensures that all settings are covered before deployment.
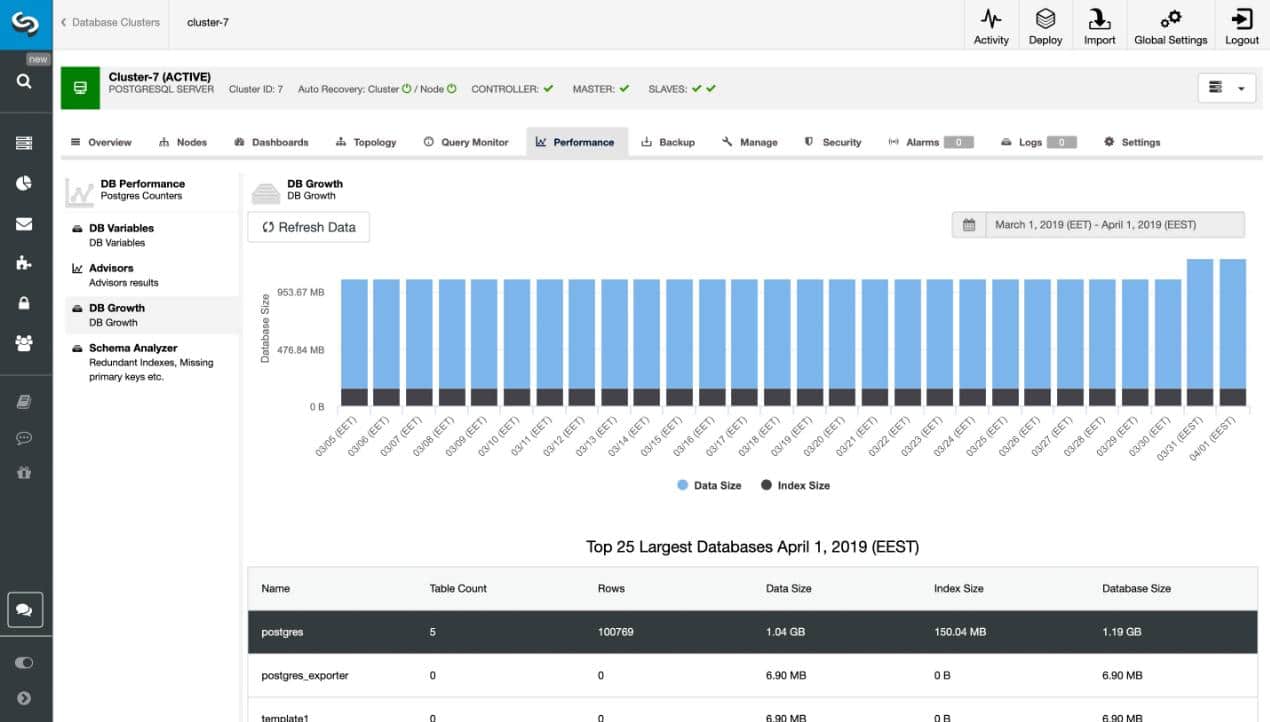
Through a single dashboard, you can view the activity and status of all your database instances through a single pane of glass. While most monitors only cover simple metrics like CPU and wait times, ClusterControl takes it a step further and incorporates full database life-cycle management into its platform.
Preconfigured report tabs allow you to toggle between insights quickly without having to spend the time making a dashboard from templates or manual queries. Insights like largest databases, top queries, alarms, and database growth can all be cycled through completely out of the box.
Who is it recommended for?
ClusterControl is recommended for organizations and database administrators dealing with the deployment and management of multiple PostgreSQL database instances. Its automation capabilities make it an ideal choice for those seeking efficiency in deploying and configuring databases on the fly. The tool’s unified dashboard caters to users desiring a consolidated view of all database activities, enhancing monitoring and management tasks. ClusterControl’s comprehensive insights, readily available through pre-configured report tabs, appeal to users looking for a solution that goes beyond basic metrics. While the free version provides fundamental monitoring capabilities, businesses requiring advanced features like load balancing, notifications, and performance management may find the Advanced or Enterprise plans more suitable.
Pros:
- Ease of Use: User-friendly interface and simple installation process make database management efficient and straightforward.
- Comprehensive Monitoring: Advanced monitoring tools provide deep insights into database metrics, enhancing operational oversight.
- Automated Recovery: Minimizes downtime by ensuring clusters quickly recover from failures.
- Scalability: Supports multiple database technologies, enabling centralized management of diverse environments.
- Robust Security: Centralized control enhances security and simplifies the management of backups and other key operations.
Cons:
- Limited Community Edition Features: Free version lacks certain critical features, such as the ability to add new nodes, which may restrict usability.
Cluster Control comes in three tiers; Free, Advanced, and Enterprise. While the free version can provide basic monitoring and insights, most businesses will need at least the Advanced plan for load balance, notifications, and performance management. ricing for Cluster Control is currently not publicly available, but a quote can be requested on its pricing page.
Choosing a PostgreSQL Monitoring Tool
PostgreSQL is one of the most complex types of SQL databases you can manage, so which of these seven tools is best for your company?
If you’re a medium to large-sized company where PostgreSQL uptime is your number one priority, Site24x7 Infrastructure is the best option. Site24x7 is incredibly fast to get started with and the entire platform feels intuitive from the start.
For organizations that are looking for PostgreSQL monitoring, but might want to also monitor other servers, PRTG Network Monitor will give you the flexibility to scale monitoring solutions to other servers and applications with relative ease.
How do you monitor your PostgreSQL databases? Do you find PostgreSQL to be more difficult to handle than other databases? Let us know in the comments below.