
As networks grow and expand, so do the number of devices that administrators are expected to support. Without proper infrastructure monitoring, this can create unexpected downtime and an overall headache for sysadmins. Let’s take a look at some of the best infrastructure monitoring tools on the market today.
Here is our list of the best infrastructure monitoring tools:
- SolarWinds Network Performance Monitor (FREE TRIAL) A system that makes constant checks on the availability and health of network devices. This software installs on Windows Server.
- SolarWinds Server & Application Monitor (FREE TRIAL) A comprehensive application performance monitor with routines for checking Web services and websites plus application dependencies on services and server resources. Installs on Windows Server.
- ManageEngine OpManager Plus (FREE TRIAL) A complete monitoring and management system for networks, storage, servers, firewalls, and applications. Available for Windows Server and Linux.
- PRTG Network Monitor (FREE TRIAL) A bundle of monitors that cover networks, servers, and applications. You tailor the package by deciding which monitors to turn on. Runs on Windows Server.
- Site24x7 Infrastructure Monitoring (FREE TRIAL) A package of system monitors that covers servers, servers, and applications. This includes cloud monitoring for platforms such as Azure. This is a SaaS system.
- Datadog Infrastructure Monitoring A cloud-based system monitor that tracks the performance of all of the services behind user-facing applications down to the server resources.
- Dynatrace A cloud-based infrastructure and application monitor with AI-processes and task automation.
- Nagios XI A monitoring package for networks, servers, and applications that can be augmented by thousands of free plug-ins. Runs on Linux or on Windows over a hypervisor.
- Zabbix A free system monitoring package for networks, servers, and applications. Available for Linux, macOS, and Unix.
1. SolarWinds Network Performance Monitor (FREE TRIAL)

SolarWinds Network Performance Monitor (NPM) is an on-premises tool that empowers sysadmins to detect network and endpoint problems before they impact the user or company’s efficiency.
A key feature of SolarWinds NPM is its flexibility to scan networks and detect new devices. This can be done through a simple SNMP agent, packet sniffing interface, WMI, or ICMP protocol. This range of options can allow admins to enable read-write access to the agent, giving them the option to push out configuration changes and commands through the NPM dashboard itself.
NPM does a great job of balancing real-time alerting with additional network performance health and insights. SolarWinds NPM automatically prioritizes critical issues such as hardware failure and network communications problems to the top of the queue, so admins know what needs to be tackled first.
Real-time metrics and performance benchmarks can easily be pulled and compared to historical baselines to allow for quick comparisons without having to draft lengthy reports. With so many devices and data points to track across a network, NPM works to consolidate and simplify only the most important metrics through a single dashboard.
Outside of dashboards and reporting, SolarWinds NPM has a suite of visualization tools like topological maps that make seeing different traffic routes and the devices they pass through easily. These maps are fully customizable and live, meaning you can select a node to see real-time statistics and push changes directly to them.
This balance between proactive and reactive alerting paired with the tool’s ease of use and flexibility is why it’s number one on our list. You can test out SolarWinds Network Performance Monitor free for a full 30 days.
2. SolarWinds Server & Application Monitor (FREE TRIAL)
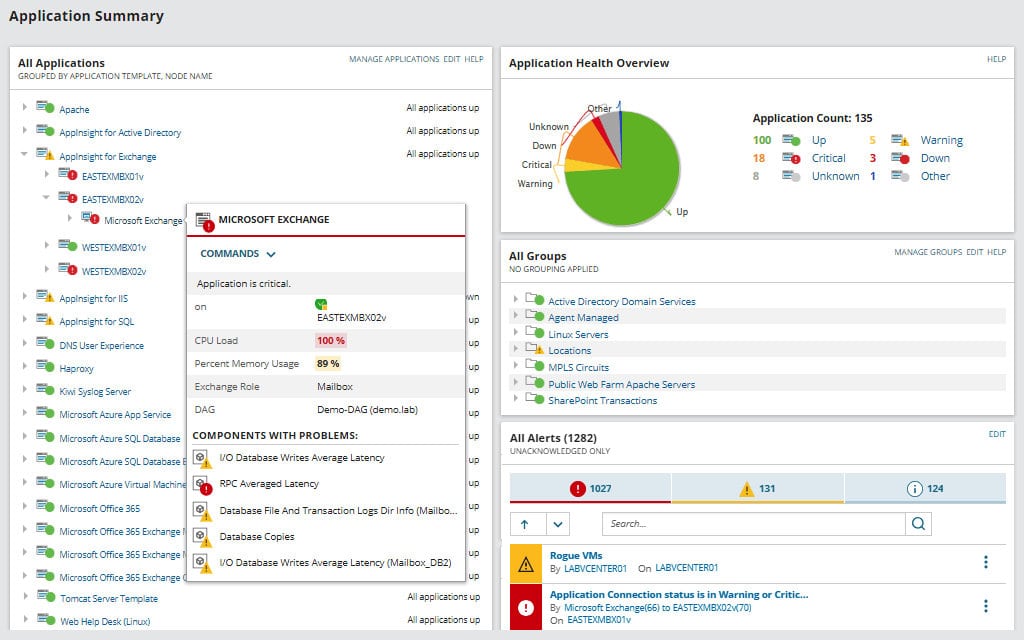
SolarWinds Server & Application Monitor, or SAM, is a hardy enterprise tool that monitors network infrastructure, applications, and individual devices. SolarWinds SAM stands out by offering detailed infrastructure dependency mapping with over 1200 templates that allow IT departments to start seeing results fast.
SAM can track the performance and overall health across on-premises, public, private, and hybrid cloud environments to provide a holistic picture of the network infrastructure’s status. Through cross-stack correlation, SAM can identify application and device dependencies as well as help pinpoint root causes of a problem to save time on troubleshooting.
This wide variety of support along with deep insights gives administrators confidence that they can grow, without overwhelming their infrastructure monitoring backend. Similar to Datadog, SAM offers at a glance insights through a single pane dashboard for a quick look at what needs attention right away. From this top-level look, you can individually drill down into specific nodes that give you a more detailed view of its status, with the option to push out additional configurations.
Alongside monitoring, SolarWinds SAM offers a small suite of helpful tools that administrators can use to better manage their infrastructures. Server capacity planning reports can take a historical look at capacity and usage, and help aid admins forecast future needs based on hard data. While advanced host monitoring helps monitor both its hardware as well as the virtual resources each application or client uses.
SolarWinds Server & Application Monitor starts at $1622 (£1184.77) and has both subscription and perpetual licensing available. You can test-drive a fully functional version of SAM through a free 30-day trial.
3. ManageEngine OpManager Plus (FREE TRIAL)
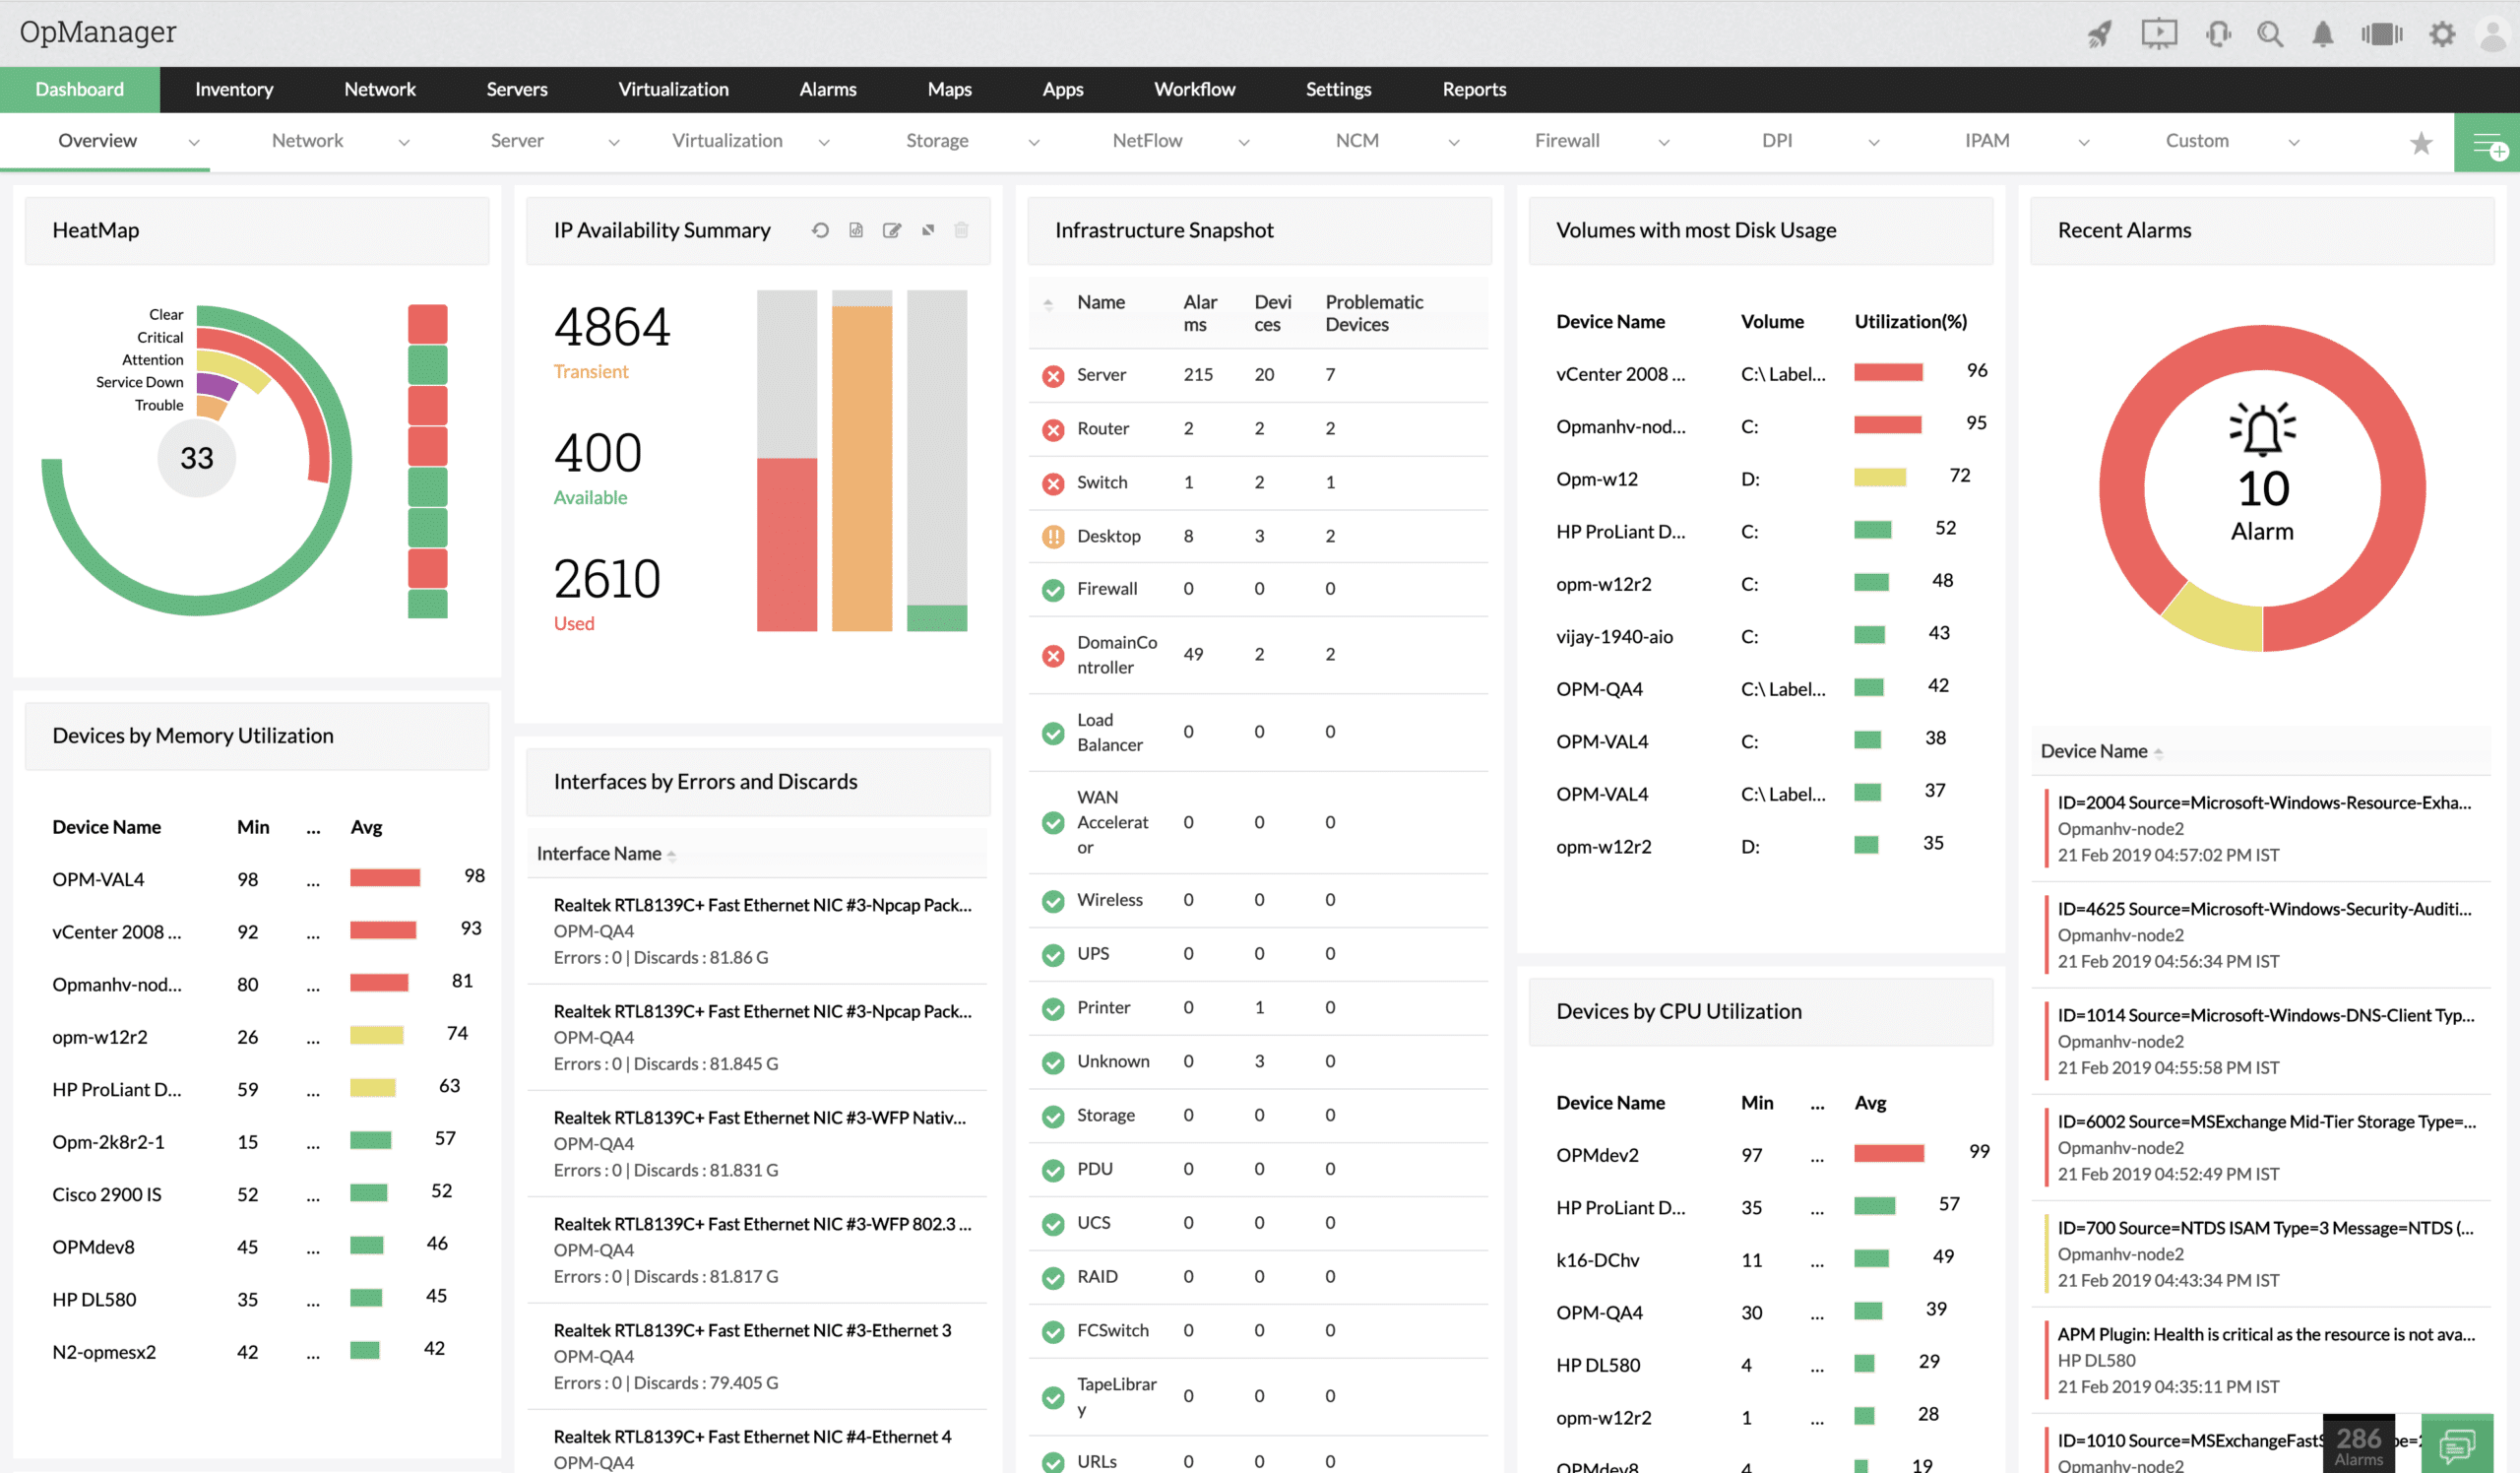
ManageEngine OpManager Plus is a collection of tools to monitor and manage networks, servers, and applications. The functions built into the OpManager Plus package are an amalgamation of several monitoring and management modules that ManageEngine sells as standalone plans. These are:
- OpManager Monitors network devices and servers, including an autodiscovery service for devices and virtual infrastructure and network topology mapping. Includes monitoring for Active Directory, Web servers, and mail server and also covers log management.
- NetFlow Analyzer Tracks network traffic and capacity utilization through the use of the NetFlow, IP-FIX, sFlow, J-Flow, NetStream, and AppFlow protocols.
- Network Configuration Manager Centralizes and standardizes device configurations. It backs up device settings and checks for unauthorized changes, restoring the original whenever tampering is detected.
- Firewall Analyzer Provides security services through firewall management and log analysis for SIEM-style intrusion protection.
- FileAnalysis Manage and protect storage locations whether on premises or in the cloud. Predict space requirements and clean up redundant temporary files.
- OpUtils Includes an IP address manager (IPAM) that will coordinate with existing DHCP and DNS servers to form a DDI solution. Also features a switch port mapper to track IP and MAC address usage through the network.
- Applications Manager Scans all applications and services to identify their interdependencies. Monitors resource usage and includes connectivity and performance testing tools for on-site and web-based applications.
So, this package includes just about all of the monitoring tools that you will need to supervise all of your infrastructure. Every module includes performance expectation thresholds that trigger alerts if crossed. Alerts are also raised if system resources run low.
This software bundle installs on Windows Server and Linux. ManageEngine offers it either on a perpetual license or for an annual subscription fee. You can get a 30-day free trial of OpManager Plus.
4. PRTG Network Monitor (FREE TRIAL)

PRTG is known for its wide variety of sensors, tools, and solutions in the IT space, and this extends directly into the infrastructure monitoring space. Through dozens of customized sensors, PRTG can monitor network infrastructure, endpoint devices, and general network health.
The PRTG platform contains a wide variety of tools that all support each other, making PRTG a great option for infrastructure monitoring if you were looking for complementary solutions. The platform supports a wide range of technologies including WMI, SNMP, SSH, SQL, as well as HTTP and REST APIs for web applications. PRTG Network Monitor leans into using visualizations to create a sort of centralized view of all your network infrastructure and key metrics. PRTG is one of the most customizable platforms featuring over 300 different map objects and widgets that can be used to create custom or team-based dashboards.
This detailed customization helps keep admins comfortable with their dashboards, as well as aids different teams to stay focused on the metrics that matter the most to them. The same principles are applied to the alerting functions inside the PRTF system. Rule or anomaly-based alerts can be pushed out via HTTP request, email, or through app notifications on iOS and Android.
For critical applications, PRTG features cluster failover to ensure maximum uptime. If one node were to go down, another node would take its place and an alert can automatically be sent to a team or administrator. This is great for locations that have multiple internet connections for failover, or other networking routing systems that rely on a fixed access ruleset.
PRTG starts at $1750 for a perpetual license that supports 500 sensors and one server installation. A free 30-day trial can be downloaded prior to purchase.
5. Site24x7 Infrastructure Monitoring (FREE TRIAL)

Site24x7 Infrastructure Monitoring is a plan that is offered by the Site24x7 cloud platform. The package includes network, server, cloud platform, middleware, application, and website monitoring and it also provides log management.
The package needs a link to the monitored locations. This is implemented by installing an agent on site and on cloud platforms. The agent is available for Windows Server and Linux. Once the agent is operating, it provides a device discovery process that creates a network inventory. The network search repeats constantly and if any hardware is added or removed, those changes are reflected in an updated inventory. Site24x7 draws up a network topology map based on the data held in the inventory.
The discovery process is based on the Simple Network Management Protocol (SNMP) as this process repeats, the service gathers status reports from each network device. This data is uploaded to the Site24x7 server where it is compiled into live performance graphs. The tool also compiles traffic activity data to track the performance of connections on the network and across the internet to other sites and cloud platforms. The statistics that Site24x7 calculates from this information is important for tracking the quality of service of VoIP connections.
Alongside its network monitoring routines, Site24x7 performs server monitoring, which tracks physical resource availability and activity. The tool also tracks the activity of logical servers, such as Web servers and email servers. You can use the tool to track virtualizations as well.
The package includes log management and network configuration management but these two units are the full extent of the system management tools in the bundle. This is primarily a monitoring package.
The core system monitoring package can be extended by integrations, These are plug-ins that provide monitoring capabilities for specific technologies and products, such as database management systems and containers.
All of the modules in the platform include performance thresholds that, when crossed, will generate alerts. Those alerts appear in the system console and they can also be sent as notifications to technicians by email or SMS.
The Infrastructure edition of Site24x7 is sized to be suitable for use by small businesses. Larger businesses can get capacity extensions by paying a higher subscription rate.
Get started with a 30-day free trial .
6. Datadog Infrastructure Monitoring

Datadog offers deep insight into device and network infrastructure by combining visual aesthetics with power automation to help reduce emergencies and put admins in a more proactive position.
Provided as a cloud service, Datadog uses a simple network monitor to pull raw data into their network, and output that information into actionable insights, historical metrics, and prioritized alerts. The platform supports both cloud and multi-cloud environments as well as IoT deployments and hybrid network setups.
On top of this flexibility, the platform has a robust network of partners, currently supporting integrations into 500 other tools, software, and platforms. From an organizational perspective keeping assets straight in Datadog is easy with a number of prebuilt and customizable filtering features. For instance, you can create and classify your own groups of networks or devices through internal tagging which can be used to quickly search across a range of devices.
Unlike some tools, there is no complicated query language to master, or proprietary coding to learn when searching for insights and performance data. Much of the search-based functions in Datadog are object-based or highly visual in nature, meaning even junior administrators can dive into the platform without getting overwhelmed.
Machine-based learning plays a large role in why Datadog is a powerful infrastructure management tool. Artificial intelligence helps reduce noisy and repetitive alerts by suppressing them and displays to the surface only critical notifications humans need to review. When pairing Datadog with automation you can put a serious dent in your workload.
For instance, if you create a workflow rule that fires off a cleanup script or moves certain folders if an Exchange backpressure alert occurs through Datadog. This not only helps keep the server online but positions you to look for more big picture solutions, rather than running to put out another fire.
Datadog offers transparent pricing across three tiers and has a free version of infrastructure monitoring that is limited in hosts and features. You can try the full version of Datadog Infrastructure monitoring free for 14 days.
7. Dynatrace

Dynatrace leverages AI and sleek design to help give deep insight into network infrastructure automatically. Dynatrace can provide visibility into multi-cloud, PaaS environments as well as tailored metrics into virtual and physical server architectures.
By working directly with artificial intelligence assistance tools, administrators can continuously monitor the entirety of the network to detect anomalies, identify faulty hardware, and prioritize incoming events for admins for NOC team members.
Data is pulled from both event logs as well as sniffed live across the network and pulled directly into the Dynatrace system. This can be both processed and visualized as well as interpreted by machine learning algorithms to apply automatic remediation.
Dynatrace arguably has some of the best-looking dashboards available of all the monitoring tools. These can help “silo” different widgets into categories like quick overviews, cloud health, and local infrastructure status. Underneath it all full-stack monitoring gets to work analyzing dependencies and providing root cause analysis to help complete tickets faster and prevent infrastructure issues from impacting the bottom line.
All real-time alerts and metrics generated in Dynatrace can be ported over to multiple supported ITSMs like ServiceNow to automatically create and prioritize tickets for the NOC team. Alternatively, these same integrations can be used to automatically trigger scripts, or kick off a workflow.
Infrastructure monitoring with Dynatrace currently starts at $21.00 per month when billed annually, and allocated up to 8 GB per host. You can test the platform out yourself through a free 15-day trial.
8. Nagios XI

Nagios XI is a highly-customizable infrastructure monitoring tool that helps administrators automate their monitoring, as well as their networking planning and asset management. Designed for ease of use, Nagios XI positions itself as one of the easier-to-use monitoring tools that support multi-tenant support, and the ability to monitor multiple clients.
The host runs locally, and uses a very small resource footprint, only requiring 2GB of memory and a dual-core 2.4 GHz processor. Once installed it probes the network for assets and maps out the network topology. A simple dashboard provides an at-a-glance view of the network and helps admins immediately identify critical issues before they cause problems. The platform also features capacity planning which can help forecast traffic as well as budget for infrastructure upgrades.
Nagios XI creates an easy-to-use atmosphere using configuration wizards that can launch widgets, reports, and even Integrations in just a few clicks. The back end of the platform has an extensive open API to help for simple Integrations as well as thousands of community-driven add-ons that help fill the gaps in the platform’s library of monitors.
Pricing comes into tiers, Standard Edition as well as Enterprise Edition. Starting at $1,995 the standard edition features advanced reporting, enhanced visualization, and easy configuration wizards to help most small to medium-sized businesses plan and monitor their infrastructure. The Enterprise Edition adds additional features such as automated host decommissioning, book modification tools, and SLA reports. Nagios XI can be tested for free for a full 30 days.
9. Zabbix

Zabbix is an enterprise-level open source infrastructure monitoring tool, with an endless amount of customization options and a dedicated support community. The platform utilizes agentless monitoring or small agents on specific targets that both monitor devices and listen for traffic.
Although the tool is locally hosted, an intuitive web-based interface is available to allow monitoring from virtually anywhere. During the initial network discovery network devices and other assets are located, identified, and organized directly into the dashboard. Due to the open-source nature of the platform the architecture allows for dramatic scalability in either direction but is likely more suited for smaller budget-conscious operations.
Due to the open-source nature of the infrastructure monitoring tool, Zabbix can monitor hundreds of different types of databases, services, applications, and networks. While the product is free, it does come with a steep learning curve and a number of paid support options ranging from installations to migrations.
Which infrastructure monitoring tool is right for you?
So which tool is best for you? No matter your company size, both SolarWinds NPM and Datadog give full visibility into your infrastructure, without the headache of a complex onboarding process.
For companies with more brains than budget, Zabbix is completely free and open-source but leaves almost all of the heavy lifting up to you.
Do you have a favorite infrastructure monitoring tool? Be sure to let us know what it is in the comments below.


