Apache Cassandra, or simply Cassandra for short, is a database solution that is used widely across various industries. It is, in fact, so popular that many monitoring tools oversee its performance. In this post, we will have a look at some of the best Cassandra monitoring tools to help you choose the one that fits your specific needs.
What is Cassandra?
Apache Cassandra is an open-source NoSQL distributed database solution that is used by thousands of companies that choose it for its scalability and high availability without any compromise in its performance. Also, its linear scalability and proven fault-tolerance – be it on on-premises hardware or in a cloud infrastructure – make it the perfect platform for mission-critical data.
Cassandra, as a database management system (DBMS), was built to handle large volumes of data, which also adds to its overall appeal.
What is Cassandra used for?
Some real-life use cases that make Cassandra the most ideal DBMS, include:
- Handling time-series data It is best for storing time-series data, like log files, where previous data does not need to be updated. Log files from infrastructure and apps do not need to be changed once they have been stored. In case of issues, users can simply go down and read the most current versions.
- Integrating globally distributed data Cassandra can store data in geographically distributed locations. This means that it has no “master node,” and it can be scaled using common storage devices, making it ideal for the cheap geographic expansion of business databases.
- Tiny digital footprint Cassandra is a cost-effective solution when network costs are high because it does not need to keep polling data or connecting to a far-away master node.
It all adds up to mean that businesses can update their cloud and adapt the way data is processed and stored with Cassandra, regardless of the size of their data or where their requests come from.
Why use Cassandra?
Some features that make Cassandra the go-to DBMS solution include:
- Hybrid architecture for redundancy A masterless architecture and low latency means Cassandra can withstand an entire data center outage without any data loss, be it on-premises or across public or private clouds.
- Fault tolerance Cassandra supports replication across multiple data centers. This provides low latency for users and peace of mind knowing data loss is negligible during outages as failed nodes can be replaced with zero downtime.
- Testing for quality Cassandra is tested on clusters as large as 1,000 nodes and with hundreds of real-world use cases and schemas to ensure reliability and stability. Some assessments include replay, fuzz, property-based, fault-injection, and performance tests.
- Proven performance Thanks to its fundamental architectural structure, Cassandra consistently outperforms popular NoSQL alternatives in benchmarks and real applications.
- Easy sync control Users can choose between synchronous or asynchronous replication for each update. Meanwhile, highly available asynchronous operations are optimized with features like Hinted Handoff and Read Repair.
- Secure observability Cassandra’s audit logging feature for operators tracks the DML, DDL, and DCL activity with minimal impact on its performance, while the Full Query Logging tool (fqltool) allows for the capture and replay of production workloads for analysis purposes.
Of course, as mentioned above:
- It is distributed When it comes to Cassandra, there are no single points of failure, and hence no bottlenecks. Also, every node in the cluster is identical, which makes this DBMS suitable for applications that can’t afford to lose data, even when the entire data center goes down.
- It is scalable Users can increase their read-write throughput linearly by introducing new machines and with no downtime or interruption to the applications using them.
- It is elastic During scaling operations, like when adding a new node or data center while undergoing peak traffic times, Cassandra continues to stream data between nodes thanks to its Zero Copy Streaming capabilities that make it up to five times faster for a more elastic architecture.
Some notable companies that reportedly use Apache Cassandra in their tech stacks include Amazon.com, Apple, and Walmart.
The Best Cassandra Monitoring Tools
OK; now that we have seen how powerful Cassandra is, let us go ahead and have a look at the database monitoring tools you can use to make sure it is all working as expected. The best Cassandra monitoring tools are:
1. ManageEngine Applications Manager (FREE TRIAL)

ManageEngine Applications Manager is another one of the best Cassandra monitoring tools in the industry. This tool enables comprehensive Cassandra performance monitoring and administration of all nodes in a cluster and from a centralized console.
Let’s have a look at some of the features that make it stand out:
- Applications Manager collects statistical data from all JVMs in a cluster and key Cassandra metrics like memory utilization, task statistics of thread pools, storage usage, CPU usage, operation performance, latency, and pending tasks.
- It helps manage clusters efficiently by continuously monitoring Cassandra clusters with its dashboards that detail the health, availability, and performance status of all monitored clusters.
- It also helps retrieve details on live, leaving, moving, joining, and unreachable nodes, as well as monitor the health of nodes within each cluster.
- This Cassandra monitoring tool closely tracks the memory consumption of applications running in the environment and displays the used, free, and total memory of the server in megabytes.
- Users can get notifications about high CPU usage in Cassandra cluster nodes – with the help of its cluster monitoring capabilities that track metrics like the number of processors, exceptions, CPU utilization, and time trends as well as identify and troubleshoot hardware-related performance issues.
- Users can track operations stats and latency (averages and totals) of range, read, and write operations per second at the server level. It also tracks the number of completed compaction since the last start of a Cassandra instance, pending, and other tasks waiting in the queue to be executed.
- The Applications Manager monitors distinct Cassandra thread pools and provides statistics on the number of active tasks, pending, completed, and blocked to help plan additional capacity in case of spikes or resource-intensive operations.
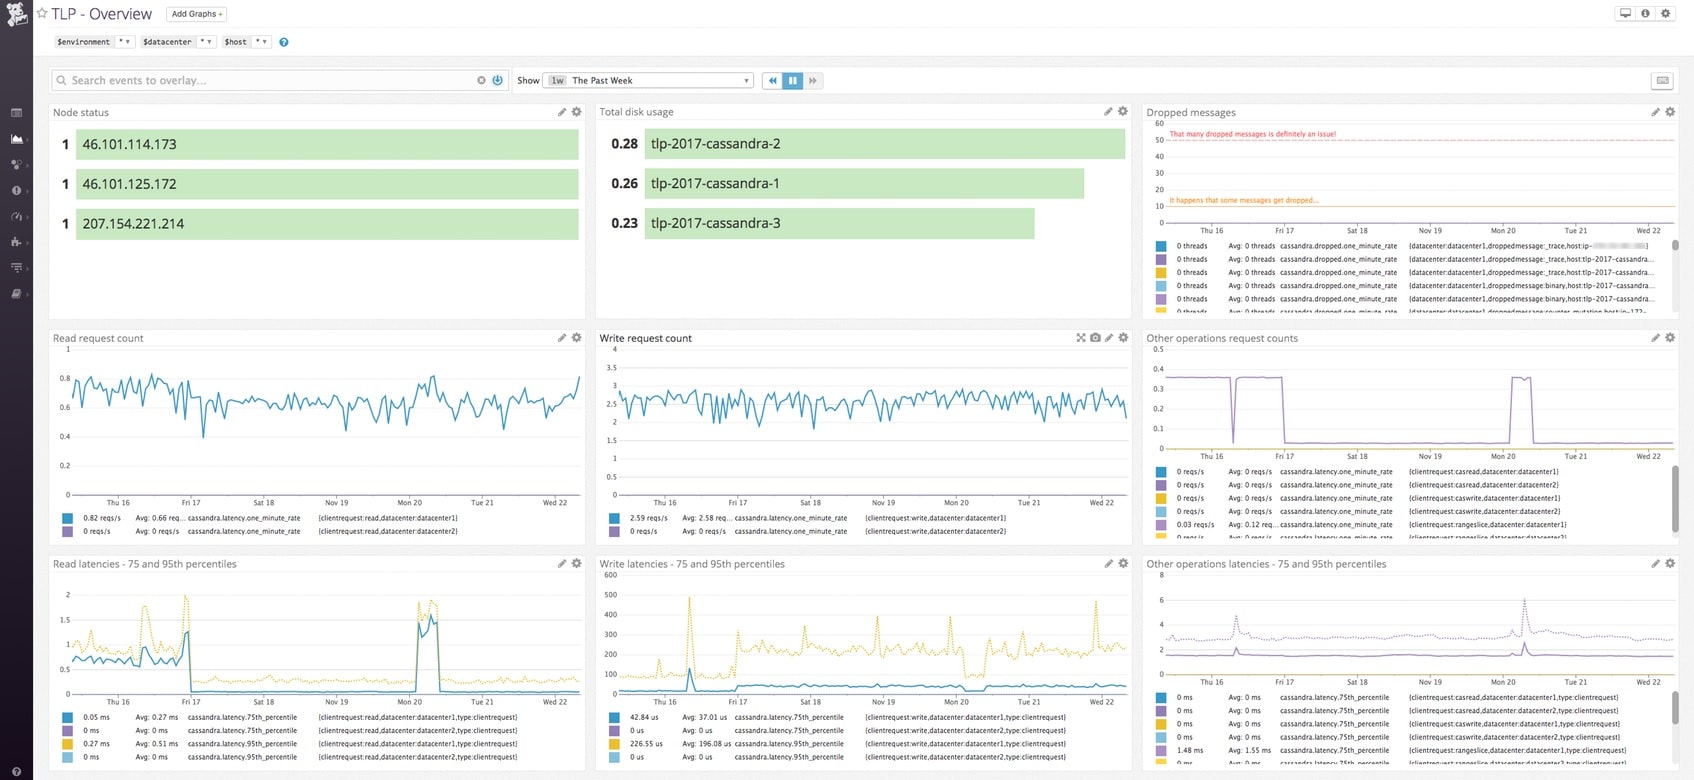
- Dropped messages – indicators of overload scenarios in a Cassandra environment – can be monitored to prevent failures; users can receive a log summary of dropped messages along with the message type to help establish thresholds and configure alarms to notify them as they occur.
- It can help users get an overview of latency and memory table details for each keyspace by tracking various parameters such as Read Latency, Write Latency, Memory table columns, heap size, switch count, and live data size.
Try ManageEngine Applications Manager using their DEMO or download it for FREE.
2. Site24x7 (FREE TRIAL)

Site24x7, another popular tool, is an all-in-one cloud-based monitoring solution for IT and DevOps teams of all sizes including startups, SMBs, and Fortune 500 companies. Apart from Cassandra, it monitors everything – from websites, servers, logs, applications, network devices, and virtualization environments, and even records the experience of users in real-time.
But, there’s much more:
- The Site24x7’s Cassandra plugin tracks critical metrics, including throughput, key cache hit rates, and latency, to gain visibility into the health of Cassandra databases. Users can also monitor error metrics like exceptions and pending compaction tasks to stay ahead of issues before they start affecting end users.
- Other features include a centralized log management service for the entire IT environment with the help of customizable dashboards and detailed root cause analysis reports.
- It can be configured to send out instant alerts via voice, SMS, calls, and third-party integrations with platforms like Slack, Zapier, PagerDuty, Microsoft Teams, and Zoho Analytics.
- Site24x7’s Cassandra plugin tracks numerous metrics like Read/Write total latency and throughputs, compaction tasks, garbage collection, timeout or unavailable exceptions, and other resource utilization metrics.
- It is an easy tool to integrate and use for monitoring Apache web servers, as well as Cassandra.
- It monitors all metrics that are exposed by the status module which, once configured, pings the server to be monitored at set intervals to collect the latest metrics values and then be pushed to be shown on charts and dashboards that users can create.
- Site24x7 also monitors network devices – like routers and switches – in the infrastructure, which when combined with other monitoring data, provides additional insights into potential bottlenecks.
- This easy-to-use and master tool has an alerting system with multiple options, including automated phone calls.
Try Site24x7 FREE for 30 days.
3. Datadog
When it comes to asset monitoring, including DBMS, Datadog is versatile and, arguably, one of the best choices on the market today. Here’s why:
- Datadog easily identifies slow-running Cassandra queries, spots bottlenecks, registers error rates and does much more with full-stack application tracing, latency breakdowns, and tracing.
- It collects metrics on query throughput, execution performance, connection rates, buffer pool usage metrics, and more.
- Users gain critical visibility into their database and application interdependencies via real-time service maps; they can analyze slow query logs quickly with an intuitive logging platform and auto-pattern recognition.
- Apart from Cassandra databases, they can also monitor cloud services, containers, and serverless functions – all in one place, using Datadog’s 600+ vendor-backed integrations.
- It allows them to create custom, drag-and-drop dashboards within seconds to visualize highly granular data and custom metrics in real time.
- Users seamlessly navigate between logs, infrastructure metrics, and application traces.
- They can set up alerts for anomalies and outliers that account for daily, weekly, and seasonal fluctuations to proactively prevent outages and errors by alerting on metric forecasts.
- They also save on time spent on responding to spurious alerts by creating composite alerts, based on Boolean logic; they can diagnose root causes faster and see anomalous behavior across all systems by correlating query metrics with database and infrastructure metrics.
Try Datadog for FREE.
4. Dynatrace
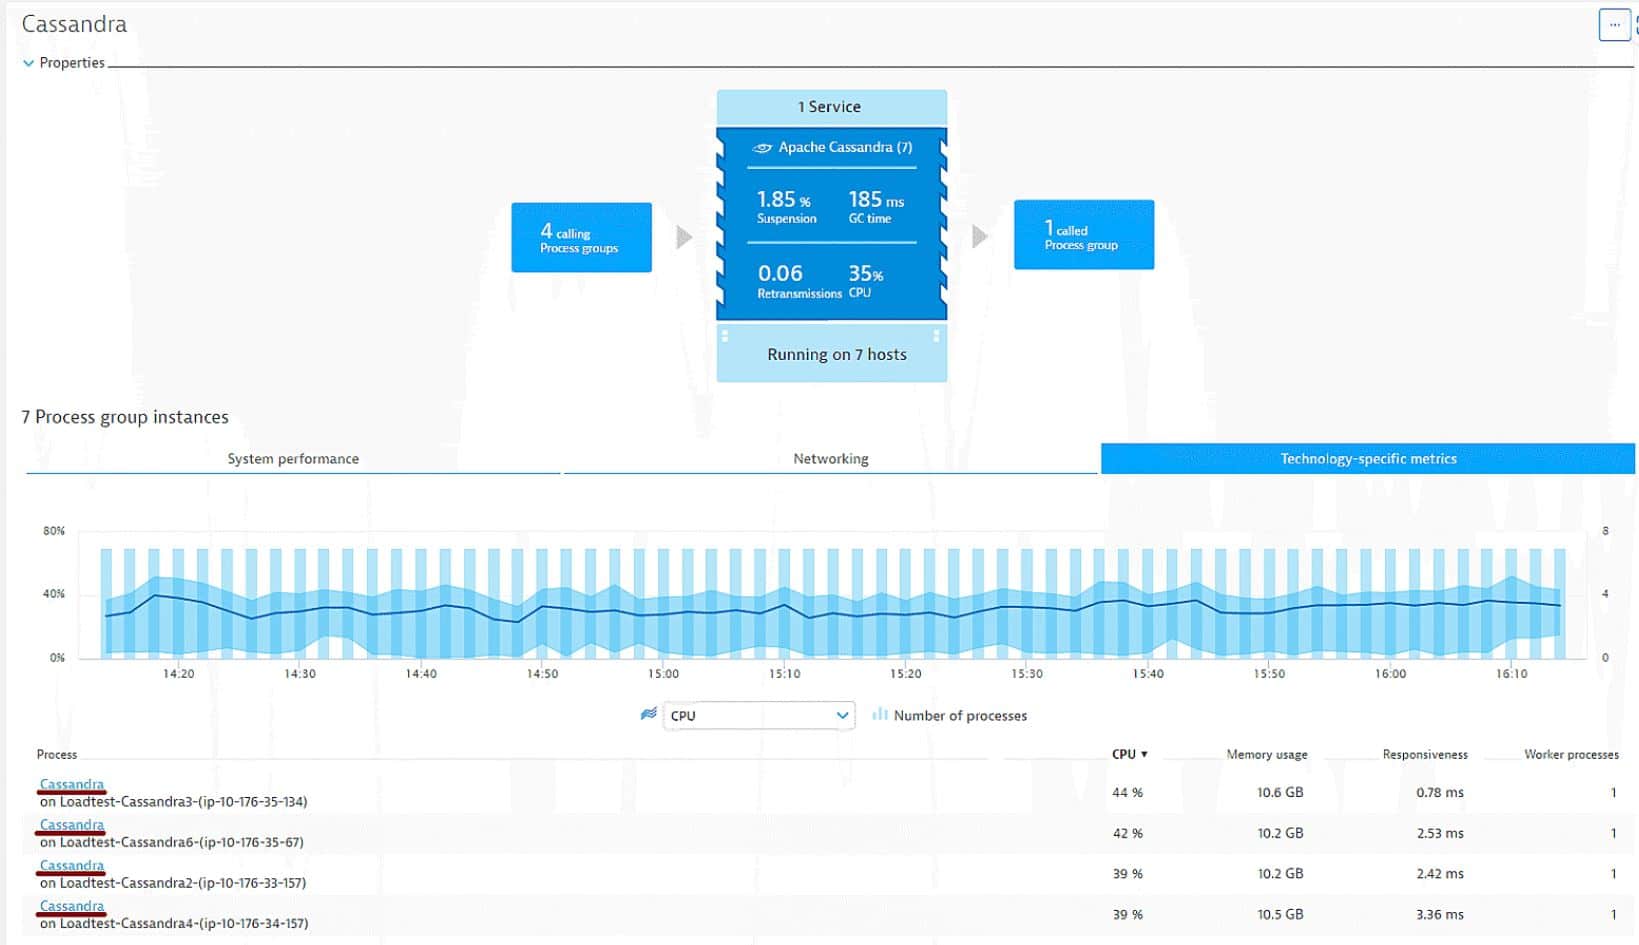
One thing that makes Dynatrace stand out is the fact that it automatically identifies Cassandra’s installations. From there, polling them, extracting metrics data, and creating user-friendly reports or dashboards are a breeze.
Let’s have a look at some of its features:
- Dynatrace removes the need for manual configuration of monitoring setups as it detects Cassandra databases and starts to show metrics like CPU, connectivity, retransmissions, suspension, and garbage collection times.
- If the installation is enabled globally, this tool automatically collects all metrics as soon as a new host running Cassandra is detected in the entire environment.
- It works right out of the box and users can immediately start to optimize their Cassandra database performances.
- It has an “Exceptions and Failed requests” chart, for example, that shows if there are problems with a node. Users can track metrics like Unavailable Read/Write counts or increased latency, while the number of operations remains stable, to spot performance issues.
- The metrics reports and dashboards are interactive and allow users to drill down to the granular basic metrics of each individual node to find the root cause of problems and potential bottlenecks.
- Users get instantly alerted if instances are underperforming – and the tool shows which node(s) are affected.
Try Dynatrace – FREE for 15 days.
5. AxonOps

AxonOps is a Cassandra monitoring that was built specifically with the DBMS in mind. The company boasts that it is “built by Cassandra experts,” and that it is the “only cloud-native solution to monitor, maintain, and backup any Cassandra cluster”.
Looking at some of its features:
- AxonOps offers dynamic, intuitive, and highly customizable dashboards to collect logs and metrics as well as perform service checks that ensure critical Cassandra cluster insights are always available.
- Users can monitor their Cassandra deployments with dynamic, customizable dashboards that have been preconfigured to present key information required to observe its performance effectively; this ensures the implementation of best practices is applied with ease.
- It is built on a highly efficient architecture that comes with customizable dynamic dashboards to meet user requirements; it also allows them to meet Cassandra consistency-level requirements with advanced and intelligent repair processes with no compromise on the performance of the cluster.
- AxonOps has highly configurable backup-and-restore processes that are supported by fine-grained retention management, and a flexible scheduler, and can integrate with any storage methods in place.
- The predefined, dynamic customizable dashboards display and cross-reference all key information thanks to the visualization of metrics and logs – all Cassandra metrics and logs can be collected and displayed in the same place.
- AxonOps agent not only collects the performance metrics but also creates a fully searchable logs dashboard, allowing users to create charts that compare logs with the performance dashboards to ensure lightning-fast root cause analysis.
- It has a comprehensive alerting capability that covers the entire stack – with rule configurations for metrics, logs, and service checks that can be sent to multiple alerting platforms.
Try the AxonOps Demo Sandbox for FREE.
What’s the best Cassandra monitoring tool?
Selecting just one from the best Casandra monitoring tools wouldn’t be fair. The tools we have seen above are all time-tested monitoring solutions that can perform as well as expected.
But, for the smaller businesses, it is recommended that they opt for Site24x7 because it eliminates the need for in-house technical know-how. With it being a cloud-hosted solution and pretty easy to set up and use, it becomes the choice for SMBs and organizations that don’t want to focus too much on supporting a Cassandra monitoring tool.
Meanwhile, businesses with larger IT budgets and experts at hand should opt for Datadog. This Cassandra monitoring tool offers in-depth insights and easy-to-configure dashboards to help stakeholders keep track of their full stack.
What do you think? Let us know, and leave us a comment.