In the world of network administration, a lot of focus is placed on monitoring and security tools, but comparatively, little attention is paid to network storage. This is surprising given that almost every enterprise needs a storage solution in one form or another. From storing websites and servers to emails and SAN devices, storage area networks are essential for maintaining an enterprise-scale network.
Here is our list of the best Storage Area Networks (SAN) monitoring tools on the market:
- ManageEngine OpManager (FREE TRIAL) Part of the OpManager network monitor, this tool can cover all connections to storage devices as well as each individual resource. Installs on Windows Server and Linux. Get a 30-day free trial.
- Paessler PRTG SAN Monitor (FREE TRIAL) A storage monitoring sensor as part of a wide network, server, and applications monitor. Installs on Windows Server. Get a 30-day free trial.
- Site24x7 Storage Monitoring (FREE TRIAL) Cloud-based SAN monitoring with real-time alerts and unified visibility across storage, servers, and networks. Scales well for enterprises and MSPs. Get a 30-day free trial.
- ManageEngine OpManager Nexus (FREE TRIAL) This is an enterprise monitoring tool that can monitor storage performance and availability at scale. It covers multiple vendors across Windows and Linux environments. Download a 30-day free trial.
- IntelliMagic Vision for SAN A management system for SAN servers that integrates AI processes. A choice of on premises software over a hypervisor or a cloud service.
- Nagios XI A complete infrastructure monitoring solution that includes specialized plugins for storage management.
- SolarWinds Storage Resource Monitor Covers multi-vendor storage solutions with a full performance and capacity monitoring service. Installs on Windows Server.
- SevOne Creates a consolidated view of all storage available on the network.
- App Dynamics Storage Performance Monitor Gives live, drill-down performance data on all the storage on a network covering aggregated statistics down to individual storage devices.
- PowerAdmin Storage Monitor Unifies the monitoring of storage devices, servers, and network equipment and can also cover WANs.
- EG Innovations Attractive color-coded monitoring screen ease SAN administration for mid to large size enterprises.
- Broadcom SAN DIagnostics Capture A free specialized monitor for SANs that includes health check sweeps and planning functions.
Larger networks running a variety of SAN devices must be constantly monitored in order to ensure long-term uptime. As a result, a number of SAN tools have risen to aid in capacity planning and prevent downtime. However, choosing a storage area network and SAN storage devices is often easier said than done. Not only do you have to take into account the needs of your current network, but your network will in the future as well. In this article, we talk you through how storage area networks work and break down some of the best SAN tools on the market.
What is a Storage Area Network?
Storage Area Networks (commonly referred to as SANs) are a scalable network and block-level storage method. A SAN takes storage resources off of your main network and transfers them into a unique high performance network. This network can then be accessed by a server as if it was a local disk rather than an entire network.
An enterprise might invest in a SAN solution for a number of reasons:
- Eliminates need for local disks
- Scalable – can be comprised of hundreds of unique disks
- High performance – doesn’t depend on network traffic
- Secure from unauthorized access and doesn’t need to be rebooted in order to add new disks
- Acts as a disaster recovery solution in the event of a network disaster
Guide to SAN Topology
One of the biggest things to understand about SAN is that there are a variety of different topology setups, each with their own inherent strengths. Your choice of topology structure is greatly influenced by your needs. In this section, we look at some of the core components of SAN topology, such as:
- Fibre Channel Arbitrated Loop
- Single and Dual-Switch
- Core-edge Topology
Fibre Channel Arbitrated Loop (FC-AL)
The most basic Fibre Channel used within SAN systems is the FC-AL. In an FC-AL, devices are connected together in a loop without a switch and each device connects to the next one in the chain. This is a popular model in SAN systems but it has the disadvantage of low performance and, potentially, complete failure. The failure of one device within the loop will break down the whole system. In this section we’re going to run through the basics of SAN topology to give you an idea of what setups companies are using.
Single and Dual-Switch
One way to mitigate the risks of a complete loop failure is to add in a single switch to the SAN topology. This allows multiple ports to speak at once and decreases latency throughout the system. It is important to note that not all switches are made the same. Two of the most common switch types are shown below:
- Director-class switch – Has thousands of ports, is high performance and scalable
- Basic switch – Has a limited number of ports and isn’t very scalable
In addition you can actually add multiple switches to the switched fabric. This is beneficial because it enables you to double the number of available ports and protects the system’s connectivity in case a switch goes down. The more ports you have available, the more flexibility you have in terms of usage.
If you add more than one additional switch, you start to form a mesh fabric. A mesh fabric is a series of interconnected switches. What separates a mesh fabric from a loop is that each switch is also connected via inter-switch links (ISLs).
Core-edge Topology
Even though adding switches and using mesh fabric improves SAN performance, a number of limitations remain. The main problem is that adding switches can not get around the problem of a low port count. Larger organizations need plenty of ports, and a low port count is a major obstacle in this respect. As a result, core-edge topology has come to the forefront of SAN topology.
This model adds a larger fixed switch or director class switch attached to fix switches at the end of the topology. This gives larger organizations more ports at their disposal than a mesh fabric. However, this model is unsuitable for smaller organizations because it leaves an abundance of unused switches.
Our methodology for selecting storage area networks (SAN) monitoring tools:
We’ve broken down our analysis for you based on these key criteria:
- Comprehensive monitoring of storage resources and SAN performance.
- Compatibility with multi-vendor storage solutions.
- Real-time alerts and notifications for performance issues.
- Capacity planning and future usage forecasting capabilities.
- User-friendly interface and ease of installation.
The Best SAN Monitoring Tools
1. ManageEngine OpManager (FREE TRIAL)

ManageEngine produces a range of infrastructure monitoring and management systems that can each be operated individually, or put together as a suite of tools. The core module for networks is called OpManager. As well as monitoring network device health and observing system capacity, this system monitor will also monitor SANs.
Key Features:
- Tracks capacity and performance of SAN devices
- Real-time health and availability monitoring
- Color-coded dials for quick status checks
Why do we recommend it?
ManageEngine OpManager is efficient in tracking the performance and capacity of SAN devices, offering real-time monitoring and an intuitive alert system.
OpManager is ideal for monitoring SANs because it is capable of tracking the capacity and performance of any device connected to a network. That means it can monitor tape drives, RAIDs, and SAN switches.
Despite the SAN ethos of treating all storage devices as a single pool of resources, each individual element needs to be confirmed to be in constant working order. The data management element of OpManager is ideal for this multi-layered view because it can aggregate performance data while still making drill-down information available on each individual device. All of this information is maintained in real-time.
OpManager constantly tracks the health, availability, capacity, and utilization of each device in the SAN pool. Summaries of capacity and performance are represented as color-coded dials, enabling a quick visual inspection of statuses. The service also sets performance thresholds, which trigger alerts when tripped. This notification system removes the need to have a dedicated technician watching the monitoring screens all of the time.
OpManager will watch the SAN and the network and send out an alert if potential problems are spotted. The alert thresholds are set at levels that allow time for evasive action to be taken so that problems can be resolved before the user community notices any problem with performance.
Who is it recommended for?
Ideal for organizations seeking a versatile tool that provides detailed monitoring of SANs alongside network device health.
Pros:
- Real-time monitoring of SANs and network devices
- Efficient alert system for immediate issue identification
- Customizable dashboard for easy status recognition
Cons:
- May require initial setup time for customizations
ManageEngine OpManager installs on Windows Server and Linux. Anyone can put the system through its paces on a 30-day free trial.
2. Paessler PRTG SAN Monitor (FREE TRIAL)

The PRTG SAN Monitor is one of the leading infrastructure monitoring tools. The PRTG data collection interfaces are called ‘sensors’. A sensor monitors one particular physical aspect of your infrastructure or focuses on one attribute of data processing and movement. You can tailor your implementation by choosing which sensors to turn on. The PRTG software includes four sensors that specifically track storage area networks.
Key Features:
- Variety of SAN-specific sensors
- Customizable dashboard and reports
- Secure monitoring via SSH
- Cloud-based or on-premises deployment
Why do we recommend it?
Paessler PRTG SAN Monitor offers a range of specialized SAN sensors, providing detailed and secure monitoring with a customizable interface.
Paessler also includes sensors that track hardware from specific manufacturers and these will monitor your SAN as well.
The four universal SAN sensors cover:
- system health, looking at factors such as temperature and voltage
- the performance of disk drives
- statuses of logical and physical disk drives
- statuses of cases, controllers, and power supplies
Monitoring traffic is protected by the Secure Shell (SSH). This gives your administrative data extra privacy and so you can safely include remote sites in your centralized monitoring console.
The data collected by sensors is assembled into display formats in the dashboard. The display includes useful graphical representation, which makes status recognition easy. You can customize the dashboard and you also get the opportunity to customize reports that are generated through the system. The PRTG package ships with a number of pre-written reports as well.
PRTG covers a lot of other infrastructure factors and data collected on server and network health will add to your ability to keep your SAN available and active.
Who is it recommended for?
Best for businesses of all sizes needing a customizable, comprehensive solution for SAN monitoring with secure data collection.
Pros:
- Specialized sensors for detailed SAN monitoring
- Customizable dashboard and reporting
- Free version for small-scale monitoring
Cons:
- Larger sensor requirements can become costly
If you are interested in the PRTG package, Paessler gives you two implementation options. You can access the software online as a cloud-based service or you can install it on your premises. The software runs on the Windows environment. You can use the system for free perpetually to monitor up to 100 sensors. If you want a larger number of sensors, you will have to pay. However, you can get the SAN Monitor with PRTG on an unlimited number of sensors on a 30-day free trial.
3. Site24x7 Storage Monitoring (FREE TRIAL)
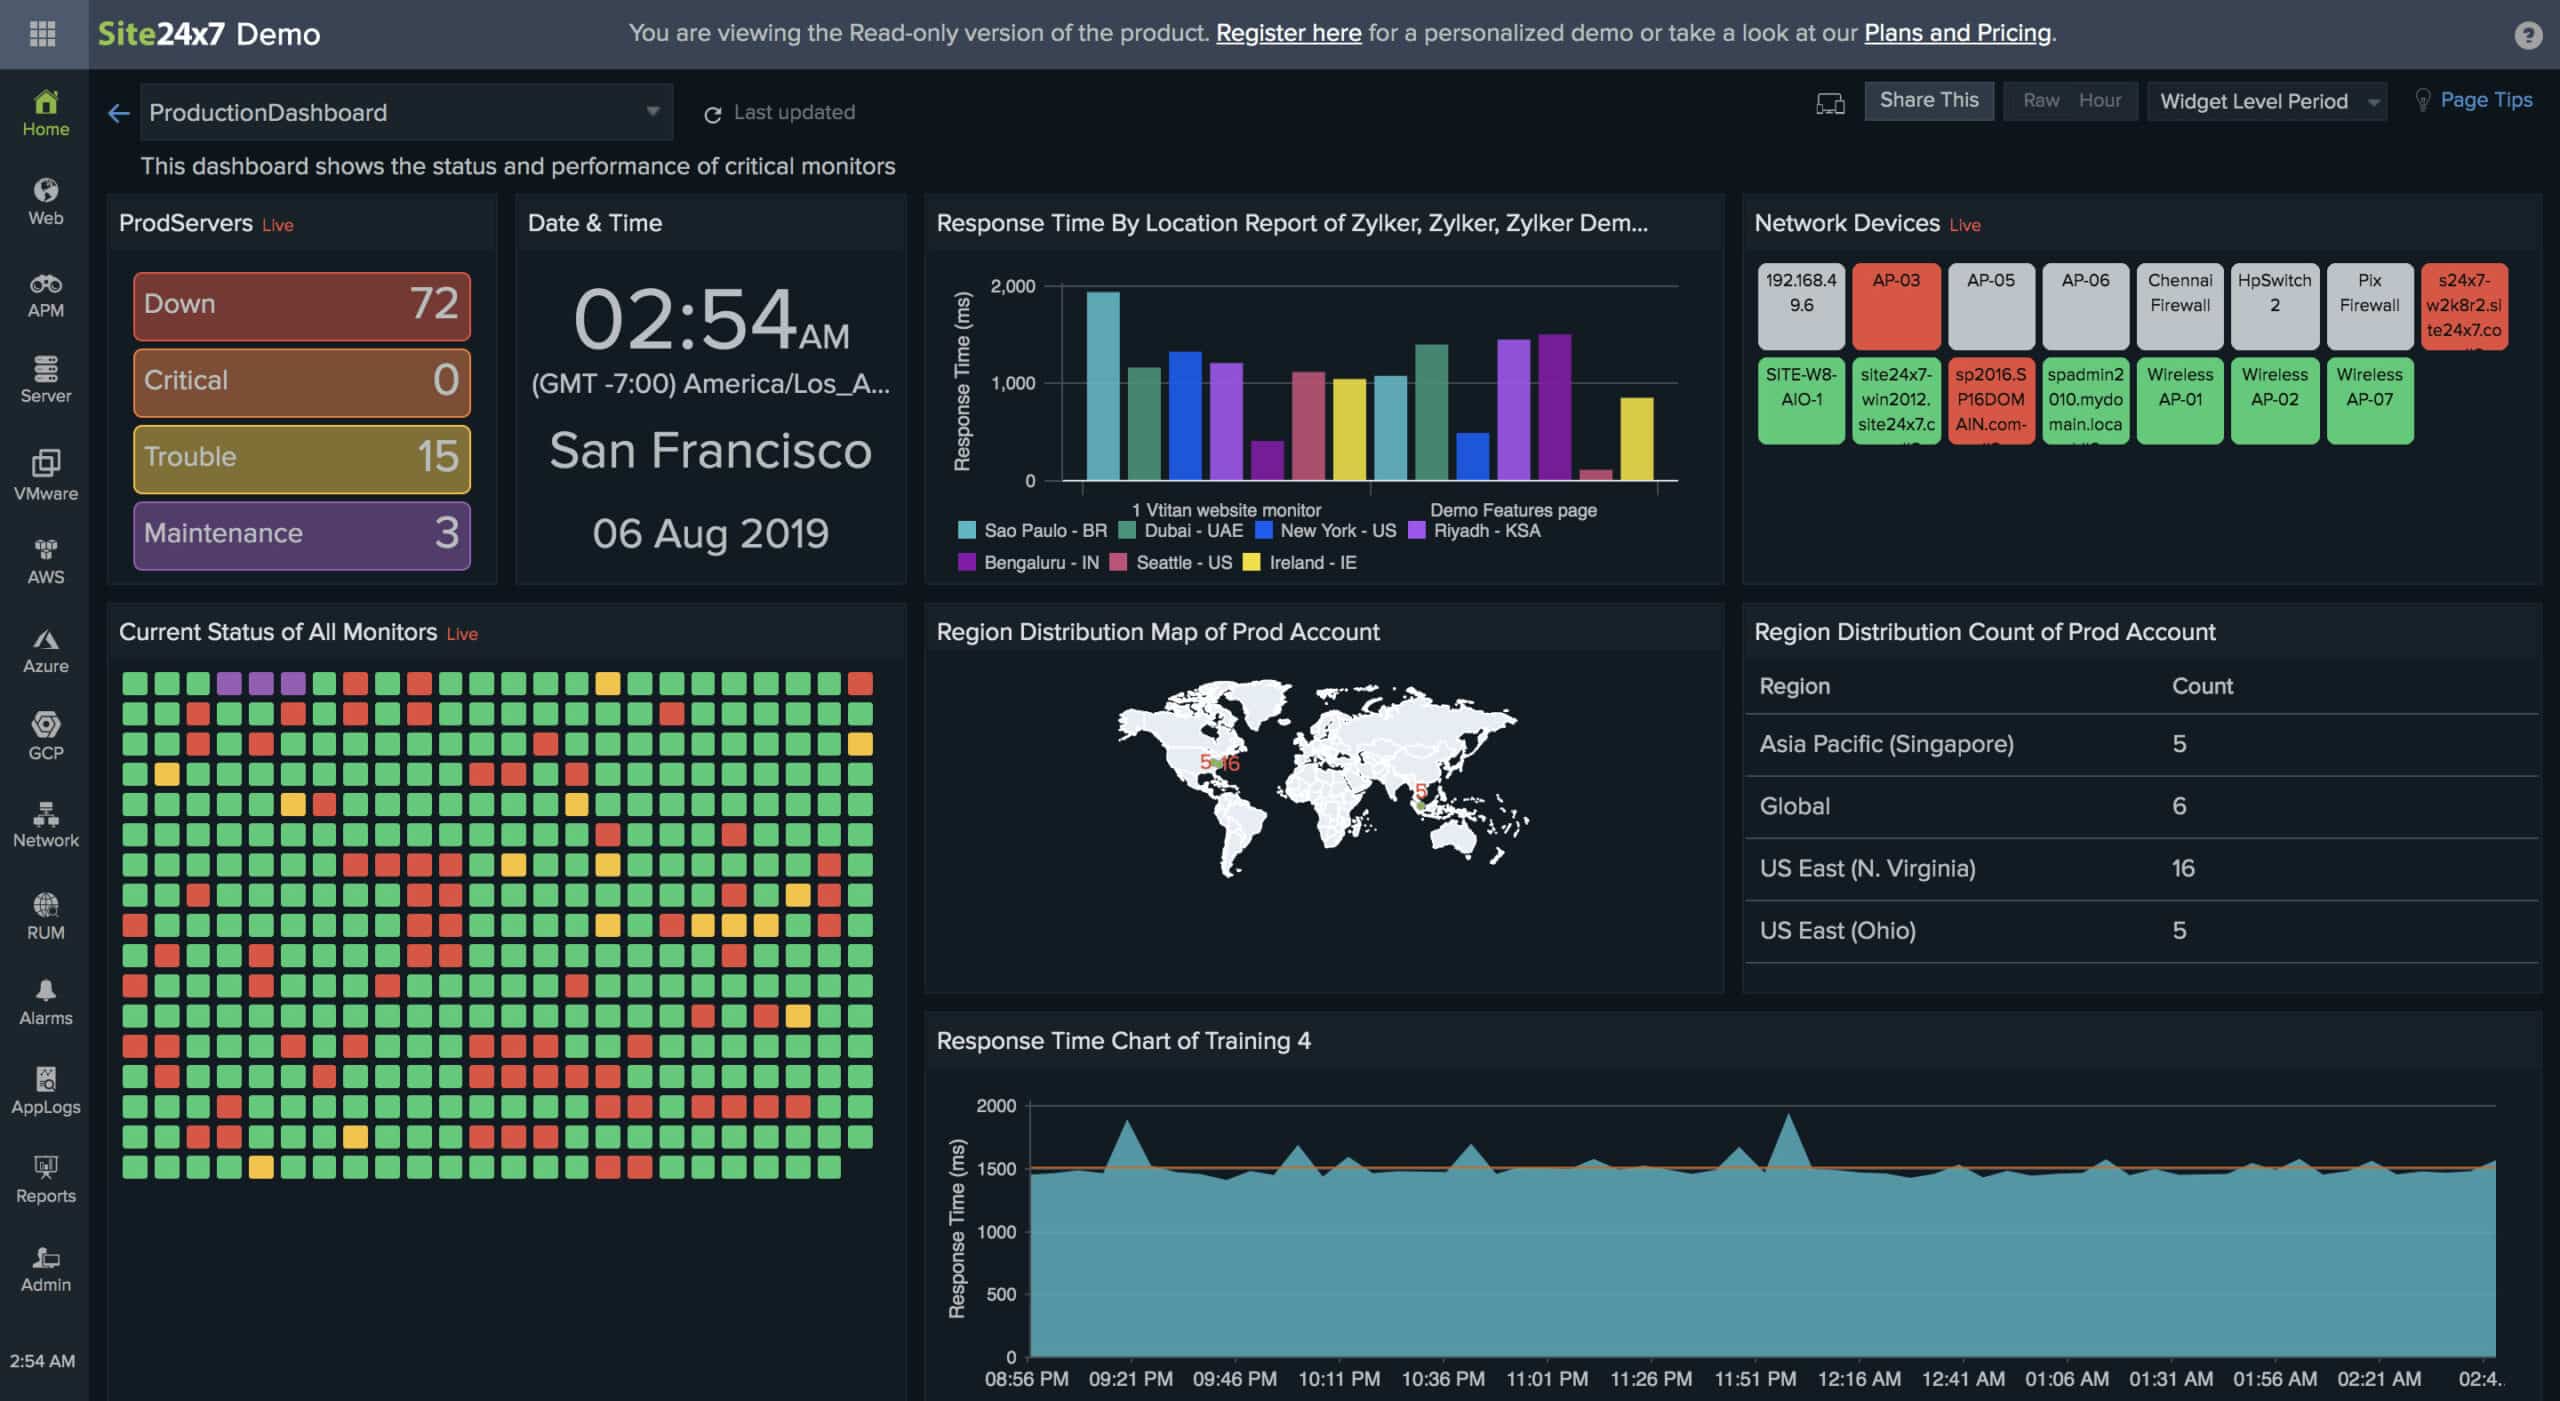
Site24x7’s Storage Monitoring is a cloud-based solution built for those who need clear visibility into storage performance, capacity, and availability. It’s a solid fit for large-scale organizations like enterprises or MSPs. The tool brings together infrastructure monitoring across storage systems, servers, and networks, all on a single dashboard. Site24x7 simplifies SAN monitoring thanks to its real-time alerts and customizable dashboards. Plus, it offers the flexibility to scale across thousands of devices.
Key Features:
- Supports all SNMP-enabled SANs with custom tracking.
- Built-in support for NetApp, HP, Dell EMC, and Synology.
- Set custom alerts and export detailed reports.
- Track disk failures, I/O, cache age, and iSCSI/FCP ops live.
Why do we recommend it?
We recommend Site24x7 simply because it brings clarity to complex SAN environments. While hands-on testing Site24x7, the tool was able to quickly flag early signs of disk failure and generate accurate historical reports for capacity planning. We were also able to maintain performance visibility across hybrid setups, Its alerting engine is also quite strong. It pinpoints issues with impressive precision. And last but not least, we also recommend this tool for its versatility (covering storage, cloud, servers, apps, and more). This makes it a smart long-term investment for your IT department looking to reduce tool sprawl.
Who is it recommended for?
Ideal for SMBs and enterprises looking for unified hybrid monitoring. It is also great for MSPs managing client storage from one dashboard. With built-in SLA tracking, it’s a smart fit for regulated industries like healthcare and finance.
Pros:
- Unified monitoring across storage, network, and cloud—all in one place
- Custom real-time alerts that actually stay relevant
- Works with most major vendors using ready-to-go templates
Cons:
- Setup can feel overwhelming at first, especially for new users
Site24x7 Storage Monitoring is cloud-based (no OS dependency). It offers a 30-day free trial for its Storage Monitoring solution. So, if you’re looking for a cloud-native tool that can help you monitor SAN devices alongside your full IT stack, this platform is definitely worth exploring.
4. ManageEngine OpManager Nexus (FREE TRIAL)
ManageEngine OpManager Nexus, formerly OpManager Plus, is a full-stack monitoring platform that includes SAN monitoring. It analyzes multiple related metrics like disk utilization, storage capacity, RAID health, and device performance, and accordingly, assesses the performance of your SAN devices. More importantly, it correlates this data with your servers, networks, and applications for a holistic view.
Key Features:
- Supports 30+ storage vendors with out-of-the-box templates for quick onboarding.
- Monitors SAN-specific metrics, like IOPS, throughput, latency, and disk usage in real time.
- Detects hardware issues.
- Correlates data to pinpoint bottlenecks.
Why do we recommend this tool?
We recommend this tool for its SAN-specific tracking and evaluation. It tracks latency, throughput, and IOPS to provide information about the performance and availability of your SAN devices. It also detects hardware issues by monitoring the fan, power supply, ports, and drive health. Together, all this information can give you an accurate idea of how your SAN devices are performing, so you can make informed decisions.
More importantly, you can forecast the storage needs before investing. Its AI-driven forecasting avoids disruptions while its historical growth patterns reduce inefficiencies. All this tracking gives you granular control over your critical storage infrastructure.
Another aspect we like is the audit-ready reports that show information about usage, performance, and storage trends. This information reduces the possibility of under or overprovisioning in your environment.
Who is it recommended for?
It is recommended for organizations with large storage requirements and those using SAN from multiple vendors. It is also a good choice if you hold large amounts of data. OpManager Nexus can be a handy tool for organizations with strict compliance requirements.
Pros:
- Automatically discovers and monitors SAN fabric switches.
- Integrates with ITSM tools.
- Comes with automated alerts and escalations.
Cons:
- May have a learning curve for some users.
OpManagaer Nexus starts at $1,233 for 50 devices if you go for the Professional editions, and $19,995 for 1000 devices in the Enterprise edition. Start a 30-day free trial.
5. IntelliMagic Vision for SAN

IntelliMagic Vision for SAN Storage and Fabric is a storage management system that is able to supervise multi-vendor implementations of SAN. A big problem with SAN systems is that each storage device has its own monitoring tool and it is difficult to aggregate data for several storage servers. The IntelliMagic unifies storage supervision and can even cover several locations on different sites from a SaaS-based system.
Key Features:
- Multi-vendor SAN supervision
- AI-based traffic pattern analysis
- Capacity planning tool
- Cloud-based or on-premises deployment options
Why do we recommend it?
IntelliMagic Vision for SAN is a versatile and advanced tool that integrates AI processes for managing SAN servers, ideal for multi-location, multi-vendor environments.
Customers can choose between a cloud-based implementation of the IntelliMagic system or take the software for the monitor on-premises. The on-premises version operates as a virtual appliance and runs over a VMWare hypervisor. It is able to reach out to SAN installations across the network and monitor the performance of each device in the fabric.
The IntelliMagic system has two key elements. One tracks all activity on the storage devices and also on other devices on the network to track traffic patterns. This establishes regular patterns of behavior, using an AI-based machine learning technique. This enables the service to raise an alert if traffic patterns suddenly surge, which could be an indicator of suspicious behavior.
Exceptional activity can also interfere with the other main feature of IntelliMagic, which is a capacity planning tool. This measures the amount of available space on the system, segments that by location, and then identifies the traffic volumes of data flowing to those storage points. This enables the IntelliMagic system to calculate the number of days that current storage space will last before it needs to be expanded.
Who is it recommended for?
Suitable for large organizations requiring a sophisticated, AI-integrated SAN management system that can adapt to various deployment environments.
Pros:
- Advanced AI-based monitoring and analysis
- Effective for multi-vendor SAN management
- Comprehensive capacity planning capabilities
Cons:
- Pricing information is not readily available
The IntelliMagic Vision for SAN system is a flexible tool that enables network managers to squeeze value out of storage resources. You can request a quote for pricing.
6. Nagios XI

Nagios XI is one of the most well known network monitoring platforms in the world, but many administrators forget it also functions incredibly well as a SAN management tool. All you need to do to start SAN monitoring through Nagios is download additional plugins. Plugins such as Check SAN Switch Health (checks overall health of SAN switches) and Check HP MSA P2000 (which checks the status of components within the SAN) help create a complete SAN monitoring experience.
Key Features:
- Extensive range of SAN monitoring plugins
- Customizable GUI
- Automated capacity planning graphs
- Open-source network monitoring
Why do we recommend it?
Nagios XI, with its customizable plugins, offers a flexible and extendable solution for SAN monitoring, making it an adept choice for large enterprises.
The sheer variety of plugins available allows you to extend the basic functionality of Nagios to act as a comprehensive SAN monitoring suite. Outside of its capability as a SAN, Nagios is also an adept networking monitoring platform. You can customize the layout of the GUI to help you to gain transparency over your network.
Who is it recommended for?
Ideal for network administrators looking for an open-source, customizable solution with extensive plugin support for SAN monitoring.
Pros:
- Effective for large-scale SAN monitoring
- Capacity planning features for scalability
- Well-established network monitoring platform
Cons:
- Requires additional plugin downloads for full SAN functionality
Nagio’s capacity planning features are incredibly useful when monitoring SANs. For example, you can create automated capacity planning graphs to help you identify how to scale your network storage. This feature makes it ideal for network administrators monitoring infrastructure for a large enterprise. Nagios is available for $1,995 (£1,476) and can be downloaded here.
7. SolarWinds Storage Resource Monitor

SolarWinds has developed a name for itself as one of the most prolific providers of network management solutions and is no exception. SolarWinds Storage Resource Monitor has been designed from the ground up as a tool to help provide full transparency over SANs.
Key Features:
- Multi-vendor storage solution monitoring
- Highlights latency and performance issues
- Generates performance and capacity reports
- SAN Management Performance Monitoring
Why do we recommend it?
SolarWinds Storage Resource Monitor offers a comprehensive and user-friendly tool for full transparency and monitoring of SANs, making it ideal for large-scale network infrastructures.
The program allows you to view storage objects throughout your network and point to signals of poor performance or storage failure. For example, latency is highlighted in red if it’s lacking in performance. Alerts flag up when a LUN or RAID group suffers performance problems. Alerts are just the tip of the iceberg; you can generate reports such as Top 10 LUNS by latency or a capacity summary. These reports are invaluable to administrators looking to manage a large network infrastructure. You can also use the built-in SAN Management Performance Monitoring solution to forecast future usage and to conduct capacity planning.
Who is it recommended for?
Best suited for enterprises needing a detailed and scalable solution for SAN monitoring and capacity planning.
Pros:
- Comprehensive multi-vendor storage monitoring
- Real-time alerts and detailed reporting
- Capacity forecasting and planning tools
Cons:
- Price may be high for SMEs
Overall, SolarWinds Storage Resource Monitor is a great package for enterprises that require clear oversight of their systems. While SME’s might not need this extensive range of features, the scalability of the platform means it will meet the needs of most organizations. SolarWinds Storage Resource Monitor is available for $2,995 (£2,304).
8. SevOne

While the SevOne platform doesn’t have the most compelling GUI, it makes up for this in terms of its monitoring facilities. In SevOne you can manage your SAN storage from an overhead perspective and generate capacity reports to help detect when storage needs an upgrade. SevOne also has Custom Calculations, which add storage values from different devices together to provide you with a more accurate picture of how much space you have available.
Key Features:
- Overhead management of SAN storage
- Generates capacity reports
- Custom Calculations for aggregated storage values
- Comprehensive outage and uptime reporting
Why do we recommend it?
SevOne provides extensive and visually intensive monitoring capabilities, ideal for managing SAN storage and generating insightful capacity reports.
SevOne’s monitoring abilities are extensive and visually intensive. You can receive a report on outages and uptime across all of your network devices. This helps to cut straight to the core question of whether storage is up and running or incurring problems. You can monitor server CPUs, memory, switch ports, and host bus adapters, which help drill down deeper into storage performance.
Who is it recommended for?
Suitable for organizations requiring detailed monitoring and reporting on SAN storage performance and capacity.
Pros:
- Visual reports for clear understanding
- Custom Calculations for accurate storage insights
- Detailed reporting on outages and uptime
Cons:
- User interface may seem dated compared to other tools
If you look beyond the dated GUI, this is an excellent SAN monitoring tool. In order to use SevOne for enterprise, either request a demo or contact the sales team for more information.
9. AppDynamics Storage Performance Monitoring
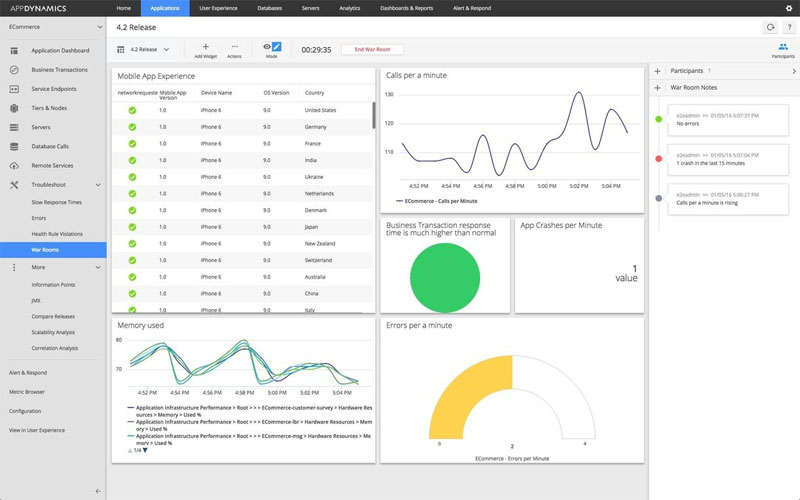
For mid-sized organizations, AppDynamics Storage Performance Monitoring is a competitive offering. Users can monitor their network storage right down to individual nodes, servers, and databases. In terms of network monitoring, AppDynamics offers a Unified Monitoring service. This is made up of a number of services such as Real User Monitoring, Database Monitoring, and Server Monitoring. This cross section helps build a complete view of your network and storage devices.
Key Features:
- Detailed node, server, and database monitoring
- Real-time performance data
- In-depth storage resource analysis
Why do we recommend it?
AppDynamics Storage Performance Monitoring offers in-depth monitoring down to individual storage components, making it a comprehensive choice for mid-sized organizations.
Who is it recommended for?
Best for mid-sized organizations that need detailed monitoring of storage resources across their network.
Pros:
- Detailed monitoring of individual storage components
- Real-time data for quick decision-making
- Suitable for a range of storage resources
Cons:
- Less specialized in SAN monitoring compared to some competitors
Even though AppDynamics can function as a SAN monitoring solution, it doesn’t have the depth that products like SolarWinds Storage Performance Monitor do. This is unfortunate as Storage Performance Monitoring carries a premium price tag of $3,300 to start. If you’re looking for a SAN solution, then you might want to pass in favor of a more specialist platform like SolarWinds Management Performance Monitoring. That being said, AppDynamics remains a good choice if you want to use it for broader storage resources. AppDynamics also offers a 15 day free trial that can be downloaded here.
10. PowerAdmin Storage Monitor

If you want a more specialist SAN monitoring solution, PowerAdmin Storage Monitor is definitely worth consideration. This solution was built completely with storage management in mind and acts as a platform to manage your network health 24/7. You can monitor your CPU usage, memory, and network devices from user one interface. If you want to monitor multiple sites, use distributed monitoring to view storage in a remote location.
Key Features:
- Specialized in storage management
- Monitors CPU usage, memory, and network devices
- Predictive disk usage feature
- Customizable reporting capabilities
Why do we recommend it?
PowerAdmin Storage Monitor is a specialized tool for storage management, offering comprehensive monitoring capabilities and predictive analytics for future planning.
Storage Monitor’s geographical flexibility makes it a solid alternative for companies looking to manage storage solutions across multiple sites. Another useful feature is predictive disk usage, which helps to anticipate when you need to upscale your IT infrastructure. For many users, this is the entire reason behind using SAN in the first place.
PowerAdmin doesn’t stop there. The platform doesn’t skimp on reporting features and allows the user to create customized reports. These are useful for breaking down current storage status and capacity planning for the future. The combination of these features helps make Storage Monitor one of the best platforms on this list.
Who is it recommended for?
Ideal for companies managing storage solutions across multiple sites, needing a tool with geographical flexibility and predictive capabilities.
Pros:
- Dedicated to storage management
- Geographical flexibility for multi-site monitoring
- Customizable reports for detailed insights
Cons:
- May lack broader network monitoring features
PowerAdmin offers a range of different pricing options to its users. The cheapest is PA Storage Monitor License, which is $24 each for licenses 20 to 49. This storage scale increases and you can pay $4 each for 1000 to 1999. You can download a free trial for 30 days here.
11. EG Innovations

While other platforms make take a more indirect approach towards storage management, EG Innovations cuts straight to the point. On the dashboard you are shown a breakdown of your “Infrastructure Health” from launch. Green bars indicate components with a healthy status and red denotes unhealthy services. This cuts out any unnecessary distractions and tells you immediately if your storage is experiencing any issues.
Key Features:
- Infrastructure Health dashboard
- Color-coded monitoring for quick status assessment
- Customizable reporting by function and component
Why do we recommend it?
EG Innovations provides a streamlined and efficient SAN monitoring experience, with a focus on immediate health status recognition and customizable reporting.
Along the top of the user interface, health status is compiled into a larger bar showing the percentage of network components that are up and running.
The lean design of the user interface makes this platform a good choice for mid to large-size enterprises. It shows everything you need to monitor storage without having to click through endless menus. In the event that you require more depth, you can make use of reports as well. Reports can be generated by function, component, service, zone, and segment.
Who is it recommended for?
Best for mid to large-size enterprises looking for a tool with a lean design and immediate health status updates.
Pros:
- Immediate insight into infrastructure health
- Easy-to-understand color-coded system
- Customizable reporting for detailed analysis
Cons:
- May lack some advanced features of more specialized tools
A variety of versions of EG Innovations are available but you’ll have to request a quote in order to find out more information. A free trial can be downloaded from here.
12. Broadcom SAN Health Diagnostics Capture
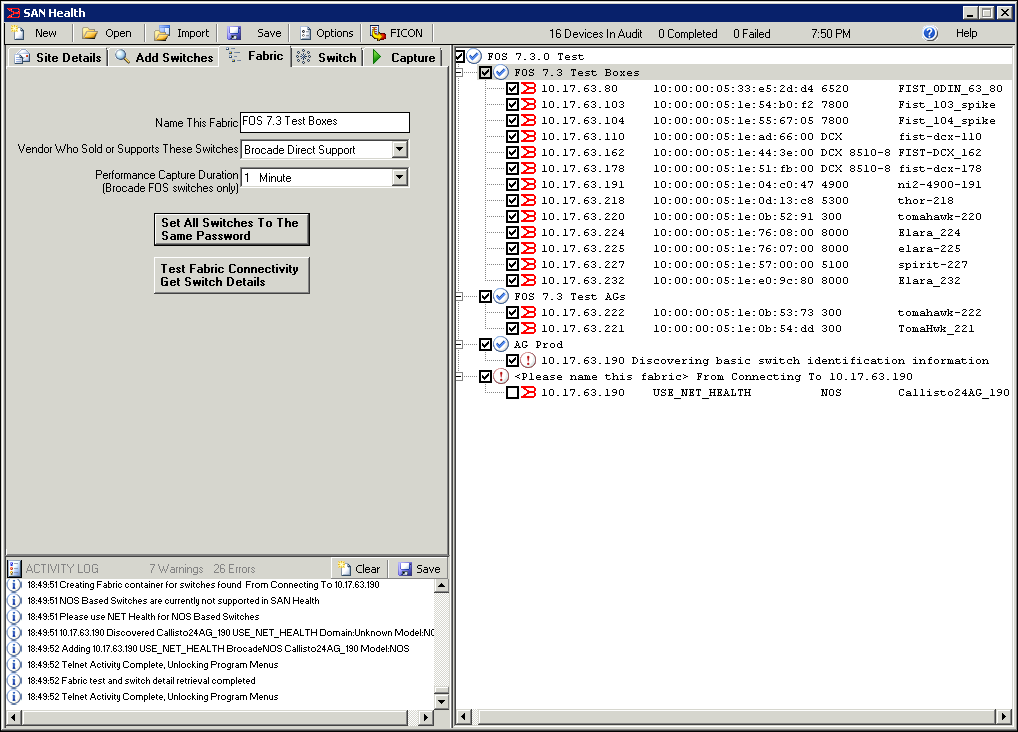
One of the lesser known specialist SAN monitoring platforms is Broadcom’s SAN Health. With SAN Health you can record inventory devices and data on the historical performance of your SANs. SAN Health’s biggest value lies in its ability to help you refine your SAN strategy. It provides the information needed to efficiently identify faults and performance issues. You can view diagrams of your SAN switches, ports, and fabrics for closer inspection.
Key Features:
- Historical performance recording
- SAN strategy refinement tools
- Detailed diagrams of SAN components
- Specialized SAN health checks
Why do we recommend it?
Broadcom SAN Health is a specialized SAN monitoring tool, excellent for detailed analysis and strategic planning of SAN infrastructure.
Who is it recommended for?
Ideal for organizations looking for a focused and detailed approach to SAN monitoring and strategic planning.
Pros:
- In-depth SAN performance recording
- Detailed component diagrams for thorough analysis
- Specialized in SAN health checks
Cons:
- Less comprehensive in broader network monitoring aspects
- Not as well-known as some other tools, potentially affecting user support and resources
This platform is a great SAN monitoring solution. As a specialist solution, it inevitably lacks some of the broader features offered by companies like ManageEngine, but the depth of its SAN features make it a compelling storage monitoring platform.
Track SAN and NAS systems
NAS is “network-attached storage” and if you are just at the point of deciding on your new storage solution, you might get this configuration and “storage-attached networks” mixed up.
A storage-attached network is a high-performance link between a server and a storage device. That network can connect several servers to one storage devices or one server to several storage devices. It can also connect several servers to a series of specialized storage devices.
Network-attached storage features a file server, which sends data over the network to other devices, which may be endpoints or may be other servers. So, with a NAS, you are interfacing to a server front end to storage, and with SAN, you are monitoring the links between servers and storage devices.
Whichever of these storage topologies you opt for, all of the eight SAN monitoring tools listed in this guide will work well for you because they all also have NAS monitoring abilities.
SAN: Scalable Storage
As a storage solution, SAN systems are difficult to beat in an enterprise environment. Once a network reaches a certain size, it is important to consider the use of SAN tools to upscale storage in line with future needs. SAN monitoring solutions like SolarWinds Storage Resource Monitor bring transparency to the heart of your storage strategy. Without a SAN monitoring platform, it can be challenging to oversee every device.
Ultimately, the better you understand how your network works, the better you can modify storage to meet your needs. Most traditional storage devices take their toll on CPU and network performance, but a SAN is the exception. While you’re more likely to see larger organizations incorporate SAN systems, as prices decline and the needs of smaller organizations grow, we can expect to see these tools adopted across the market.
When implementing a SAN solution, it’s a good idea to consider appointing a specific storage administrator. This ensures you have someone to oversee your storage strategy and make sure your capacity planning is on point. This way you won’t run out of space when you’re desperately in need.