Ever stop to think about the impact a server failure can have on your network? Servers are one of the pillars of modern networks but they can be tricky to maintain. Using database monitoring tools is essential for managing databases and queries to maintain optimal performance.
With a database monitor, you can monitor the performance of servers and databases in real-time in a format that’s easy to read.
Here is a list of the best database monitoring tools:
- ManageEngine Applications Manager EDITOR’S CHOICE Server and application monitoring solution. It includes out-of-the-box support for MS SQL, MySQL, Oracle, IBM Informix, IBM DB2, Sybase, and PostgreSQL. Download a 30-day free trial.
- Paessler PRTG Network Monitor (FREE TRIAL) Network monitoring tool that can monitor Microsoft SQL, MySQL, PostgreSQL, and Oracle SQL servers. The software can also autodiscover servers. Access a 30-day free trial.
- Site24x7 Infrastructure (FREE TRIAL) A server monitoring system that also supervises all of the applications that support user interfaces, including database instances. This is a cloud-based service. Access a 30-day free trial.
- ManageEngine EventLog Analyzer (FREE TRIAL) A comprehensive log auditing and management tool that can be used to monitor Microsoft SQL, MySQL, Oracle, and IBM DB2 databases. It provides instant alerts into causes for quick remediation. Start a 30-day free trial.
- Nagios XI – Network and infrastructure monitoring tool that can monitor MySQL, Microsoft SQL Server, Postgres, Oracle, and DB2 databases. It includes configuration wizards to help the user configure the software.
- RedGate SQL Monitor – An SQL performance monitor that allows you to monitor database performance through a single pane of glass. It includes a customizable alert system.
- SolarWinds Database Performance Analyzer A database monitoring tool that can monitor query performance in real-time for Azure, SQL Server, Oracle, MySQL, DB2, SAP ASE, and AWS.
- eG Enterprise – Infrastructure monitoring tool that can monitor database performance. The software can monitor workload, configuration, queries, I/O operations, deadlocks, and more.
- AppDynamics – Application performance monitoring solution that can find the root cause of suboptimal database performance. It supports SQL Server, MySQL, PostgreSQL, Oracle, and DB2.
- Dynatrace – A cloud monitoring solution that monitors database performance. It automatically discovers databases and provides visibility of resource-intensive SQL statements.
Our methodology for selecting database monitoring tools:
We’ve broken down our analysis for you based on these key criteria:
- Capability to monitor a variety of database systems including SQL Server, Oracle, MySQL, etc.
- Real-time performance monitoring with a focus on anomaly detection and machine learning.
- Efficient alerting systems to notify about potential issues.
- Comprehensive dashboard with displays on SQLs, applications, waits, users, and historic performance.
- User-friendly interface for easy identification of performance bottlenecks and resolution of issues.
The Best Database Monitoring Tools
1. ManageEngine Applications Manager (FREE TRIAL)

ManageEngine Applications Manager is an application and database monitoring tool that monitors performance in real-time. This tool supports databases including Microsoft SQL, Oracle, MySQL, PostgreSQL, MongoDB, and more.
Key Features:
- Monitors databases like SQL, Oracle, MySQL.
- Customizable dashboards.
- Detailed metrics like CPU and memory utilization.
Why do we recommend it?
ManageEngine Applications Manager is recommended for its detailed monitoring capabilities, offering extensive metrics and customizable dashboards for various databases.
You can monitor your database through customizable dashboards. The performance data you can collect is very detailed. For example, you monitor details such as CPU utilization, memory utilization, query performance, user sessions, system errors, user errors, resource pools, buffer cache details, and more. The depth of the information provided is useful for pinpointing the root cause of sluggish performance.
Who is it recommended for?
Best for businesses that require in-depth monitoring and analysis of database performance across multiple platforms.
Pros:
- Wide range of database support.
- Highly detailed performance data.
- Customizable monitoring dashboards.
Cons:
- Free version is limited to five applications/servers.
There are three versions: Free, Professional, and Enterprise. The Free version can monitor up to five applications or servers. The Professional version starts at $945 (£731) with support for 25 monitors. The Enterprise version starts at a price of $9,595 (£7,422) for 250 monitors. Download the free trial version.
EDITOR'S CHOICE
ManageEngine Applications Manager is our top pick for a database monitoring tool because it covers a long list of database types, big data systems, and key value stores. The big-name RDBMSs on the list of Applications Manager capabilities include SQL Server, MySQL, PostgreSQL, Oracle, and MariaDB. The package will also monitor NoSQL systems, such as MongoDB, Apache Cassandra, and Couchbase. You can monitor the in-memory Memcached system with this tool and the Redis key-value store. The databases that you monitor with the Applications Manager can be hosted on your own servers or on the AWS, Azure, and Oracle Cloud platforms. When looking at database performance, you also need to examine the demand that higher applications place on those data stores. Another important task is to watch the server resources on which your database relies and ensure that they don’t run out, causing the database to hang or crash. The ManageEngine system lays the groundwork for instant root cause analysis by detecting the interdependencies between applications and also the requirements of databases and other applications from server services. Luck favors the prepared and the Applications Manager’s research lets you discover performance issues and recover from them quickly.
Download: Get a 30-day FREE Trial
Official Site: https://www.manageengine.com/products/applications_manager/download.html
OS: Windows Server, Linux, AWS, and Azure
2. Paessler PRTG Network Monitor (FREE TRIAL)

Paessler PRTG Network Monitor is a network monitoring and database monitor that can manage multiple databases including Oracle SQL, Microsoft SQL, MySQL, PostgreSQL. It monitors the performance of databases and displays the execution time of requests on the dashboard.
Key Features:
- Monitors Oracle SQL, Microsoft SQL, MySQL, PostgreSQL.
- Sensors for detailed performance metrics.
- Customizable alerts system.
Why do we recommend it?
PRTG Network Monitor is recommended for its versatility in monitoring multiple databases and its detailed sensor-based approach for performance metrics.
You can use sensors to view more detailed information on database performance. Sensors provide you with additional metrics for each database. For example, there are sensors for MySQL, Microsoft SQL v2, Oracle SQL v2, and PostgreSQL. Each sensor shows you a different set of metrics through dials. For instance, through the PostgreSQL sensor, you can monitor essential details including the execution time of the request, the execution time of the query, the number of affected rows, and downtime.
Following up on performance issues is easy with PRTG’s alerts system. Whenever a database performs poorly or isn’t functioning then the program sends you a notification. Alerts come in a range of formats including email, SMS, and push notifications. You can also create custom notification scripts to automatically respond through the PRTG API.
Who is it recommended for?
Suited for organizations needing a comprehensive monitoring tool that can handle various databases with detailed insights.
Pros:
- Wide range of database sensors.
- Free for up to 100 sensors.
- Versatile alerts options.
Cons:
- Cost increases with more sensors needed.
Paessler PRTG is free for users who require less than 100 sensors. From there upwards the software has a scalable pricing model ranging from $1600 (£1,237) for 500 sensors and one server installation up to $60,000 (£46,412) for unlimited sensors and five server installations. You can download a 30-day free trial.
3. Site24x7 Infrastructure (FREE TRIAL)
Site24x7 Infrastructure is a monitoring system for servers and the services and applications that support front-end systems. That includes databases. Site24x7 is a cloud-based platform that includes modules that monitor a range of IT resources. Each module can be enhanced by “integrations.” These are free vendor-specific plugins that expand service and there are a number of these that monitor database management systems. These are:
- MySQL
- Oracle
- MongoDB
- Postgres
- VoltDB
- CouchDB
- DB2
- Cassandra
- ClickHouse
All of the processing for Site24x7 Infrastructure occurs in the cloud and the console for the service can be accessed from anywhere with any standard Web browser. The screens for database monitoring all come with a standard layout but any of them can be customized through drag-and-drop widgets.
Key Features:
- Cloud-based platform.
- Monitors various databases: MySQL, Oracle, MongoDB, etc.
- Performance threshold alerts.
Why do we recommend it?
Site24x7 Infrastructure is recommended for its cloud-based, comprehensive database monitoring capabilities and its ability to monitor a wide range of database systems.
The Site24x7 system requires that an agent program be installed on the system that is being monitored. This collects statistics and uploads them to the server for processing. One account can manage many database instances and they don’t all have to be in the same location or of the same brand.
Database monitoring is performed from within each database instance and in the environment that runs it. The service reports on SQL query efficiency and looks at the execution of each transaction. The system is able to link together the supporting services of the server operating system with the actions occurring within the database. This enables it to identify system resource shortages and indicate the possible underlying cause of any database performance issues.
The database monitor sets performance thresholds on database transaction goals and utilization levels on resources. When a threshold is crossed, the system raises an alert and sends out notifications to key staff via SMS or email. This automates the monitoring of normal operations and only requires the involvement of staff when problems arise and need to be fixed.
Who is it recommended for?
Ideal for organizations seeking a scalable, cloud-based solution for diverse database monitoring needs.
Pros:
- Extensive database support.
- Cloud-based flexibility.
- Customizable dashboards.
Cons:
- Requires installation of an agent program.
Site24x7 Infrastructure is a subscription service and it can be enhanced by extra add-on services, such as network monitoring. The functions of the Infrastructure module can also be accessed by subscribing to the All-in-one package, which bundles together all of the Site24x7 system administration tools. Get started with a 30-day free trial .
4. ManageEngine EventLog Analyzer (FREE TRIAL)

ManageEngine EventLog Analyzer is a log management tool that helps you proactively audit database activity logs across multiple databases. This tool gathers and analyzes logs to provide insights into issues and anomalies in the database. The results are displayed on an intuitive dashboard for easy understanding.
Key Features:
- Monitors changes to tables, user permissions, server logons, and other security events.
- Sends real-time alerts when critical events occur.
- Detects external threats to databases.
- Ensures compliance with data privacy regulations.
Why do we recommend it?
We recommend ManageEngine EventLog Analyzer for hassle-free database auditing. It securely collects and stores logs in a centralized location and analyzes them for detailed insights about security events, user activities, permission changes, and anything else that could lead to database compromises or downtime. It can also help detect cyberattacks, like SQL injection attempts and denial-of-service attacks.
A standout aspect for us is its intuitive dashboards and reports that depict the analyzed data in a way that everyone can understand. The reports are also well-structured and help meet the compliance requirements of leading compliance frameworks.
Who is it recommended for?
It is a good choice for database engineers, security and compliance teams, and MSPs who are responsible for maintaining the health and security of databases.
Pros:
- Works well on all popular database servers.
- Generates extensive reports.
- Prevents database-related cyberattacks.
- Sends real-time alerts.
Cons:
- Customization and advanced features may require technical expertise.
EventLog Analyzer offers custom pricing. Download a 30-day free trial.
5. Nagios XI
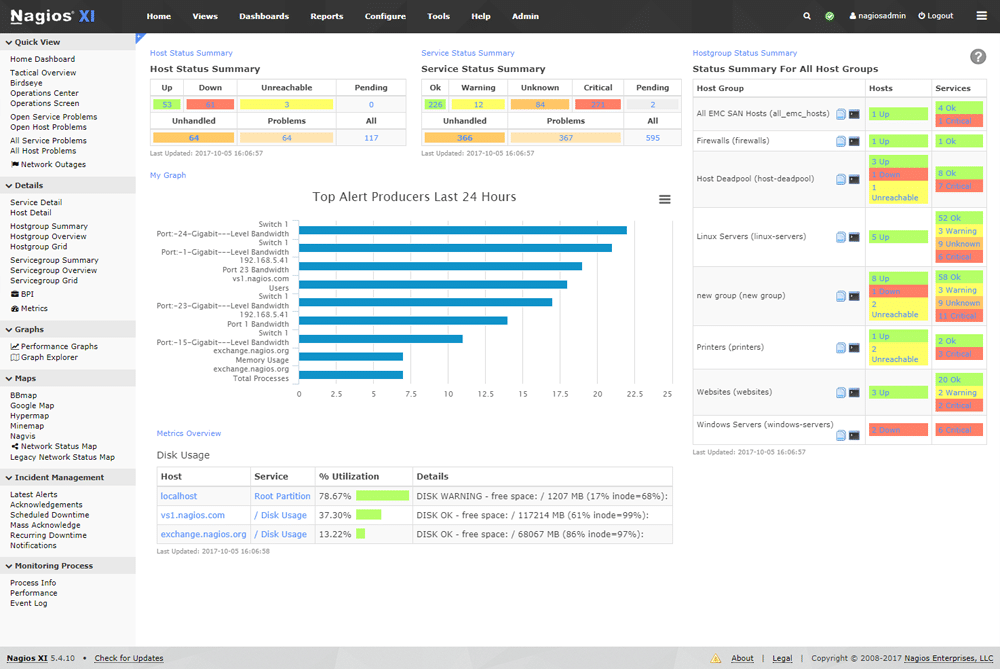
Nagios XI is an infrastructure monitoring tool and database monitoring platform with monitoring for MySQL, Microsoft SQL Server, PostgreSQL, Oracle, and DB2. It monitors database performance for information such as availability, database, table sizes, and cache ratios.
Key Features:
- Monitors MySQL, Microsoft SQL Server, PostgreSQL, etc.
- Customizable with Nagios Exchange plugins.
- Performance monitoring for database and table sizes, cache ratios.
Why do we recommend it?
Nagios XI is recommended for its flexibility and customization options, allowing monitoring of various database performance metrics.
However, if the standard features don’t match your needs the Nagios Exchange has additional plugins you can use as well. For example, there is a Postgres Query Monitoring Wizard plugin and a MySQL Server Wizard plugin to make your monitoring more specific to your environment.
Who is it recommended for?
Best for organizations that value customization and are looking for a tool that can be tailored to their specific database monitoring needs.
Pros:
- Highly customizable.
- Broad database support.
- Extensive plugin options.
Cons:
- Might require technical expertise for customization.
The price of Nagios XI depends on the number of nodes you wish to support. A 100 node license starts at $1,995 (£1,512). The price goes up to $11,995 (£9,278) for 1000 nodes or $19,995 (£15,467) for an unlimited node license. You can download the free trial.
6. Redgate SQL Monitor (Redgate SQL Toolbelt)

Redgate SQL Monitor is an SQL monitoring tool that is part of Redgate SQL Toolbelt. From the dashboard, you can monitor the performance and status of databases and servers through a range of visual displays. Performance charts allow you to view performance fluctuations over time.
Key Features:
- Monitors performance and status of databases and servers.
- Intelligent baselines for pinpointing issues.
- 55 customizable alerts.
Why do we recommend it?
Redgate SQL Monitor is recommended for its detailed monitoring and alerting capabilities, particularly suited for identifying and troubleshooting slow queries.
Identifying slow queries is easier than many other platforms. You can monitor the performance of individual database queries to find slow queries and performance deadlocks. Once you’ve found a problem you can use intelligent baselines to pinpoint the root cause.
To aid the rapid discovery of performance problems the monitor has 55 customizable alerts. You can create your own alert conditions for long-running queries and view them through the Grouped inbox. The program sends alerts through email, Slack, PagerDuty, and SNMP traps.
Who is it recommended for?
Ideal for enterprises focusing on SQL databases, needing advanced tools for performance monitoring and problem resolution.
Pros:
- In-depth query performance monitoring.
- Effective alerting system.
- User-friendly interface.
Cons:
- Primarily tailored for SQL databases.
Redgate SQL Monitor is suitable for enterprises using databases on-premises or in the cloud. A license starts at a price of $1,565 (£1,210) and allows you to monitor one server, five Azure SQL databases, one cluster node, and one virtual machine. You can download the 14-day free trial.
7. SolarWinds Database Performance Analyzer
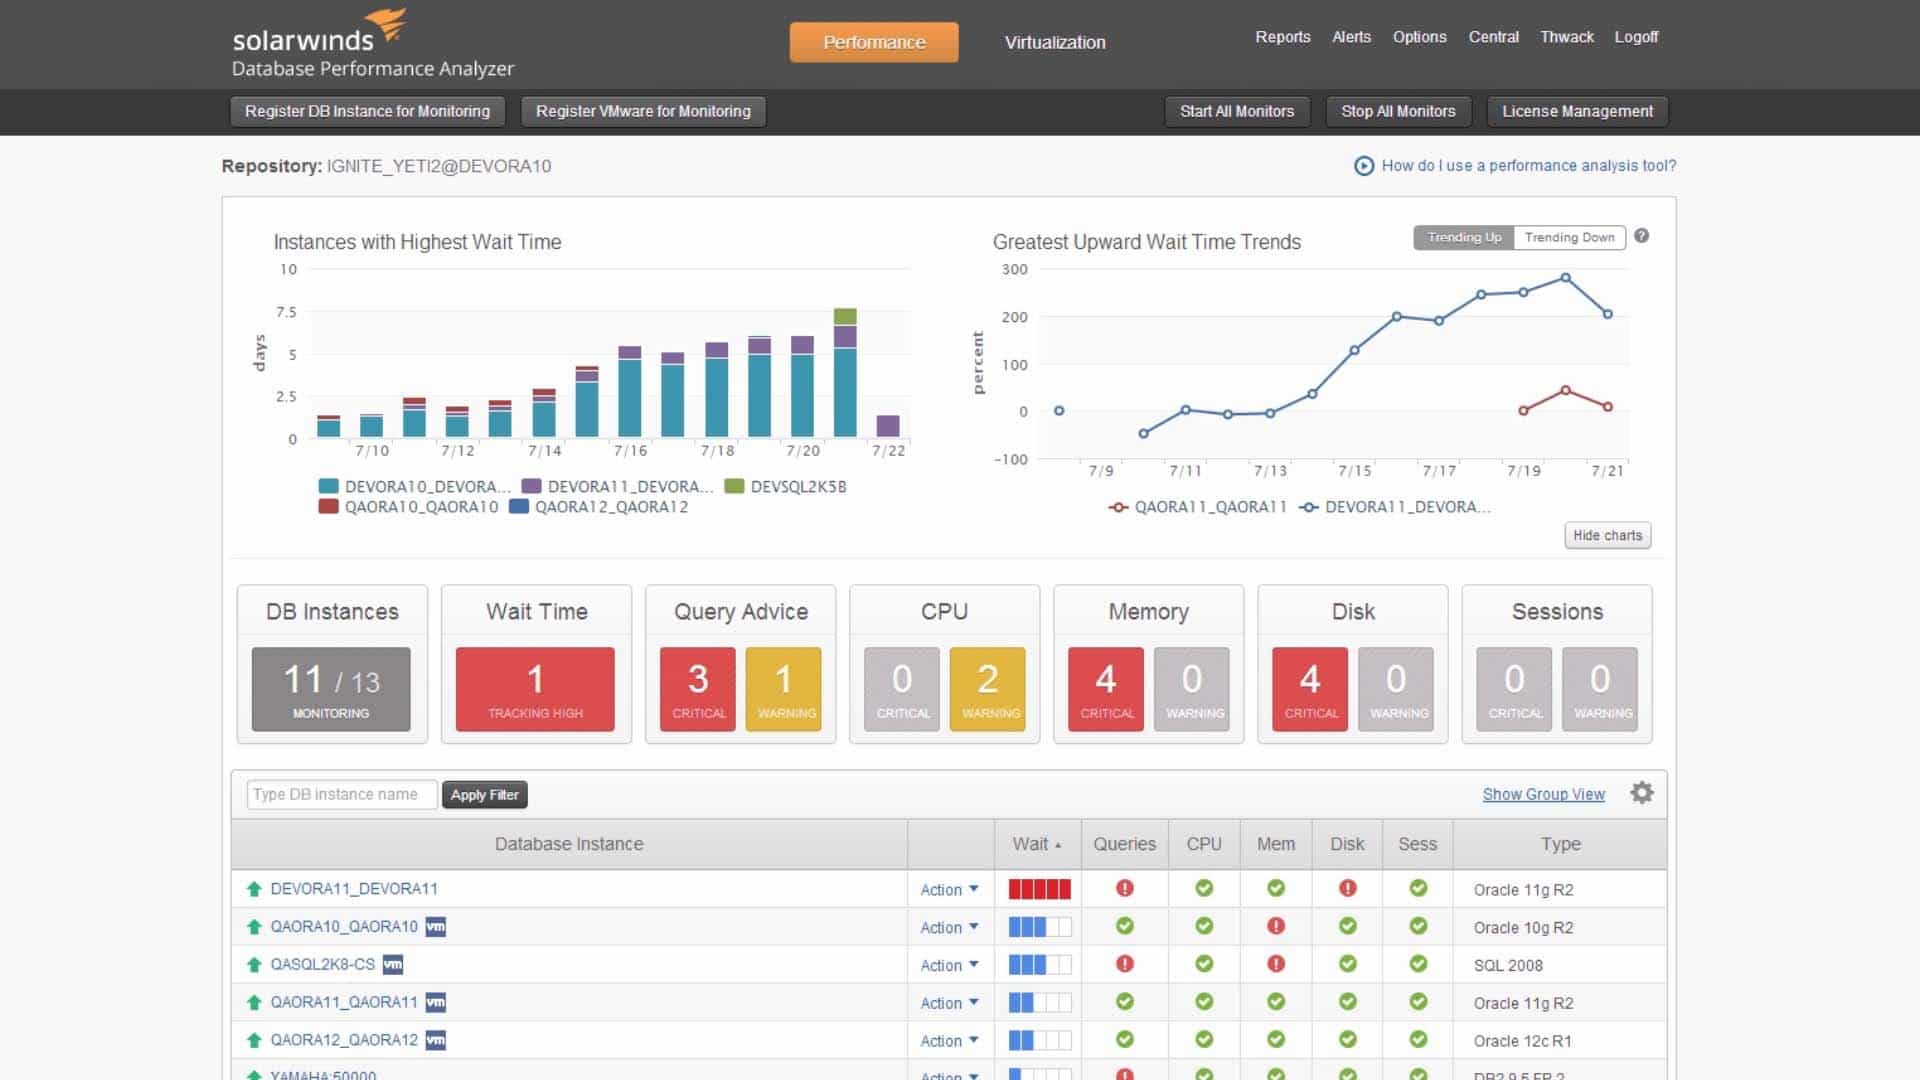
SolarWinds Database Performance Analyzer for SQL Server is a database monitoring tool that can monitor database performance in real-time. It supports SQL Server, Microsoft Azure, Oracle, MySQL, DB2, AWS, and more.
Key Features:
- Real-time monitoring for SQL Server, Azure, Oracle, MySQL, DB2, AWS.
- Anomaly detection with machine learning.
- Visual dashboard for SQLs, applications, waits, users.
Why do we recommend it?
SolarWinds Database Performance Analyzer is recommended for its ability to monitor a wide range of databases in real-time, using anomaly detection and machine learning to pinpoint performance issues effectively.
The platform uses anomaly detection and machine learning to find the root cause of performance issues. Anomaly detection compares historic performance limits with current activity and detects deviations that could indicate a problem. Alerts notify you to take further action so you can resolve the root cause.
Through the dashboard, you can monitor visual displays on SQLs, applications, waits, users, historic performance, and more. The information screen helps you to diagnose why databases are performing slowly and identify issues like performance bottlenecks.
Who is it recommended for?
Ideal for organizations seeking a comprehensive and user-friendly tool for monitoring diverse database environments.
Pros:
- Supports multiple database types.
- Advanced anomaly detection.
- Detailed and intuitive dashboard.
- Advanced AI-powered monitoring and alerts
Cons:
- Pricing may be a barrier for smaller organizations.
SolarWinds Database Performance Analyzer is a great choice for organizations looking for a simple database monitoring experience. The software starts at a price of $2,045 (£1,581.90). You can download the free trial.
8. eG Enterprise
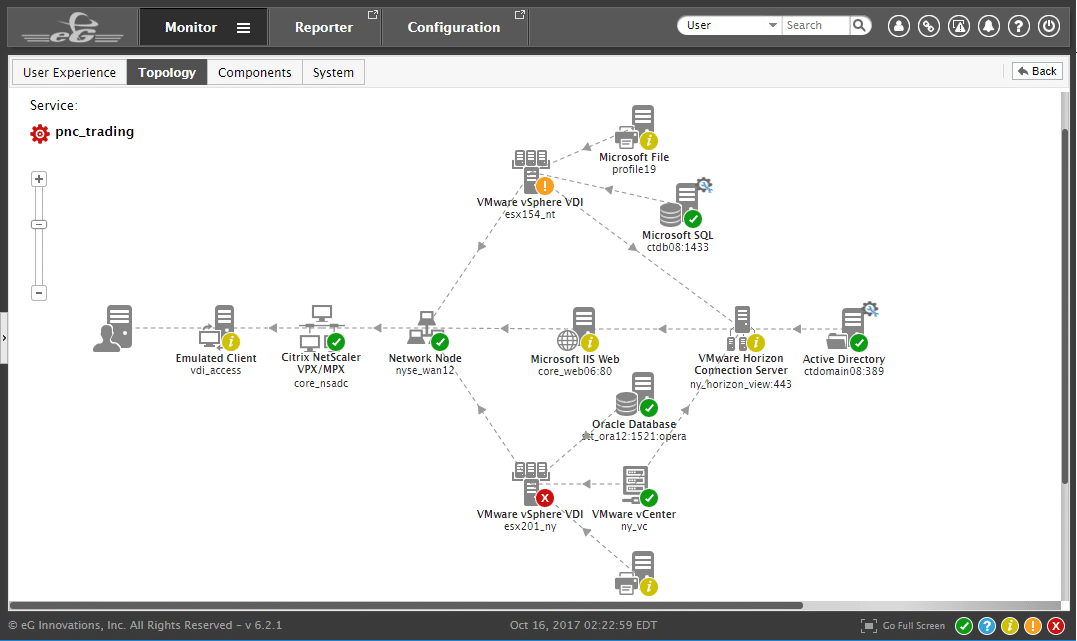
eG Enterprise is an infrastructure and database monitoring tool. Through eG Enterprise you can view database performance, top queries by CPU, top queries by disk I/O, deadlocks, log and space usage, configurations, workload, and more. The software is compatible with Microsoft SQL, PostgreSQL, MySQL, Oracle, Sybase, and more.
Key Features:
- Compatible with Microsoft SQL, PostgreSQL, MySQL, Oracle, etc.
- Automated root-cause analysis.
- Customizable dashboards.
Why do we recommend it?
eG Enterprise is recommended for its comprehensive monitoring capabilities and automated analysis, making it suitable for diverse database environments.
When monitoring Microsoft SQL databases the user can track the real-time utilization of the database and highlight applications that use a disproportionate SQL server resources. There is also an automated root-cause analysis, which pinpoints the root cause of slow databases. For Oracle databases, eG Enterprise has real-time performance analysis.
Monitoring data can be viewed through the dashboard. Dashboards are customizable so users can change the information they see depending on their requirements. Once you’ve finished using the dashboard you can create a report to share your findings with other employees.
There are five versions of eG Enterprise available: Easy Evaluation, Perpetual License, Subscription, SaaS, and Audit Service. The Easy Evaluation is limited to one user with five servers and comes free of charge. The Perpetual License supports unlimited users and servers for $10,000 (£7,735) upwards.
Who is it recommended for?
Best for businesses that require a robust tool for in-depth monitoring and analysis across multiple database types.
Pros:
- Extensive database compatibility.
- Automated analysis features.
- Customizable viewing options.
Cons:
- Pricing and version options can be complex.
The Subscription version is the same but starts at $300 (£232) per month. The SaaS and Audit Service versions are based in the cloud and in a virtual machine and come with a custom price tag. You can download the free trial.
9. AppDynamics
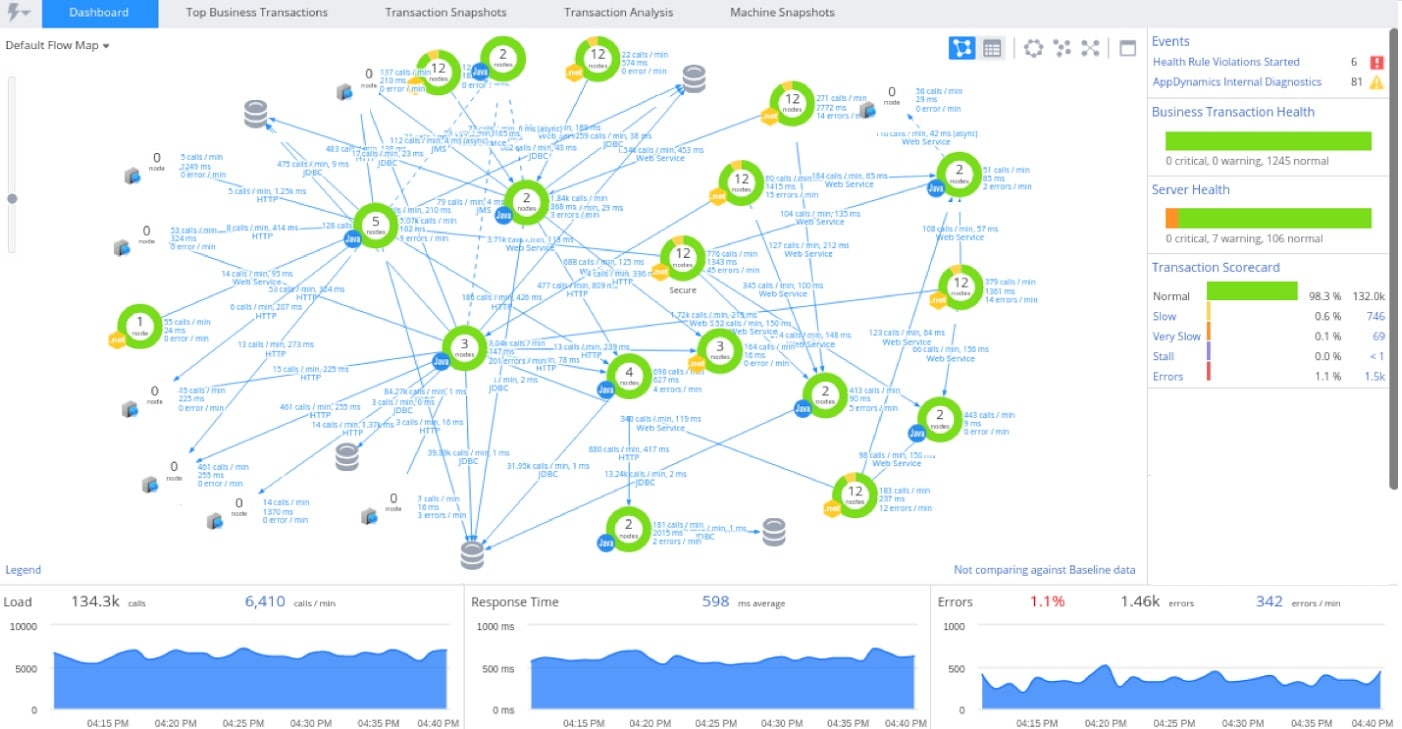
AppDynamics is an agentless application and database performance monitoring tool that can monitor databases. It supports SQL Server, MySQL, Postgres, Oracle, MongoDB, and DB2 databases.
Key Features:
- Supports SQL Server, MySQL, Postgres, Oracle, etc.
- Detailed monitoring of users, SQL objects, wait states.
- Customizable alert system.
Why do we recommend it?
AppDynamics is recommended for its agentless architecture and comprehensive monitoring capabilities for a variety of databases.
Through the GUI you can monitor data on top users, SQL objects, execution plans, wait states, schema statistics, user sessions, change events, and more. These metrics help you detect and troubleshoot slow response times.
There is also a customizable alert system. The user can configure alerts or use the alerts that configure out-of-the-box. Alerts come in the form of email and SMS messages. With the Alert and Respond API the user can also configure customer automated actions to respond to performance issues.
Who is it recommended for?
Ideal for companies seeking an easy-to-deploy solution for monitoring multiple database types.
Pros:
- Agentless and easy to deploy.
- Detailed performance metrics.
- Versatile alerting options.
Cons:
- Pricing information not readily available.
The agentless architecture of AppDynamics makes the tool a good fit for companies who want a solution that’s easy to deploy. The software can be installed in a matter of minutes. To view the pricing information you will have to contact the company directly. You can start the 15-day free trial.
10. Dynatrace

Dynatrace is a cloud monitoring and database monitoring tool that can automatically detect databases using Java, .NET, PHP, and NodeJS. It can monitor MySQL, Oracle DB, PostgreSQL, SQL Server, and Redis. The platform provides real-time visibility into database performance right down to SQL-statements. You can view expense and slow-performing statements.
Key Features:
- Monitors MySQL, Oracle DB, PostgreSQL, SQL Server, Redis.
- Real-time visibility down to SQL-statements.
- Customizable alerts.
Why do we recommend it?
Dynatrace is recommended for its cloud-based monitoring capabilities, offering real-time insights into database performance at a granular level.
In the Live view section, you can view a list of sessions/users, top wait states, top slow queries, and locks. There are also customizable alerts that you can adjust the thresholds to detect anomalous database performance.
When database performance goes outside of normal usage then the program issues an alert with details on the root cause. You can then create a report to share performance issues with the rest of your team.
Who is it recommended for?
Best suited for organizations looking for a cloud-based solution to monitor database performance comprehensively.
Pros:
- Cloud-based, real-time monitoring.
- Detailed SQL-statement analysis.
- Customizable alerting system.
Cons:
- Pricing requires direct inquiry
If you’re looking for cloud-based database monitoring tools then Dynatrace is worth a try. To view the pricing information for Dynatrace you will have to request a quote from the company directly. You can start the 15-day free trial.
Making Database Monitoring Easy
Enterprises that want to optimize database performance must have a database monitoring platform. Database monitoring tools show you when performance is lacking right down to the query level. Having a tool ready to help you find the root cause is invaluable for keeping your data available when you need it.
Systematically addressing performance issues will not only improve how the database functions but also reduce the risk of the database going down. The best way to find performance problems is to adopt a platform that not only provides great visibility but offers configurable alerts so you can respond effectively.
Database monitoring software like Paessler PRTG Network Monitor, and ManageEngine all provide deep visibility into performance at an affordable rate. It’s a good idea to try out a handful of tools to see what software is the best fit for your environment.