Monitoring tools, also known as observability solutions, are used to keep a check on the state of essential IT applications, networks, infrastructures, and websites, among other things. The finest IT monitoring systems discover resource problems immediately and alert the appropriate people to tackle the major issues. Observability solutions are used by response teams to acquire real-time insights regarding resource availability, stability, and performance.
Here is our list of the best mainframe monitoring tools:
- ManageEngine OpManager EDITOR’S CHOICE This package is well known as a network and server monitoring package but it is also able to monitor IBM zSeries mainframes. Runs on Windows Server, Linux, AWS, and Azure. Get a 30-day free trial.
- Site24x7 (FREE TRIAL) One of the best monitoring tools supporting IBM AIX systems. It brings real-time metrics and automation to mainframe-class infrastructure. Obtain a 30-day free trial.
- ManageEngine OpManager Nexus (FREE TRIAL) A full-stack observability platform that provides actionable insights into the performance of all your devices and applications, including mainframes. Start a 30-day free trial.
- Datadog Infrastructure Monitoring Its visualizations make it straightforward to spot problems like ineffective searches or bottlenecks that arise during peak traffic periods.
- BMC Automated Mainframe Intelligence (AMI) The BMC provides the speed of deployment required by application development teams without sacrificing the safeguards needed to keep the Db2 database stable and available
- Rocket TMON for z/OS The heart of the live performance tracking system is the Rocket-TMON Health Monitor. When problems develop, it seeks to give a root cause analysis trail.
- Pandora FMS This full-stack monitoring package provides routines for collecting performance data from IBM zSeries mainframes via a plug-in. Available as a SaaS platform or for on-site hosting on Linux or Docker.
- Intellimagic Vision for z/OS A monitoring package for zSeries mainframes that tracks activity and capacity. This is a cloud-based SaaS package.
The Best Mainframe Monitoring Tools
Infrastructure difficulties are unavoidable, and teams must use the best IT monitoring solutions available to minimize the impact of an outage. In this article, we’ll look at some of the best observability tools that response teams may utilize to speed up the detection and resolution of incidents. The top IT monitoring solutions keep a constant eye on crucial resources.
1. ManageEngine OpManager (FREE TRIAL)
ManageEngine OpManager is able to monitor IBM mainframes and servers. It tracks activities and resource utilization on IBM zSeries mainframes and many server types, including AIX. The package isn’t limited to monitoring IBM hardware – it can monitor devices provided by other brands alongside IBM mainframe monitoring.
Key Features:
- IBM zSeries mainframe monitoring
- IBM server monitoring
- Server monitoring for all major brands
- Network device monitoring
- Alerts for resource shortages
Why do we recommend it?
ManageEngine OpManager is a large package of IT hardware monitoring systems. This includes the monitoring of network devices, such as switches, routers, and firewall appliances. You also get server and mainframe monitoring with this system. All of your hardware will be monitored simultaneously, which sets up instant root cause analysis when problems arise.
The OpManager system includes a discovery and documentation service. This runs continuously but it is particularly important when you first install the monitoring software. The discovery process identifies all of the hardware that is connected to your network and it lists each device in an inventory.
The entire OpManager monitoring dashboard is based around the device list in the inventory and if you make any changes to the hardware on the network, the system automatically updates that list. The package will also generate a network topology map, based on the information in the inventory. So, whenever the device list is updated, the topology map will automatically change.
The mainframe monitoring services in the OpManager package look at all of the key processes in z/OS and the zSeries mainframe architecture. The service records the full capacity of all resources on the mainframe and then tracks utilization, raising an alert if that activity approaches full capacity usage.
Who is it recommended for?
This package is suitable for businesses of all sizes. There is a Free edition available but this only monitors three devices. The lowest paid package is reasonably priced and it covers 25 devices, which includes IBM mainframes. There is also an edition of OpManager for managed service providers.
Pros:
- Mainframe, server, network device, and VM monitoring
- Can also monitor cloud platforms, such as AWS and Azure
- Network discovery that notes all changes to the devices on the network
- System documentation through an inventory and network topology map
- Predictive alerts for rising resource shortages
Cons:
- Although the software is available for cloud platforms, this isn’t a SaaS package
ManageEngine offers three paid editions for OpManager and each of them caters to a different size category of business. The top plan can monitor multiple sites from one location. In addition, there are the Free edition and the MSP edition. The software for OpManager runs on Windows Server, Linux, AWS, and Azure and you can get it on a 30-day free trial.
EDITOR'S CHOICE
ManageEngine OpManager is our top pick for a mainframe monitoring tool because it also watches over your network and, if you have them, servers. This provides root cause analysis if performance suddenly drops. The system generates an alert that explains where the problem lies, so technicians can take evasive actions before the performance impairment gets bad enough for the users to notice.
Download: Download a 30-day FREE Trial
Official Site: https://www.manageengine.com/network-monitoring/download.html
OS: Windows Server, Linux, AWS, and Azure
2. Site24x7 (FREE TRIAL)

Site24x7 is a cloud-based monitoring platform that supports IBM AIX systems alongside other server and network environments. It delivers real-time performance metrics, proactive alerts, and AI-based forecasting through a single web-based dashboard. This makes it a practical choice for teams managing legacy systems within modern hybrid infrastructures.
Key Features:
- Finds AIX servers and adds them to one dashboard.
- Tracks real-time performance metrics.
- Sends AI-powered alerts to prevent issues.
Why do we recommend it?
Site24x7 makes AIX monitoring feel modern again. It auto-discovers devices, tracks system health in real-time, and gives you crisp, readable graphs. The AI-powered alerts always stand out. You get the best AI features like anomaly detection and forecasting, which help spot patterns and prevent slowdowns before they happen. Alerts can also be fine-tuned to match your environment, and you can even automate responses to common problems.
Site24x7 also plays well with tools like Slack, Teams, and Jira. With such integrations, it becomes easier for you to manage alerts across your existing workflow. You also get process-level data, which you can use to quickly see which apps or services are using up your system’s resources. That’s useful when you need to find the root of a slowdown.
Everything is available from one clean interface, regardless you are keeping track of your AIX servers, cloud workloads, or just any network gear. And since it’s all cloud-based, there’s no complex or big setup—just install the agent and you’re up and running fast.
Who is it recommended for?
Most AIX admins have to deal with recurring resource bottlenecks (e.g., memory spikes, zombie processes). Site24x7 is perfect for this. It allows them to map automation templates that can restart services or just kill rogue processes. But in general, we recommend this AIX monitoring tool for enterprise IT teams and service providers. It’s a strong fit for hybrid or legacy-to-cloud environments looking for a full unified observability.
Pros:
- All-in-one monitoring for AIX, cloud, network, and apps
- Fast setup with auto-discovery
- Custom alerts and integrations for quick response
- AI forecasting catches issues early
Cons:
- Some features are complex for new users
Site24x7 offers three pricing tiers for different business needs. The Pro plan at $35/month is ideal for small businesses, with 40 monitors and essential tools. The Classic plan, priced at $89/month, suits growing SMEs with 100 monitors. For large enterprises, the Enterprise plan starts at $225/month (with advanced features). Site24x7 supports IBM AIX as well as Windows, Linux, Solaris, and macOS environments. It is entirely cloud-based and comes with a fully featured 30-day free trial for hands-on evaluation.
3. ManageEngine OpManager Nexus (FREE TRIAL)
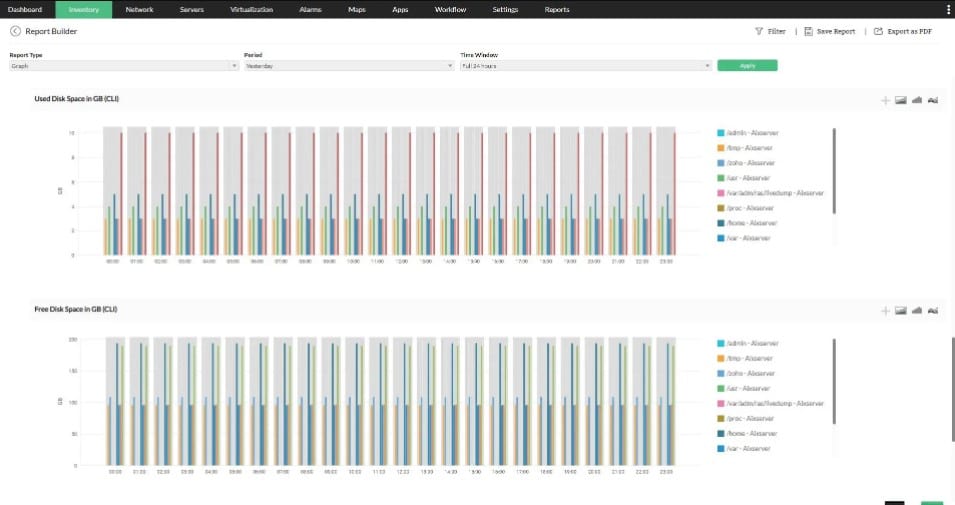
ManageEngine OpManager Nexus, formerly OpManager Plus, is an ITOps platform that continuously monitors the performance of applications and provides insights into any potential bottlenecks. With such a proactive approach, you can identify and fix issues before they disrupt your operations.
Key Features:
- Provides code-level insights to optimize resource allocation.
- Distributed transaction tracing.
- Real user monitoring.
- Apdex graphs for tracking end-user transactions.
- Detailed charts and reports.
Why do we recommend it?
We recommend OpManager Nexus because it can provide the required control and visibility over your applications’ performance. It works well across mixed environments, making it a good choice for organizations that need contextual insights in relation to the wider infrastructure. Its unified console also provides all the information you need through a central dashboard.
A standout capability is its apdex graphs, which track critical end-user transactions. These graphs can identify anomalies and help fix them quickly. Along with these graphs, the distributed tracing identifies application slowdowns across different locations. All this contextual information can help you quickly identify the root cause, so you can troubleshoot effectively.
Who is it recommended for?
OpManager Nexus is recommended for organizations that have mixed environments, as it helps to gain insights about mainframe applications in relation to the overall infrastructure.
Pros:
- Monitors real user experience.
- Detects anomalies and their root cause.
- Optimizes resource allocation.
- Generates detailed reports.
Cons:
- Initial setup can require technical expertise.
The annual subscription cost of OpManager Nexus starts at $1,233 for 50 devices for the Professional edition. On the other hand, the starting price is $19,9995 for 1000 devices for the Enterprise edition. Start a 30-day free trial.
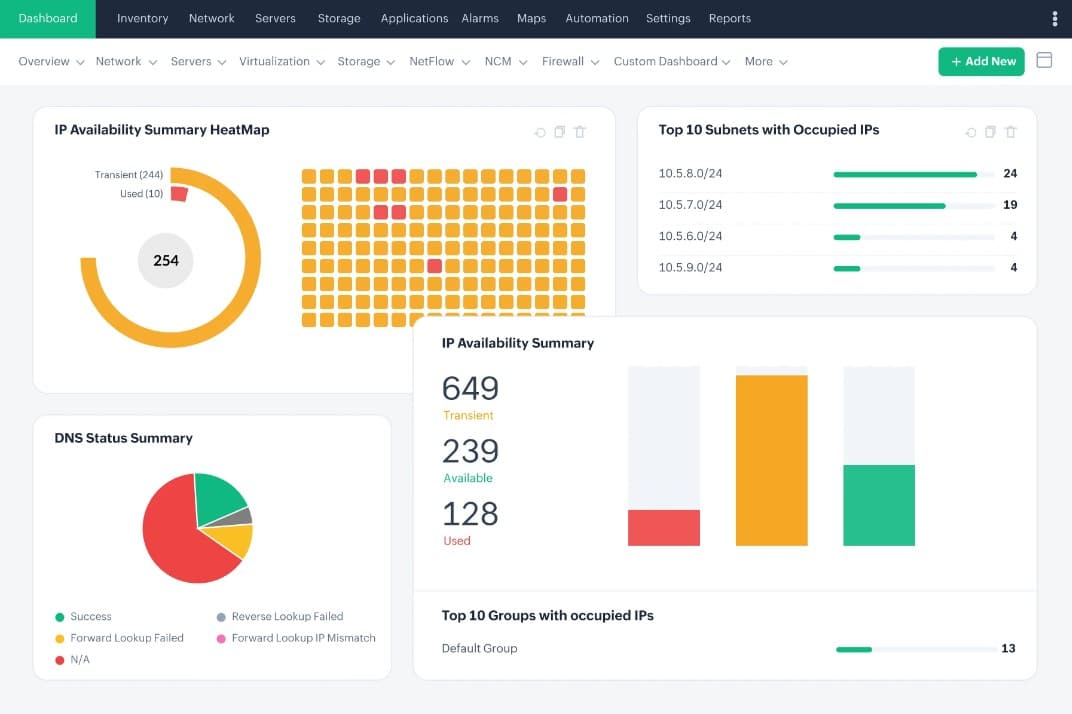
4. Datadog Infrastructure Monitoring
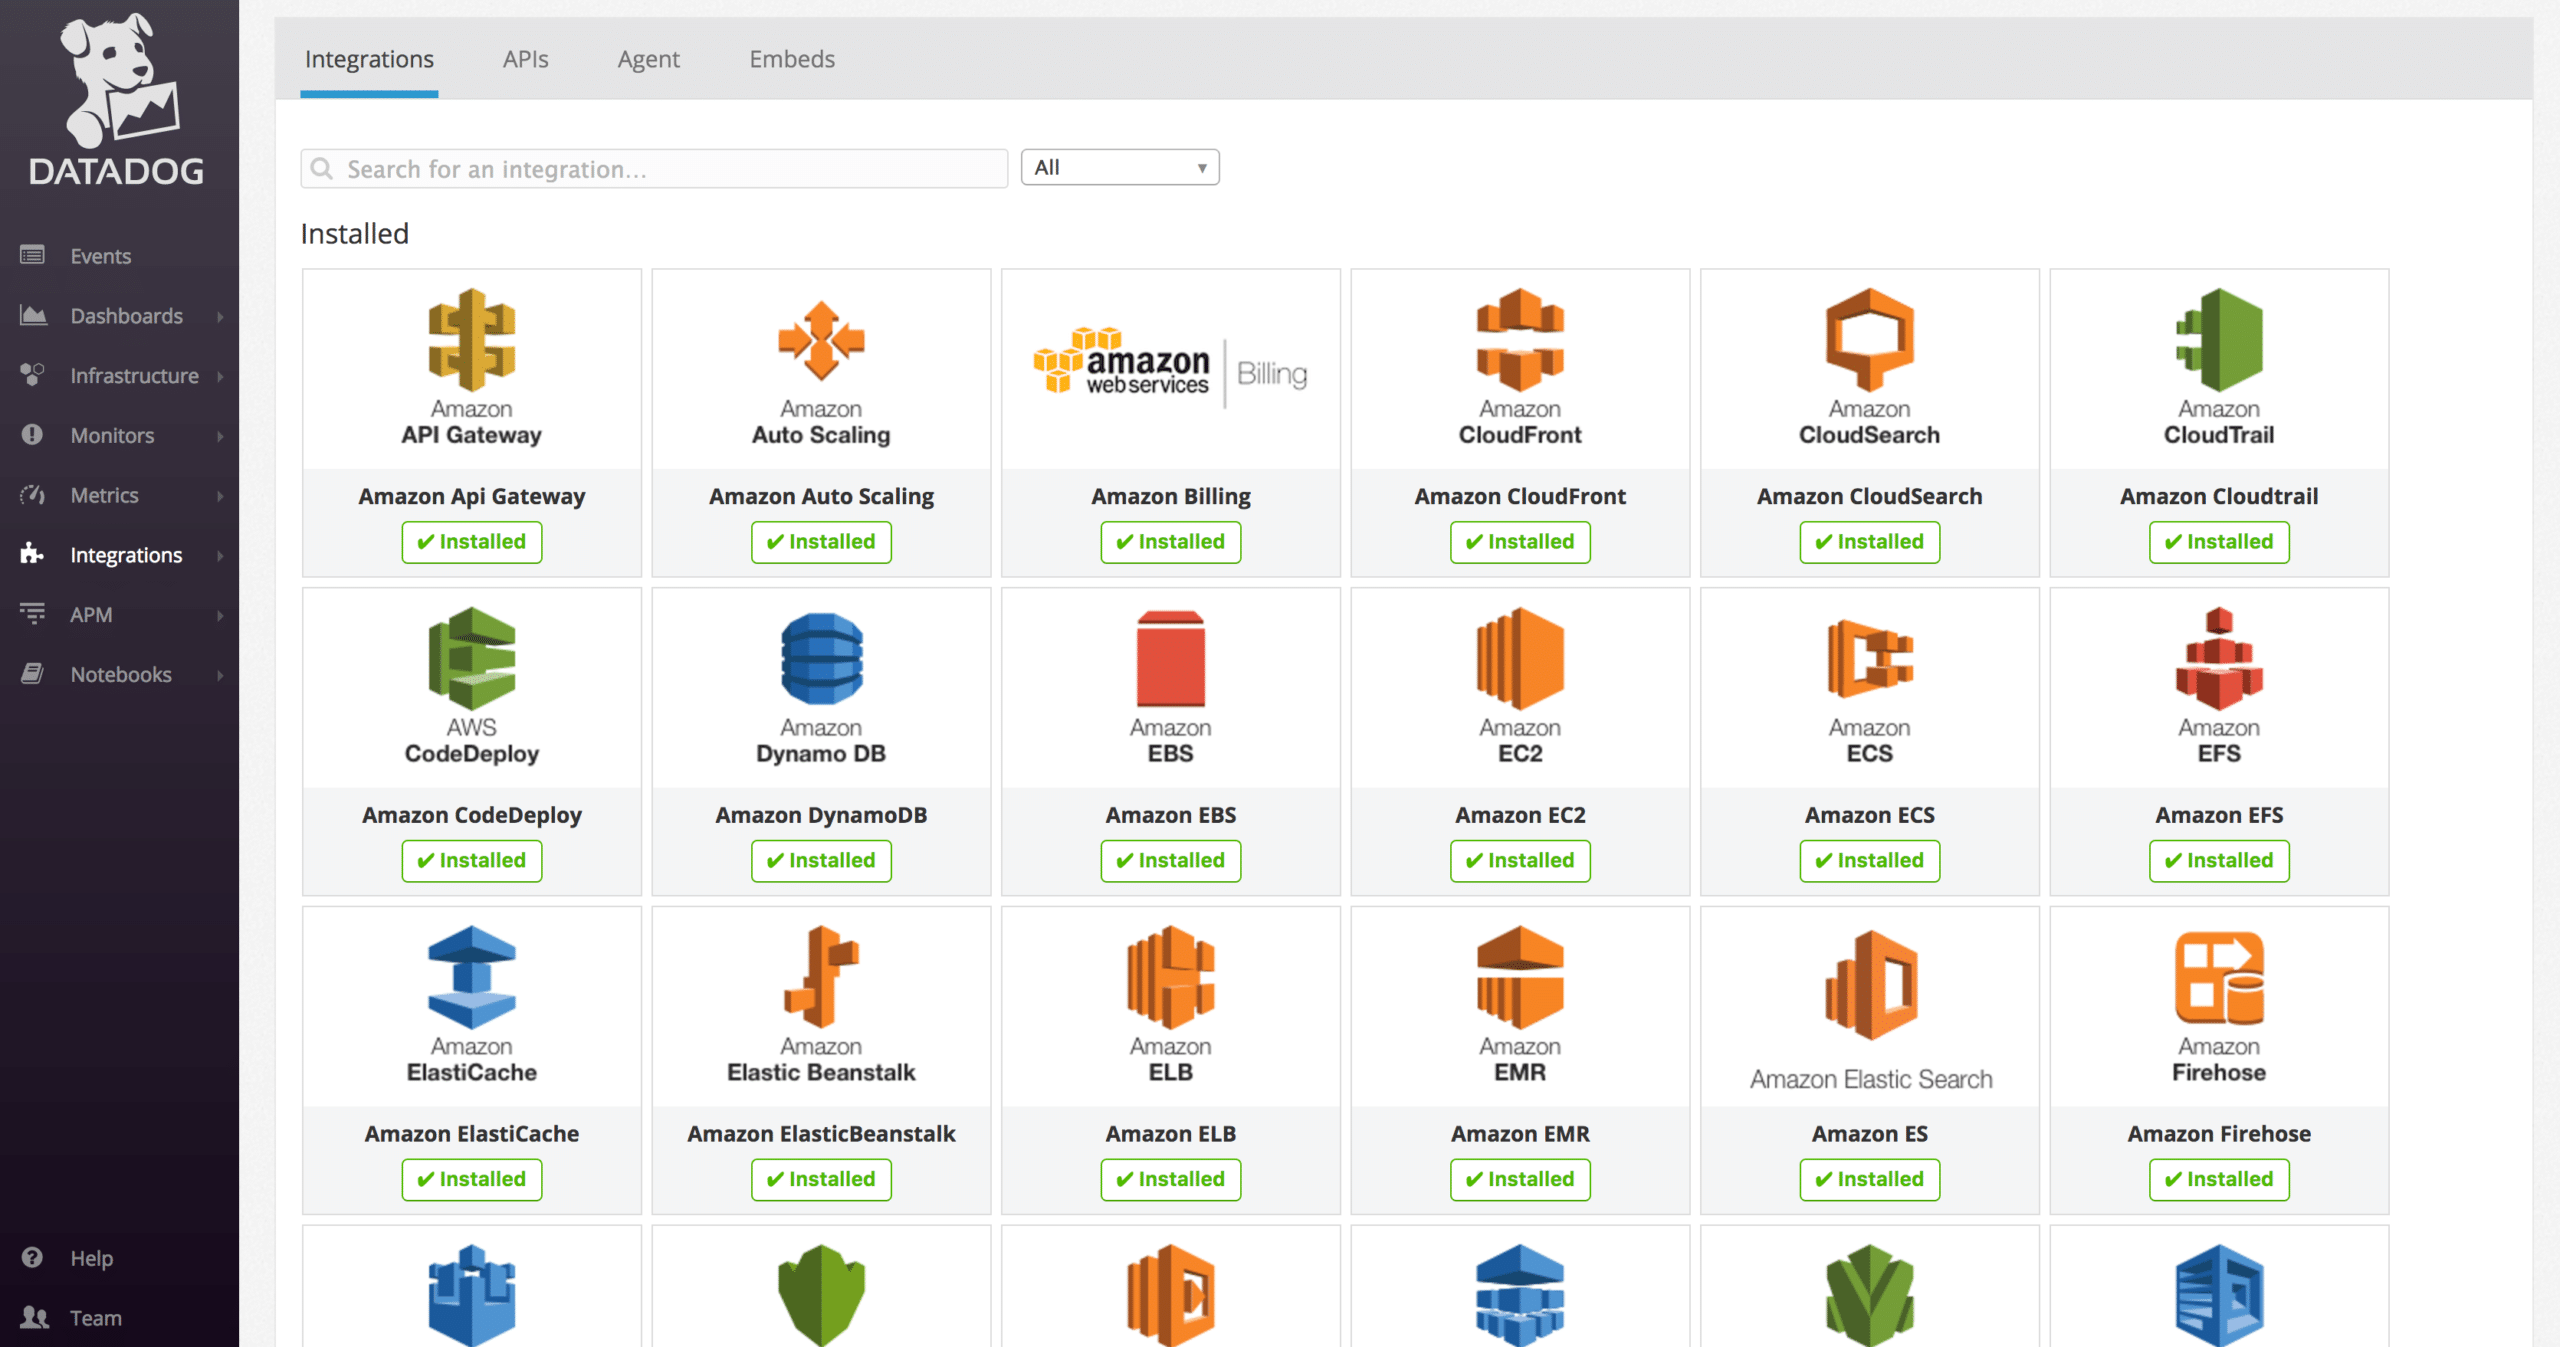
Datadog infrastructure Monitoring is an expandable cloud-based system that tracks activities on servers, services, and hosted applications. The package has an associated list of integrations, which include a package for IBM zSeries monitoring.
Key Features:
- Using automatic notifications, quickly resolve Db2 deadlocks
- Keep track of how well mainframe services are performing
- Consider the mainframe and CPU performance
- Make mainframe data a critical component of your APM
Why do we recommend it?
Datadog Infrastructure Monitoring provides extensions for monitoring specific mainframe types but it also simultaneously monitors all the rest of your infrastructure. The package will link the activities of the services on your mainframe with the capacity of its resources, such as memory and disk space. This helps you to identify the root cause of problems when they arise.
Some of the integrations require a payment. The list of paid integrations is called Datadog Marketplace. Here you can find Bottomline Record and Replay, which monitors 3270/5250 mainframes.
The Datadog Marketplace now has Mainstorconcept’s z/IRIS product, allowing you to seamlessly combine z/IRIS traces and metrics with the rest of your application data. You can troubleshoot faster, lower your mean time to recovery, and increase the reliability of your system by having access to important infrastructure data, detailed error messages, and alarms. You can also set up Db2 deadlock notifications to be notified when a deadlock occurs.
The integration includes a built-in dashboard that’s already configured to track and display some of Db2’s most significant key metrics, such as query rates, database size, and server resource use. While Datadog provides several pre-configured monitoring and reporting templates, you can still tweak them or develop your internal template from scratch.
You may set up alerts for important service level indicators like latency to automatically detect problems that could harm your users’ experience. If you need to look into a performance problem, traces provide error details from z/OS servers to help you discover the source quickly.
Who is it recommended for?
This system isn’t just for mainframe owners. It is a flexible package that can be used to monitor all types of technologies. The Infrastructure unit is the core module of the Datadog platform and you can add on other services, such as network monitoring and an application performance monitor.
Pros:
- Special routines to monitor 3270/5250 mainframes
- Tracking for z/OS performance and components of zSeries mainframes
- Analysis of capacity requirements for server and mainframe resources
- Root cause analysis and alerts for performance problems
Cons:
- Adding on extra modules can rack up the price
You can use current historical metrics to visually identify aberrant behavior, as well as take a snapshot of your IBM Db2 performance and compare it to previous performance benchmarks. The package also includes two pre-built dashboards that provide comprehensive visibility into REST API and Java database connectivity (JDBC) statistics. You can examine any Datadog module with a 14-day free trial.
5. BMC Automated Mainframe Intelligence (AMI)

BMC announced various new features and updates for its Automated Mainframe Intelligence (AMI) package, allowing BMC mainframe customers to preserve uptime and availability, defend against cybersecurity threats, and accelerate enterprise DevOps.
Key Features:
- Improves Digital Experience
- Enhances the Ecosystem as a Whole
- Boosts Availability and enhances Security
Why do we recommend it?
BMC Automated Mainframe Intelligence (AMI) is one of the few suites of monitoring systems that are specifically designed for mainframe monitoring rather than being an extra feature of a general system monitoring package. Therefore, it had to be included on this list. The package provides automated monitoring with performance alerts.
The BMC solution, which combines built-in domain expertise, machine learning, intelligent automation, and predictive analytics to help companies automatically manage, diagnose, heal, secure, and optimize mainframe processes, is the newest addition to BMC’s AMI services. Another AMI product is BMC AMI Security. It allows users to monitor mainframe systems and data automatically to discover and respond to security incidents.
Using the BMC AMI Data, application development teams may release their code more quickly without jeopardizing the security and availability of their Db2 database. Even as the business becomes more agile, this ensures that applications stay reliable and available.
BMC AMI DevX integrates with Jenkins, an application development orchestration tool, to automatically research and determine database schema change requirements, streamline the review and approval process, and safely implement database schema changes, allowing development and operations teams to be more efficient and agile.
Customers can improve threat detection and response capabilities by using the BMC AMI Security solution’s enhanced security controls, out-of-the-box security tests, and more indicators of compromise. With the new BMC AMI zAdviser dashboards, DevOps teams can now determine which BMC AMI DevOps toolchain products and capabilities are underutilized.
They may also provide applications and services faster thanks to the expanded automated testing capabilities of the BMC AMI Total Test package, which simplifies automated test case generation, expands test coverage with negative testing, and decreases rework.
Who is it recommended for?
This system has modules for all technical teams that work with IBM zSeries mainframes. For example, there are regular system monitoring tools for operations teams and data and application development support services for DevOps teams. This package won’t monitor other technologies on your site, such as networks.
Pros:
- A range of system monitoring services for IBM zSeries mainframes
- Security monitoring features
- Database and application development support
Cons:
- Only manages IBM zSeries mainframes
6. Rocket TMON for z/OS
Rocket TMON for z/OS is a mainframe monitoring and management service that is part of the TMON ONE package of IBM zSeries monitoring systems. The system is installed directly on your mainframe IBM z series. The tool can be networked, and an extract can be created to feed into other data processing programs.
Key Features:
- Monitors z/OS performance across the entire organization in real-time
- Detecting performance anomalies involves Planning for capacity
- Extracted data and IBM’s Health Checker are integrated for quick problem investigation and resolution
Why do we recommend it?
Like the BMC package, TMON ONE is one of the few suites of monitoring systems for IBM zSeries mainframes. This system includes the Rocket TMON for z/OS unit that will operate at the command line with pre-written scripts to examine activities and resource availability on the mainframe. The package includes modules to track the performance of each component of the IBM zSeries architecture.
ASG-TMON for z/OS is a dynamic monitoring solution for IBM’s z/OS operating system across all partitions in your organization. It delivers real-time performance statistics on critical software and hardware resources, as well as long-term online data for post hoc analysis of resource utilization trends, service levels, I/O contention, job delays, exceptions, and other issues.
It also features strong exception processing and productivity-enhancing applications, as well as being developed primarily for systems programmers, performance analysts, application tuners, and operations personnel. NaviGate requires a database to store extracted data and provides an HTML-based graphical user interface. NaviPlex is another tool that may be used for activity analysis. This program runs on Windows and allows you to sort, mine, and display data in many forms.
Data center managers and system programmers can use Rocket-TMON for IMS to quickly respond to, identify, and address IMS issues. It was created to improve IMS application performance and provide instant visibility into application and IMS subsystem performance.
TMON for IMS also eliminates the need for separate monitors for each IMS subsystem, lowering costs and increasing profits. Performance analysts and capacity planners can use this module to discover patterns, enhance application throughput, and plan for expansion, avoiding costly upgrade charges. IMS and FastPath transactions and databases are monitored by the Rocket TMON ONE Modules.
Who is it recommended for?
This tool competes closely with the BMC AMI suite and zSeries owners and operators should compare these two systems closely. One big difference between these two systems lies in their deployment methods. While BMC AMI is a cloud-based SaaS package, the Rocket TMON ONE software, installs on your mainframe.
Pros:
- Live performance monitoring
- Forecasting and capacity planning features
- Can consolidate the monitoring of multiple zSeries mainframes in one console
Cons:
- No functions to monitor systems other than IBM zSeries mainframes
The best way to assess the TMON ONE suite is to request a demo.
7. Pandora FMS

Pandora FMS is a full stack system monitoring package that includes the capability to monitor IBM zSeries mainframes. This mainframe monitoring service is implemented by a plug-in for the main Pandora FMS package, which is available for an extra fee.
Key Features:
- Remote monitoring
- Full stack observability
- Maintenance automation
Why do we recommend it?
The base package of Pandora FMS competes with all of the major system monitoring packages because it provides features such as network discovery and software management. The system includes a lot of automation services to maximize the efficiency of expensive technical staff and the mainframe monitoring plug-in enhances that service for IBM zSeries owners.
The Pandora FMS package is designed as a platform of remote monitoring and management services. So, it is suitable for use by the central IT departments of multi-site businesses. It can also be useful for managed service providers
The use of mainframes is rare these days, so it doesn’t make sense for PAndora FMS to include zSeries monitoring in its main package – the majority of the system’s buyers will never need that feature. However, the extension provided by Pandora FMS makes zSeries monitoring available for those companies that need it.
The advantage of buying the Pandora FMS system and the zSeries plug-in is that all of the performance and resource monitoring data that gets read into the monitoring dashboard can be correlated to other activities on the network, such as traffic throughput. Thus, a technician who gets alerted to a service delivery problem can quickly detect the real cause of those performance issues and won’t need to waste time combing through command line query output on z/OS if the problem is really that a switch is overloaded.
The zSeries monitoring system doesn’t require any programs to be installed on the mainframe itself. Instead, the plug-in creates a remote HTTP query routine that sends report requests to the mainframe periodically. So, you don’t need to worry about ensuring that your monitoring system’s software is kept up to date on the mainframe itself.
Who is it recommended for?
This system will appeal to multi-site businesses and also to managed service providers. Naturally, the zSeries plug-in will only be of interest to companies that run a z/OS mainframe. The advantage of Pandora FMS is that it is a single console for monitoring all system assets and it can mix together analysis data to help with root cause analysis and capacity planning.
Pros:
- Activity reporting
- Capacity planning support
- Multiple deployment options
Cons:
- Not a well-known brand
Pandora FMS is up against some big names in the system monitoring market, such as Nagios and Zabbix. However, the package is increasingly gaining attention and can be considered to be a challenger brand. The monitoring tool is available as a SaaS platform on the cloud or you can opt to download the software and run it on Linux or over Docker. There is an open source version available for free – that’s called Pandora FMS Community Edition. You can assess the op-premises version, which is called Pandora FMS Enterprise, on a 30-day free trial.
8. Intellimagic Vision for z/OS

Intellimagic Vision for z/OS is a suite of operations management and analysis tools for zSeries mainframes. The package includes monitors for all the components of the zSeries architecture, including CICS, MQ, and Db2.
Key Features:
- Detailed monitoring
- Live feedback per component
- Overall system performance
Why do we recommend it?
Intellimagic Vision for z/OS is a detailed package for zSeries mainframe monitoring with detailed monitoring processes for each component of the zSeries architecture. The service helps zSeries owners keep track of activities and evaluate capacity to ensure constant availability. Color-coded time series graphs speed up problem recognition.
You can run the Intellimagic Vision software on your zSeries mainframe or opt for a SaaS version that is hosted by Intellimagic on the cloud. Either way, you get a Web-based console, which presents better graphics than you can get from a command line output on z/OS. The console can be customized, creating different views for different roles. This enables system administrators to share live activity graphs with business managers or clients.
The Home screen of the Intellimagic monitoring console provides a system activity overview that stretches back to the last 30 days. You can zoom in on recent activity and see just the last hour to get a more detailed view of current activity.
Intellmagic also presents activity data in table format. The system looks for constant demand and will highlight deviations from a narrow band of demand levels. You can adjust the exact range of deviations and you can also set up alerts workflows for activity levels that are outside the standard load.
The Intellimagic Vision for z/OS package includes AI processes to calculate the knock-on effect of demand overload in one component of the zSeries architecture. Intellimagic also provides consultancy services that can run for on-call support through to remote system monitoring and management.
Who is it recommended for?
Apart from the obvious qualification that a customer of this tool must be running a zSeries mainframe, there aren’t any specifics to the profile of an Intellmagic customer. The provider offers a software-only option for companies that have technician teams and hosted versions that provide monitoring software maintenance. This package is suitable for managed service providers as well.
Pros:
- Options for a managed service
- Predictions for resource shortages and operational bottlenecks
- Customizable consoles for data sharing
Cons:
- Doesn’t monitor those parts of your IT system that aren’t on a zSeries mainframe
Intellimagic offers a trial account of Intellimagic Vision for z/OS.
Final thoughts
The availability and performance indicators of hardware systems and subsystem resources are monitored by Mainframe Monitoring Tools across the company. Due to their access to system data, several real-time monitors have automation extensions to respond to events or thresholds. The benefits of being able to quickly locate, diagnose, and respond to problems are evident.
Datadog is the best-known out of all the top mainframe monitoring tools since its IT infrastructure monitoring allows you to watch the health and performance of your whole environment. Datadog provides extensive visibility into your complete IT stack from a single unified platform, thanks to over 600+ vendor-backed integrations.