Troubleshooting is part and parcel of being an administrator, no matter what platform(s) you’re trying to protect. Linux systems, in particular, have a diverse range of troubleshooting tools users can leverage to find the root cause of poor performance. In this article, we’re going to look at the best Linux network troubleshooting tools.
The list includes everything from network monitoring tools that monitor Linux systems remotely to Linux-based command-line utilities that let you investigate performance issues manually.
Here is our list of the best Linux network troubleshooting tools:
- ManageEngine OpManager EDITOR’S CHOICE Network monitoring software with Linux server monitoring, custom dashboards, reports, alerts, and more. Start a 30-day free trial.
- Site24x7 (FREE TRIAL) As a cloud-delivered monitoring service, this package can supervise Windows and Linux servers as well as network devices. It also includes network discovery. Get a 30-day free trial.
- Paessler PRTG Network Monitor Infrastructure monitoring software with Linux server monitoring, network autodiscovery, alerts, and more.
- SolarWinds Server & Application Monitor Server and application monitoring tool that can automatically discover Linux applications and servers, with health and availability monitoring, alerts, and more.
- Ping Linux utility that allows you to test a device’s connectivity.
- Ifconfig Command line utility for UNIX-based OS allows you to query TCP/IP network configurations of interfaces, change MAC addresses, and more.
- Netstat Command line utility that enables you to monitor ingoing and outgoing connections with your device, showing the state of links, a network routing table, and more.
- NSLookup Command line utility lets you perform DNS lookups, reverse DNS lookups, gather authoritative domain information, and more.
- Route Command line utility that displays the kernel IP routing table and allows you to modify it.
- Tcpdump Command line utility you can use to capture and inspect traffic with protocol filters, host filters, and more.
The Best Linux Network Troubleshooting Tools
1. ManageEngine OpManager (FREE TRIAL)

ManageEngine OpManager is a network monitoring tool that you can use to monitor the CPU, memory, and disk utilization of Linux servers. The platform comes with out-of-the-box templates for tracking a range of Linux devices, including routers, switches, firewalls, and load balancers.
Key Features:
- Linux monitoring
- Out-of-the-box monitoring templates
- Custom dashboard
- Alerts
Why do we recommend it?
ManageEngine OpManager stands out as an excellent choice for Linux server monitoring, and we confidently recommend it based on our thorough evaluation. Having extensively tested the tool, including the download, installation, and navigation of its interface, we found OpManager to be a reliable solution for tracking CPU, memory, and disk utilization of Linux servers. Its out-of-the-box monitoring templates streamline the process of tracking various Linux devices, offering versatility for routers, switches, firewalls, and load balancers. OpManager’s customization options, particularly the custom dashboards with over 200 widgets, provide users with a tailored monitoring environment. The robust alerts system ensures timely notifications about performance issues, contributing to its status as a cost-effective and feature-rich Linux monitoring tool.
Custom dashboards allow you to use over 200 different widgets to create your monitoring environment. There is also a range of reports you can generate if you’re looking to view more specific information on systems. Out-of-the-box reports include System, Health and Performance, Availability and Response, Inventory, WAN RTT Monitors, VoIP Monitors, Virtual Servers, Storage Reports, and more.
An alerts system gives you a heads-up on performance issues whenever they occur. Whenever an alert is created, you can click on the alarm message to view more details about the alert and brief event history. You can also take follow-up actions such as running a Ping test or conducting a TraceRoute on a device.
Who is it recommended for?
ManageEngine OpManager is recommended for enterprises seeking a cost-effective yet feature-rich solution for Linux server monitoring. Our recommendation is further reinforced by the platform’s versatility, supporting a range of Linux devices and providing out-of-the-box monitoring templates. The customizable dashboards and extensive reporting capabilities make it an ideal choice for organizations with diverse monitoring needs. OpManager’s effectiveness in alerting users to performance issues adds to its suitability for enterprises looking to maintain optimal Linux server health. Throughout our evaluation, OpManager consistently demonstrated its capacity to meet the monitoring requirements of various Linux environments, making it a reliable choice for IT administrators and teams overseeing Linux infrastructures.
ManageEngine OpManager is a solid choice for enterprises that require cost-effective Linux monitoring with a diverse feature set. It is available on Windows and Linux. Standard Edition costs $245 (£177) for ten devices. You can download the 30-day free trial from this link here.
EDITOR'S CHOICE
ManageEngine OpManager is our leading choice for Linux network troubleshooting, offering a unified way to monitor, diagnose, and resolve issues across Linux-based environments. Even in stable systems, network problems can occur, and OpManager provides the visibility and tools needed to pinpoint and address them quickly. It monitors Linux servers and network devices directly, helping administrators identify performance bottlenecks, outages, and configuration-related issues without delay. Real-time monitoring sits at the core of the platform, delivering insight into network performance, availability, and traffic behaviour. Custom dashboards and alerts make it easier to spot issues such as high latency, packet loss, or connectivity disruptions affecting Linux systems. Support for services like HTTP, DNS, SSH, and FTP enables monitoring of key system-level components, allowing teams to isolate faults to specific services or devices rather than investigating the entire network. OpManager also includes SNMP and flow-based monitoring for deeper analysis of traffic and bandwidth usage. Automated diagnostics—such as path tracing and route mapping—add another layer of visibility, helping teams follow issues through the network and resolve them more efficiently.
Download: Get a 30-day FREE Trial
Official Site: https://www.manageengine.com/network-monitoring/download.html
OS: Windows Server, Linux, AWS, and Azure
2. Site24x7 (FREE TRIAL)
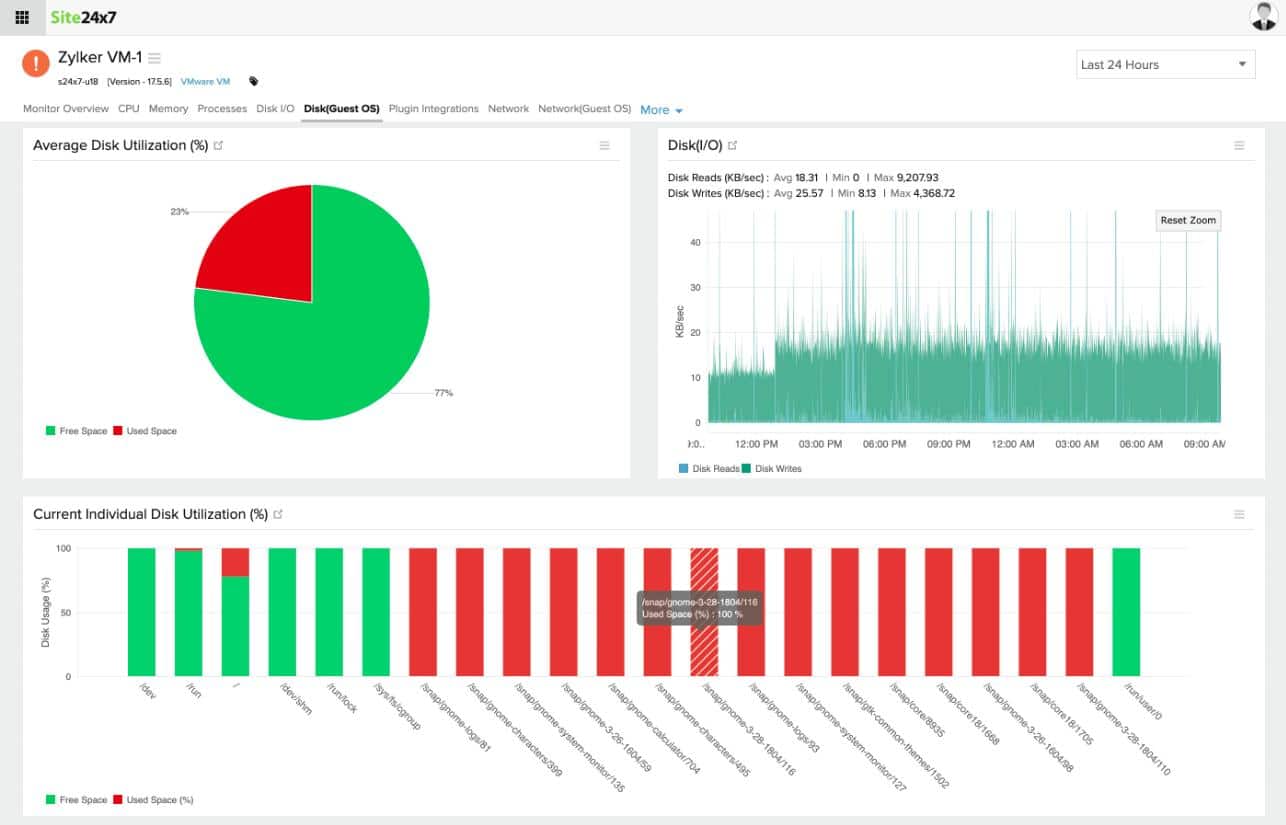
Site24x7 monitors both network devices and endpoints, and those endpoints can run either Windows or Linux. The service has a built-in discovery routine that locates all equipment attached to the network, including Linux and Windows endpoints. From that discovery process, the package compiles an inventory and produces a network topology map.
Key Features:
- Monitoring for Linux endpoints
- Discovery of all hardware connected to the network
- Creation of a network topology map
- Ongoing monitoring of network devices
Why do we recommend it?
We recommend Site24x7 because it gives Linux-based systems broad monitoring coverage across CPU, memory, disk usage, and network traffic. Real-time alerts, configurable dashboards, and detailed reporting support proactive administration and performance tuning for Linux network operations. The package also uses SNMP to obtain continuous status updates from network devices.
Through this cloud-based platform, IT teams can watch key operating statistics such as CPU usage, memory consumption, disk I/O, and network traffic as they change, helping keep system performance optimized. The same reporting is available for both Windows and Linux servers. Site24x7 also follows availability, uptime, and resource utilization, which allows users to catch and resolve issues such as degraded network performance, excessive CPU consumption, or disk failures before users or applications are affected.
Managing large Linux estates is simplified by the platform’s ability to watch multiple Linux servers from one dashboard. Site24x7 adds customizable alerting, detailed historical reporting, and root cause analysis to that visibility. Because alerts can be tied to user-defined thresholds, administrators are notified quickly when irregular conditions appear, which supports faster troubleshooting and helps reduce the chance of downtime.
Who is it recommended for?
This platform is aimed at IT teams, system administrators, and network engineers responsible for Linux-based systems and network infrastructure. It is particularly useful for organizations of any size that need comprehensive monitoring of Linux servers, network devices, and applications in order to maintain performance, reliability, and rapid issue resolution across their networks.
Site24x7 is a cloud-hosted service sold through a range of subscription plans. You can assess the package with a 30-day free trial.
3. Paessler PRTG Network Monitor
Paessler PRTG Network Monitor is an infrastructure monitoring tool that you can use to monitor Windows and Linux servers. Paessler PRTG Network Monitor comes with Linux and UNIX sensors to monitor Linux machines and automatically discovers devices connected to your network so that you don’t have to add them to the system manually.
Key Features:
- Monitor Linux servers
- Custom dashboard
- Network autodiscovery
- Threshold-based alerts
- Reports
Why do we recommend it?
Paessler PRTG Network Monitor is specifically tailored for monitoring both Windows and Linux servers, PRTG Network Monitor provides Linux and UNIX sensors, facilitating seamless monitoring of Linux machines. The platform’s automatic device discovery feature ensures efficient network management without the need for manual additions. Additionally, the customization capabilities, such as creating custom dashboards and utilizing over 300 map objects, empower users to prioritize and tailor their monitoring experience according to the unique needs of their environment. Paessler PRTG Network Monitor excels in providing a comprehensive solution for enterprises seeking effective and user-friendly Linux server monitoring, especially from a Windows-based system.
The platform allows you to create custom dashboards and network maps from over 300 different map objects. This allows you to build a monitoring experience that prioritizes the systems most important to your environment. You can also generate reports to look at historical monitoring data, whether scheduled or on-demand, and export them in HTML or PDF formats.
Threshold-based alerts allow you to set trigger conditions that determine when the platform generates an alert. For instance, if the response time exceeds a parameter you’ve chosen, the tool will alert you by email, SMS, or push notification.
Who is it recommended for?
Paessler PRTG Network Monitor comes highly recommended for enterprises in search of a reliable solution for monitoring both Windows and Linux servers. Through our evaluations, we found the platform to be particularly suitable for users seeking a Windows-based system to monitor Linux devices efficiently. The ease of use and network autodiscovery feature make it an ideal choice for IT administrators and teams looking for a hassle-free yet comprehensive monitoring experience. Furthermore, the platform’s support for custom dashboards and detailed reports adds to its appeal for organizations with diverse monitoring requirements. Paessler PRTG Network Monitor offers a cost-effective solution, especially for smaller setups with less than 100 sensors, making it accessible for a wide range of businesses.
Paessler PRTG Network Monitor is a solid solution for enterprises looking to monitor Linux devices from a Windows-based system. The platform is available for free for less than 100 sensors. Available on Windows. Pricing starts at $1,750 (£1,266) for 500 sensors. You can download the 30-day free trial from this link here.
4. SolarWinds Server & Application Monitor

SolarWinds Server & Application Monitor is a server and application monitoring tool that allows you to monitor Linux applications and servers. Things you can scan with SolarWinds Server & Application Monitor include health, availability, response time, packet loss, CPU utilization, memory utilization, and more.
Key Features:
- Linux health and availability monitoring
- Dashboard
- Graphs and charts
- Autodiscovery
- Alerts
Why do we recommend it?
In our rigorous testing, we downloaded, installed, and navigated SolarWinds Server & Application Monitor, finding that its autodiscovery feature ensures a swift setup for Linux servers and applications. The tool excels in providing critical insights, including health, availability, response time, packet loss, CPU and memory utilization, empowering administrators to make informed decisions. With a well-designed dashboard, graphs, and charts, SolarWinds Server & Application Monitor offers unparalleled visibility, while customizable alerts keep users informed of any performance deviations, reinforcing its position as a reliable and efficient monitoring solution.
The platform automatically discovers Linux servers and applications so you can up and running quickly. Once you’re ready to start monitoring, you can keep tabs on system performance through a dashboard view, enabling you to identify servers with performance issues like high response times and latency. Features like graphs and charts then give you complete visibility over performance issues.
Alerts notify you about any performance issues with endpoints in your environment. You can configure custom trigger conditions to determine when the system generates a warning, for instance, if latency goes above a particular value.
Who is it recommended for?
SolarWinds Server & Application Monitor is ideal for enterprises seeking an advanced and user-friendly Linux server monitoring solution. Our recommendation is strengthened by the platform’s suitability for environments where streamlined monitoring experiences are paramount. While versatile enough for various applications and servers, it particularly shines in large-scale deployments where the autodiscovery feature ensures quick implementation. The tool’s robust alerting system, configurable trigger conditions, and in-depth performance insights make it an invaluable asset for IT administrators and teams overseeing complex Linux infrastructures. Throughout our evaluation, the platform demonstrated its proficiency, making it a preferred choice for organizations prioritizing efficiency and comprehensive monitoring capabilities.
SolarWinds Server & Application Monitor is a top-of-the-range solution for enterprises that want a streamlined Linux server monitoring experience. It is available on Windows. Pricing starts at $1,622 (£1,173.60). You can start a free and fully functional 30-day trial.
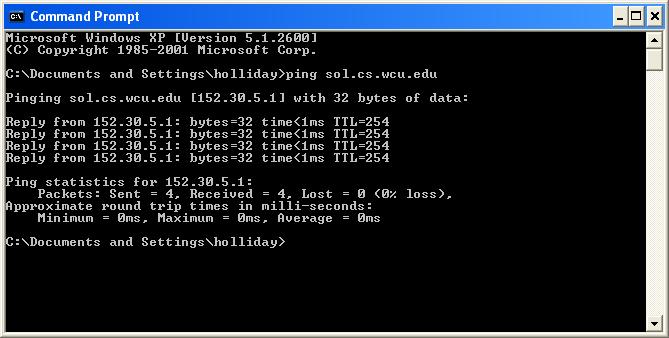
5. ping

Ping or Packet Internet Groper is a Linux utility that allows you to test the connection between a host and server. With the Ping command, you can enter an IP address or URL, and send an ICMP message to that address, and the utility will use the ICMP protocol to measure the amount of time it takes to get a response from the destination.
Key Features:
- Test connections between host and server
- Monitor min, avg, and max RTT
- View packet loss
Why do we recommend it?
Ping, a fundamental Linux utility, earns our recommendation as an essential tool for testing and monitoring connections between hosts and servers. The key features of Ping, such as its ability to test connections, monitor minimum, average, and maximum Round Trip Time (RTT), and provide insights into packet loss, make it an indispensable tool for network troubleshooting and performance analysis. Its simplicity, combined with accurate response time measurements, positions Ping as a go-to utility for IT professionals seeking to diagnose and address connectivity issues effectively.
Pinging the response time brings up a list of responses from the server and details how long it took for the server to respond. The output will continue until you stop pinging by pressing ctrl+c. At the bottom of the production, you can see the min (minimum), avg (average), and max (maximum) Round Trip Time (RTT) of all packets sent and the overall percentage of packet loss.
Ping is a helpful tool in scenarios where you have a poorly performing device and want to look at the actual amount of latency and packet loss. You can install ping by entering the ping -v command. You need to have permission to run the commands.
Who is it recommended for?
Ping is recommended for a broad spectrum of users, particularly IT administrators, network professionals, and anyone involved in managing and troubleshooting network connections. Its straightforward usage and immediate feedback on response times make it accessible to both beginners and experienced users.
6. Ifconfig
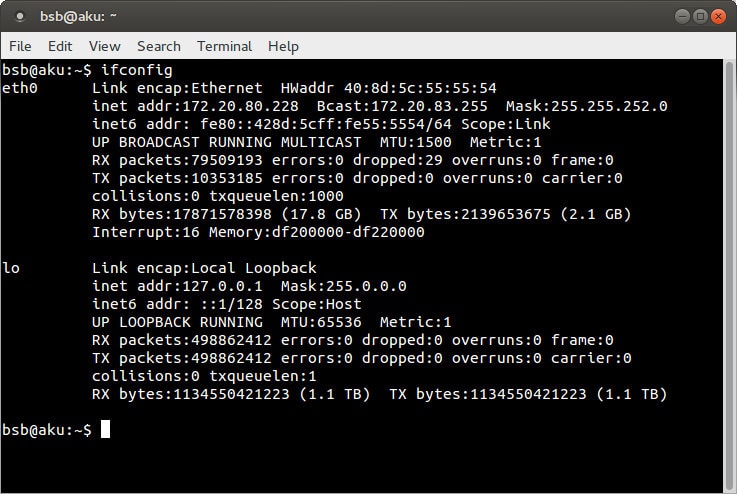
Ifconfig or interface Configuration is a command-line utility for Unix-based operating systems that you can use to view the configurations of active network interfaces and see IPv4 addresses, IPv6 addresses, subnets, and default gateways of interfaces.
Key Features:
- Query interface TCP/IP network configurations
- Change interface MAC address
- Assign static IP addresses to interfaces
Why do we recommend it?
Our recommendation for Ifconfig is rooted in its ability to empower users to query interface TCP/IP network configurations efficiently. Notably, the software’s features extend to facilitating the alteration of interface MAC addresses and the assignment of static IP addresses to interfaces. This level of configurability, combined with the capability to enable and disable network interfaces, positions Ifconfig as an indispensable tool for fine-tuning systems within a network.
The software enables you to select specific interfaces to query, create a list of network interfaces, assign static IP addresses to interfaces, or change the MAC address of interfaces. You also have the option to enable and disable network interfaces.
Ifconfig is a helpful resource to use whenever you’re trying to tune systems within your network. You can install the tool for Debian, Ubuntu, and other distributions by entering the apt-get install net-tools command. For CentOS, you need to enter the install net-tools command.
Who is it recommended for?
Ifconfig comes highly recommended for Unix-based operating system users, particularly system administrators, network engineers, and IT professionals responsible for managing and optimizing network interfaces. Its comprehensive set of features, including the ability to query, modify, and assign configurations, makes it well-suited for tasks ranging from routine network maintenance to more advanced configurations.
7. Netstat

Netstat is a command-line utility that provides you with information on ingoing and outgoing connections to your system. Netstat allows you to look at the methods connected to your device, detailing the IP address and state of the system’s ports. For example, you can see what connections are listening to your system.
Key Features:
- Command line utility
- View ports and IP addresses of active connections
- View routing table information
Why do we recommend it?
The ability to examine listening connections adds an extra layer of security, making Netstat a reliable tool for scrutinizing network activity. Despite being decommissioned, Netstat remains a crucial asset, pre-installed on modern Linux systems, and easily accessible for older systems through the installation of the net-tools command. Through our testing, we have found Netstat to be a reliable ally for users seeking a comprehensive understanding of their system’s network connections.
You can also use the -r command to view a network routing table. The table includes information on the Destination, Gateway, Genmask, Flags, and MSS Window connections.
While Netstat is a handy tool in those scenarios where you want to double-check the connections to your device and make sure that they aren’t malicious, it’s important to note that it has been decommissioned. The command is pre-installed on modern Linux systems, but you need to install the net-tools command if you’re running an older system.
Who is it recommended for?
Netstat is strongly recommended for system administrators, network analysts, and security professionals seeking a command-line utility to inspect and monitor network connections effectively. Its straightforward yet powerful features make it an ideal choice for those who want to view ports, IP addresses of active connections, and routing table information. Whether you are running a modern Linux system or an older one requiring the installation of net-tools, Netstat remains a versatile solution for users across different environments, contributing to enhanced visibility and control over network activities.
8. NSLookup
Nslookup or Name Server Lookup is a Linux command that allows you to poll the DNS server for DNS records, domain names, and IP addresses. To use the tool, you simply enter a domain name or URL into the command line, and the output will show the IP address of the domain. You also have the option to perform reverse DNS lookups by adding an IP address.
Key Features:
- Poll DNS servers for records, domain names, and IP addresses
- Reverse DNS lookup
- View authoritative domain information
Why do we recommend it?
NSLookup, or Name Server Lookup, earns our recommendation as a fundamental Linux command that empowers users to query DNS servers for essential information, including DNS records, domain names, and IP addresses. Its simplicity and effectiveness make it an invaluable tool for swiftly obtaining the IP address of a domain or conducting reverse DNS lookups by inputting an IP address. The option to view authoritative domain information further enhances its utility, offering a comprehensive DNS exploration experience.
If you want to gather more information, then there are several other commands you can use. Using the -type=soa command alongside a URL allows you to look up the Start of Authority (SOA) and view information such as the domain serial number and email address of the domain admin.
Nslookup provides a simple way to perform DNS lookups. Many Linux distributions have NSlookup installed, but if you don’t, and you’re on Ubuntu, Debian, or Linux Mint, you can use install dnsutils. Alternatively, if you’re on CentOS, Fedora, or RedHat, you can use install bind-utils.
Who is it recommended for?
NSLookup is highly recommended for system administrators, network analysts, and users needing a straightforward yet powerful command-line utility for DNS lookups on Linux systems. Its ease of use and versatile features, such as reverse DNS lookups and the ability to view authoritative domain information, cater to a broad audience seeking to gather crucial details about DNS records and domain-related data.
9. Route

Route is a command-line utility for Linux that you can use to set up static routes to hosts. Entering the route command brings up the kernel IP routing table that outlines how packets are transferred throughout the network, including the destination, gateway, unmask, flags, metric, ref, use, and interface.
Key Features:
- Set up static routes to hosts
- Forward packets to the gateway address
- Reject rerouting to host
Why do we recommend it?
Route stands out as a crucial command-line utility for Linux, offering users the ability to establish static routes to hosts, significantly enhancing network configuration and management. With the route command, users gain access to the kernel IP routing table, providing comprehensive insights into how packets traverse the network. Its key features, including setting up static routes, forwarding packets to gateway addresses, and preventing rerouting to specific hosts, make Route an indispensable tool for users seeking precise control over network routing.
You can modify the routing table by using the add or del options. Using the add default gw followed by the IP address of a new default gateway enables you to forward packets to a gateway address. Likewise, you can use add -net to add a routing entry. You can also use the add -host IP address reject command to block rerouting packets to particular hosts.
Route is a helpful tool for looking up an IP routing table and keeping an eye on how packets are routed throughout your network. To install the route command on Debian, Ubuntu, CentOS, and RedHat Linux machines, you need to complete the install net-tools command.
Who is it recommended for?
Route is highly recommended for network administrators, system operators, and Linux users who require granular control over routing configurations. Its versatility in setting up static routes and managing packet forwarding to gateway addresses caters to a diverse audience seeking to optimize network pathways for enhanced performance and security. Whether you need to modify the routing table, add or delete routing entries, or block rerouting to specific hosts, Route provides the flexibility and functionality necessary for efficient network administration. For users on Debian, Ubuntu, CentOS, and RedHat Linux distributions, installing the route command through the install net-tools command ensures seamless integration into your network management toolkit.
10. Tcpdump
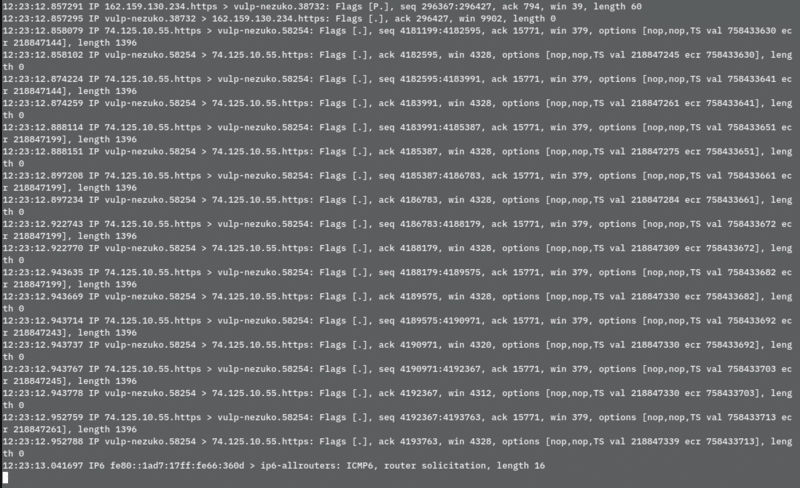
Tcpdump is a command-line utility you can use to capture and inspect network traffic. With Tcpdump, you can capture various packet types, including TCP, UDP, and ICMP packets. Captured packets display the timestamp of the received packet, the type of network protocol (IPv4 or IPv6), source IP address and port, destination IP address and port, and TCP flags.
Key Features:
- Capture and inspect network traffic
- Capture TCP, UDP ICMP packets
- Filter packets by type
Why do we recommend it?
Tcpdump excels in capturing diverse packet types, including TCP, UDP, and ICMP packets, providing a detailed breakdown of each packet’s attributes such as timestamp, network protocol type (IPv4 or IPv6), source and destination IP addresses, ports, and TCP flags. Tcpdump’s ability to filter packets by type ensures a focused and efficient approach to network traffic analysis. Through rigorous testing, Tcpdump has consistently proven its reliability, making it a valuable asset for those requiring in-depth insights into network performance and behavior.
The utility allows you to filter packets by type to reduce the amount of output information you receive. You can also use the host, port, source IP/hostname filters to restrict packet capture to only those of a specific host, port, or source IP.
Tcpdump is a helpful tool for those scenarios where you want to monitor network performance through the command line. The tool is installed on most Linux distributions by default. The system requires libpcap to install it.
Who is it recommended for?
Tcpdump is highly recommended for network administrators, cybersecurity professionals, and Linux users who prioritize command-line efficiency in network traffic monitoring and analysis. Its versatility in capturing and filtering packets by type, along with the ability to specify host, port, or source IP filters, caters to users seeking granular control over captured data. Whether you’re monitoring network performance, troubleshooting connectivity issues, or analyzing security incidents, Tcpdump’s command-line simplicity and robust features make it an indispensable tool. Additionally, as Tcpdump is pre-installed on most Linux distributions, users can seamlessly integrate it into their network analysis toolkit without the need for additional installations.
Best Linux Network Troubleshooting Tools: Editor’s Choice
As you can see, there is an abundance of network troubleshooting and monitoring tools available for Linux, all the way from complete infrastructure monitoring tools to smaller utilities based on Linux.
Out of the tools listed above, ManageEngine OpManager and Site24x7 are excellent places to start if you want to monitor Linux devices remotely. In contrast, the command-line utilities are more useful in those scenarios where you want to perform manual diagnostics on systems.