Microsoft Azure is one of the leading cloud computing services today. And as its popularity continues to rise – it has over 6000 services and more than 700 million users at present – the need for monitoring tools to make sure the users get an optimal return on their investments also continues to grow. It is towards this end that administrators are always on the lookout for the best Azure monitoring tools.
In this post, we will have a look at the best of these tools on the market today. Although we will be looking into each one in detail, below is a list with a brief description of each of these tools.
Here’s our list of the best Azure Monitoring Tools:
- ManageEngine ADAudit Plus EDITOR’S CHOICE An Azure monitoring package that tracks user activity, sign-in attempts, and system access in real time. It also covers on-premises systems, with detailed reporting, proactive alerting, and security controls that support compliance. Available for Windows Server, AWS, and Azure. Get a 30-day free trial.
- Progress WhatsUp Gold (FREE TRIAL) Provides complete oversight and control into your Azure environments by gathering data and analyzing it within the context of your infrastructure and operations. This means you get the insights that matter to you and provide the basis for data-driven decision making. Start a 30-day free trial.
- ManageEngine Applications Manager (FREE TRIAL) Excels in tracking and optimizing performance for Azure-hosted applications. Its seamless integration with Azure services and real-time analytics make it a top choice for managing Azure environments. Download a 30-day free trial.
- Turbo360 Azure Monitoring (FREE TRIAL) This cloud management platform for Azure allows you to group services into applications, map their dependencies, and use distributed tracing to monitor their performance. The system also includes an Azure resource usage tracker for bill checking. Offered as a SaaS package or as a privately hosted Azure service. Start a 15-day free trial.
- Site24x7 Azure Monitoring (FREE TRIAL) A package of system monitors that covers both servers and applications, including cloud monitoring for platforms such as Azure. This is a SaaS system. Start a 30-day free trial.
- Paessler PRTG Network Monitor (FREE TRIAL) A collection of powerful Azure monitoring systems for networks, servers, and applications; further enhanced with the collaboration of other powerful partners’ tools to deliver accurate real-time information about the whole cloud stack.
- AppDynamics Application Performance Monitoring (APM) The solution for managing an enterprise Azure cloud stack – from the end-user in front to the database servers in the back – comes with automatic discovery that analyzes business transactions for better insight into UX.
- SolarWinds Server & Application Monitor The complete tool for administrators looking to take complete control of their Azure installation; easily integrates with other great products for a more complete and detailed analysis – agentless installation makes it tiny and yet able to monitor complex architectures in minute details.
- Datadog A natively-embedded tool for Azure portal where it can build streamlined experiences for purchasing, configuring, and managing it directly from inside the portal; an ideal choice for DevOps teams.
- LogicMonitor A SaaS monitoring service for monitoring Azure infrastructure, services, applications, and other resources –regardless if they are running in an on-premises, cloud, or hybrid cloud architecture.
- Sumo Logic Azure Management A tool that supports Azure apps, services, and complex hybrid architectures. It is a tool that integrates with other popular tools. It can monitor Office 365, Kubernetes, and more – a very “friendly” monitor.
- Dynatrace Azure Monitoring Advanced observability for the entire stack, once it is automatically deployed it discovers all assets – hardware and software – in the entire cloud stack, using AI to set and monitor baselines and performances.
What about Microsoft’s Azure Monitor?
Let’s not forget that Microsoft has Azure Monitor – its own native monitoring tool. You may also have noticed that it is not included in the list above.
So, let’s have a look at it first.

Azure Monitor helps administrators achieve optimal availability and performance of the services and applications on the cloud platform. It collects data from all over a cloud (or hybrid) domain to make it easy for administrators to analyze, and act on, events that may cause issues – both in the present and in the future.
This data that is collected from sources like user activity, applications, and operating systems is of two main types:
- Metrics – The lightweight numerical values that represent an aspect of a system at a particular point in time and that can be presented in near real-time.
- Logs – Records containing types of data that are grouped into different sets of properties; for example, events and traces can be stored as logs that are then retrieved for analysis.
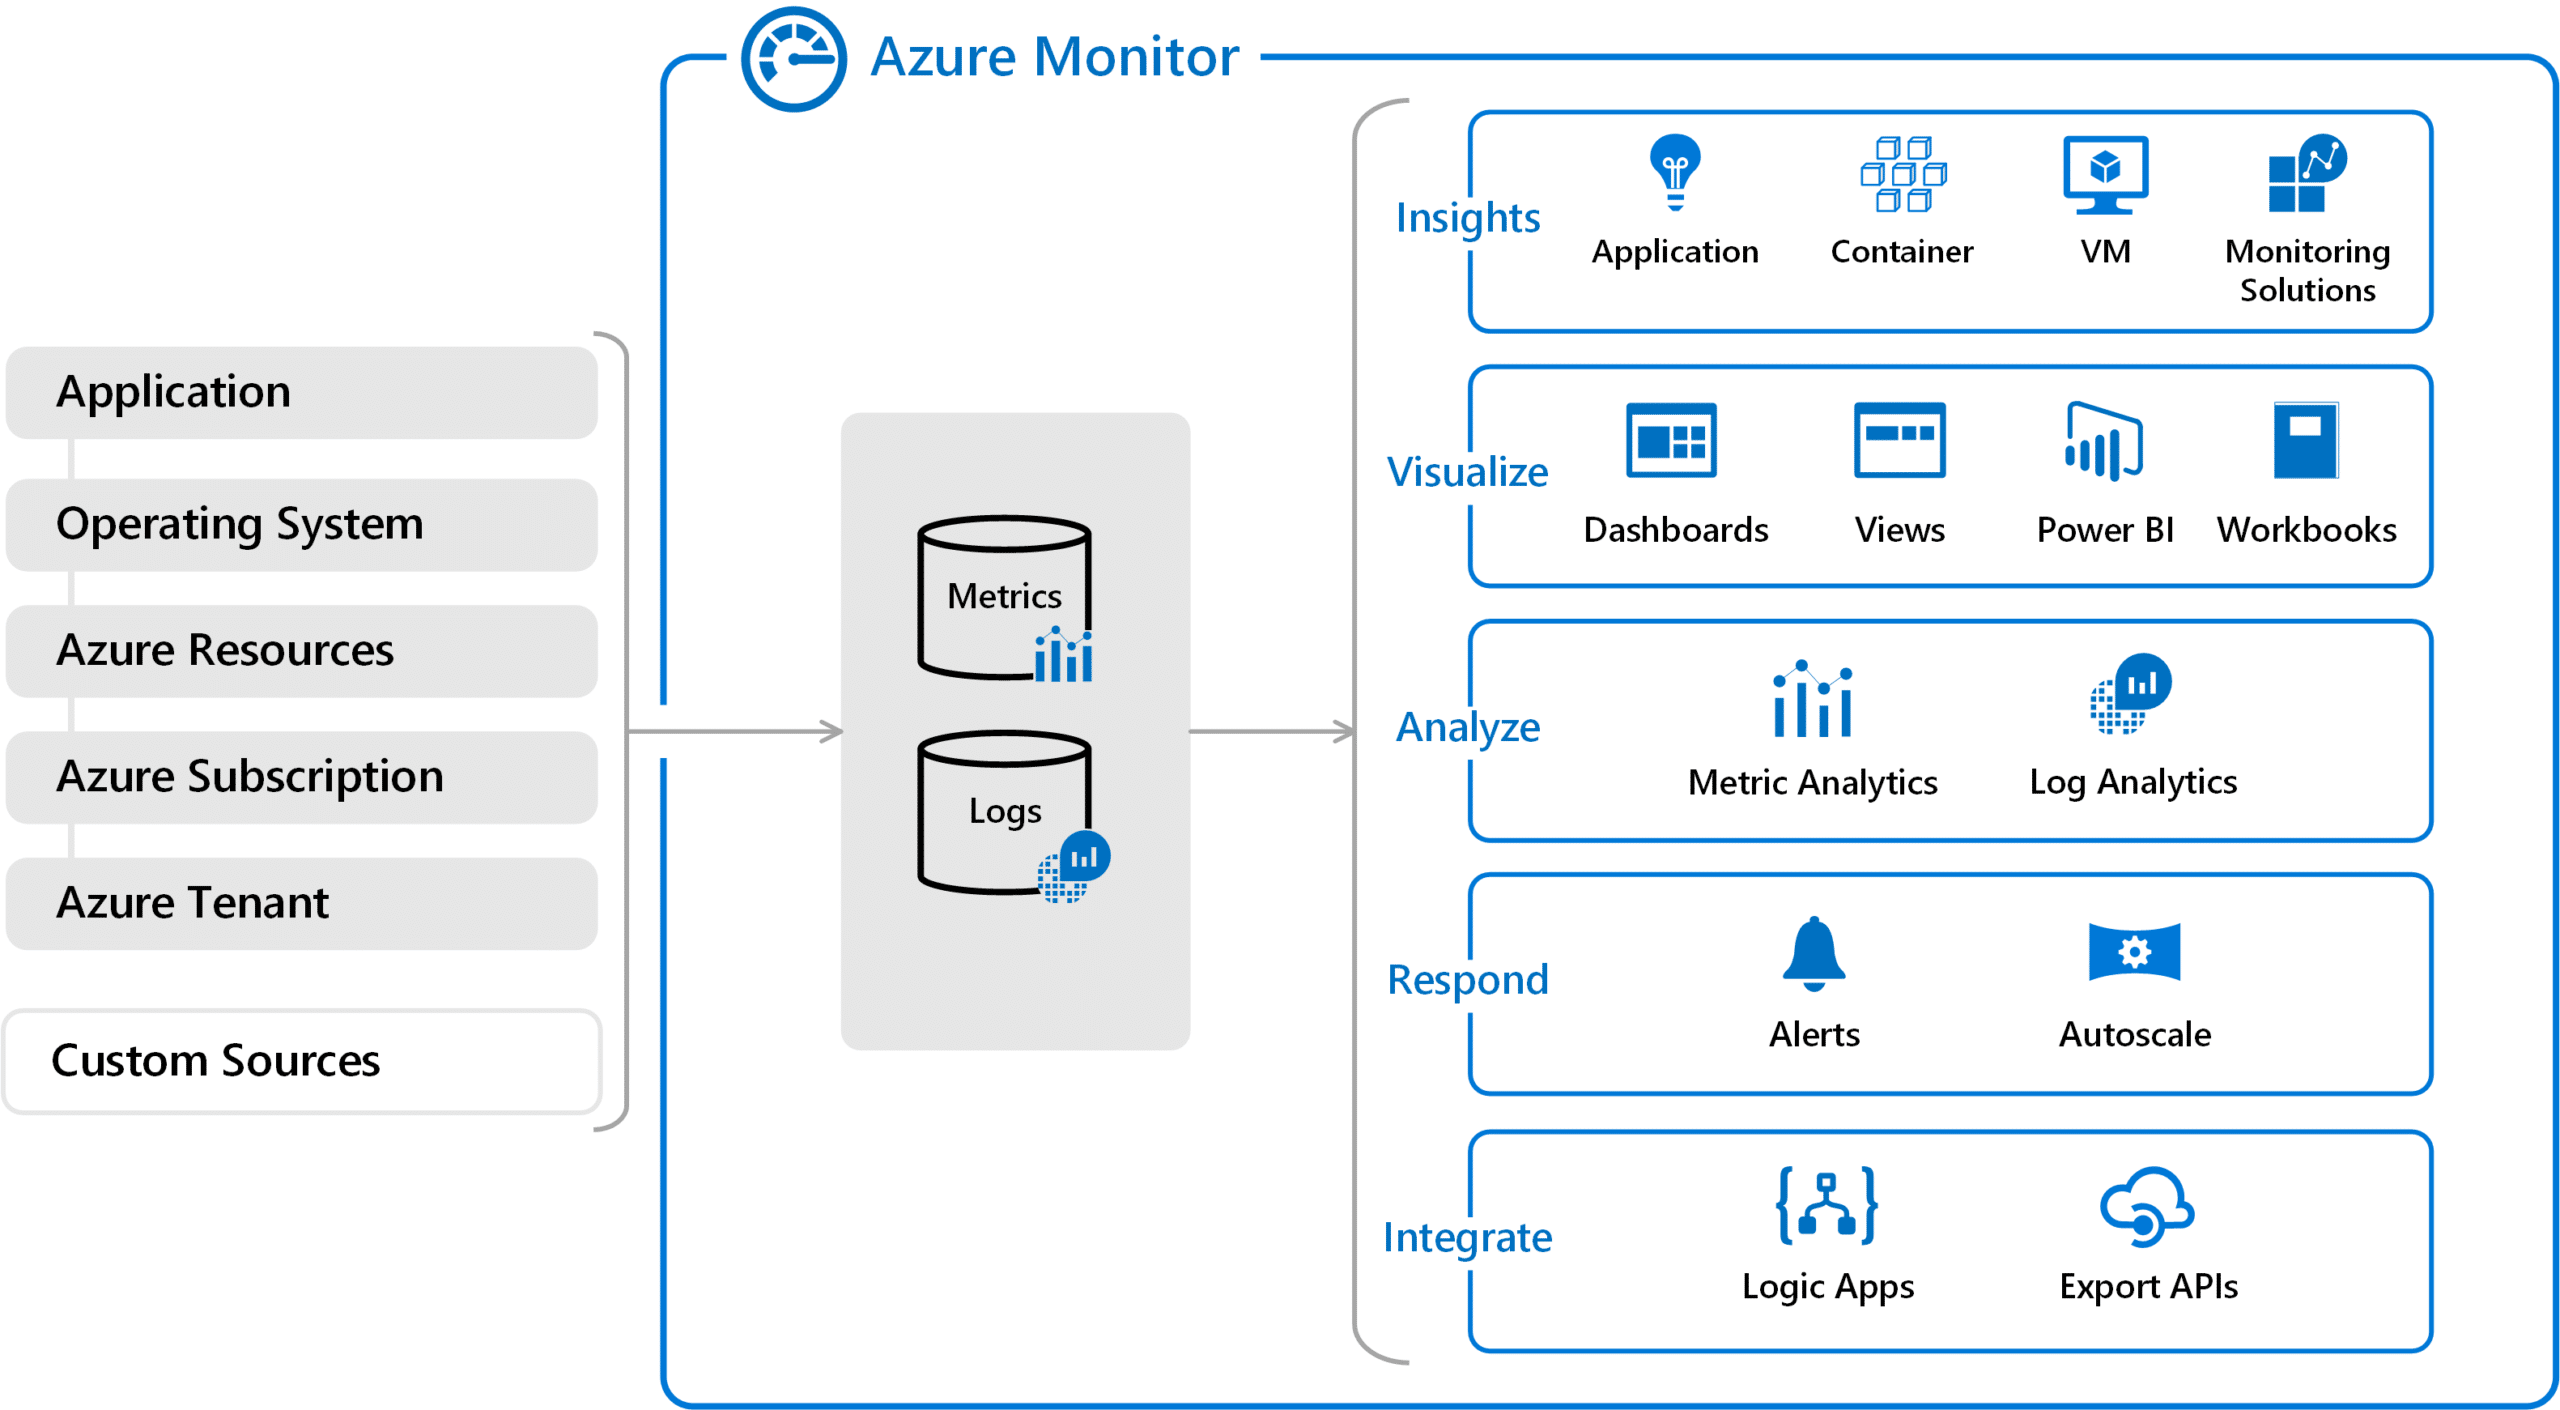
Here are some more features of Azure Monitor:
- Application Insights: Detects and diagnoses issues across applications and dependencies.
- Correlates Infrastructure Issues: VM insights and container insights.
- Smart Alerts: Can be coupled with automated actions in response.
- Made for the Platform by the Platform Makers: Administrators don’t face an uphill battle when configuring, running, and troubleshooting it – integrates well into Azure.
As you can see, this is an effective tool that is capable enough in its own rights, and could even meet all your requirements. And if it works for you, that is all well and good.
But, we think you should know that there are options out there and some of them might even impress you enough with their additional features and extended capabilities that make them easier to work on wider network architectures, with customized configurations, for example, because they cover scopes that are complex and larger.
Try Microsoft Azure for FREE for 12 months.
How do we define an Azure monitoring tool?
We can define Azure monitoring tools as:
Azure monitoring tools are software solutions that assist in the different aspects of managing and monitoring the cloud infrastructure, software, services, and applications that are offered by Microsoft as part of Azure – their cloud computing services.
Of course, as we have just seen, these monitoring tools can be products from either Microsoft itself or a number of other third-party solutions providers.
Once installed, the Azure monitoring tools help administrators detect, troubleshoot, and resolve issues across the whole cloud computing stack covering applications, VMs, containers, and everything else residing or connected to the platform.
Meanwhile, their data logging and reporting features help preserve the history of every event that occurred in any part of the cloud service – or beyond – which also helps in forensic data analysis.
What type of data do Azure monitoring tools track?
These tools keep track of data that includes:
- Application – data regarding the performance and functionality of code.
- Azure resource – data related to the operation of an Azure resource.
- Azure tenant – data about the operation of tenant-level Azure services.
- Azure subscription – data concerning the operation and management of Azure subscriptions.
- Virtual machine and cloud services – system data and logging data on VMs.
- Application insight – data related to Application Performance Monitoring (APM).
- Azure Active Directory reporting – data regarding users’ sign-in and system activities.
- Activity logs – data collected on operations performed on resources.
- Network security logs – data on traffic flowing through a network.
The best Azure monitoring tools
1. ManageEngine ADAudit Plus (FREE TRIAL)

ManageEngine ADAudit Plus is an auditing and monitoring tool built to give organizations close oversight of Active Directory, Entra ID, file servers, and workloads. It records changes as they happen, helping teams strengthen security and support compliance with standards such as GDPR, HIPAA, and SOX.
Key Features:
- Real-Time Auditing: Records changes across Active Directory, Azure AD, file servers, and workloads as they happen, giving administrators immediate visibility into important events.
- Predefined Reports: Includes more than 200 built-in reports for compliance, security, and operational auditing, making regulatory reviews and forensic work easier to handle.
- File Server Monitoring: Watches file and folder activity, including creation, deletion, and modification events, to help protect data integrity across local and cloud environments.
- Real-Time Alerts: Issues immediate notifications when suspicious events occur, including unauthorized access attempts, privilege escalation, and critical configuration changes.
- Compliance Management: Supports requirements such as GDPR, HIPAA, and SOX through detailed audit records and compliance-focused reporting.
- User Activity Tracking: Follows sign-ins, permission updates, and group changes to maintain a clear record for security review and accountability.
- Centralized Dashboard: Brings monitored activity into one view so teams can review patterns, spot anomalies, and respond to threats more quickly.
- Integration Capabilities: Connects with other ManageEngine tools and SIEM platforms, extending functionality and making the platform easier to scale.
- Role-Based Access Control: Lets administrators assign access and responsibilities by role, improving both operational control and security.
- Forensic Analysis: Supplies detailed logs and reports for investigating security incidents, helping teams resolve issues faster and limit the impact.

Why do we recommend it?
ManageEngine ADAudit Plus earns a spot on our list due to its strong identity-focused monitoring capabilities in Azure environments. It’s particularly effective at tracking user behavior, alerting on anomalies, and delivering compliance-ready reports across hybrid setups. For organizations managing both on-prem Active Directory and Azure AD, it offers a centralized way to audit and analyze activity. Its real-time alerting and detailed log analytics help IT teams proactively respond to potential security threats.
Who is it recommended for?
ADAudit Plus is best suited for organizations that are heavily invested in Microsoft environments, especially those transitioning from on-prem Active Directory to Azure AD. It’s ideal for security teams and compliance officers who need detailed audit trails and user behavior analytics. Enterprises in regulated industries will benefit from its built-in compliance reports. It’s also valuable for IT admins looking to maintain visibility across hybrid identity infrastructures.
Pros:
- Azure AD Activity Tracking: Provides in-depth monitoring of user sign-ins, group changes, and permission modifications in Azure AD.
- Real-Time Alerting: Sends instant alerts for suspicious Azure login attempts, policy changes, or unauthorized access.
- Audit-Ready Reporting: Includes prebuilt Azure-specific reports for compliance frameworks like HIPAA, GDPR, and SOX.
- Hybrid Environment Support: Seamlessly monitors both on-prem Active Directory and Azure AD in a single interface.
Cons:
- Complex Initial Setup: Configuring hybrid monitoring for both on-prem and Azure AD can be time-consuming without guidance.
Whether it is tracking user behavior, identifying security gaps, or ensuring regulatory compliance, ManageEngine ADAudit Plus provides a comprehensive and cost-effective solution for organizations looking to strengthen their security posture and streamline IT operations. You can assess this package by accessing a 30-day free trial.
EDITOR'S CHOICE
ManageEngine ADAudit Plus is our top choice for Azure monitoring because it brings Entra ID auditing and on-premises AD auditing into one platform. It follows events such as sign-ins, group changes, permission updates, and privilege escalations, creating a detailed record that helps administrators investigate suspicious activity and keep tighter control over hybrid environments. With 200 predefined reports and customizable alerts, it gives IT teams a more direct way to monitor activity and spot risky changes quickly. The platform also extends into Azure file servers, where it records file and folder events such as creation, deletion, and modification. That adds another layer of visibility for organizations that need to protect sensitive data across both cloud and on-premises systems. Real-time alerts for suspicious access attempts strengthen its security value, while the centralized dashboard and reporting functions make compliance work easier to manage. Its integrations with other ManageEngine tools and SIEM platforms also make it easier to scale in larger environments.
Download: Download a 30-day FREE Trial
Official Site: https://www.manageengine.com/products/active-directory-audit/azure-active-directory-logs-audit-tool.html
OS: Windows Server, AWS, and Azure
2. Progress WhatsUp Gold (FREE TRIAL)

WhatsUp Gold is a robust solution for monitoring your Azure environment. Its many capabilities ensure that you have detailed control and visibility into your Azure VMs, so you can identify and plug wasteful spending. It also helps with identifying the root cause of problems and performing a wide range of analyses on the performance, health, and costs of your Azure environment.
Key Features:
- Real-time Monitoring: Continuously monitors your Azure environments for insights.
- Resources Tracking: Tracks the usage of your Azure VMs to understand how well they are being used by your organization.
- Optimized Spending: Identifies your unused and underused resources to improve their usage and reduce wasteful spending.
- Root Cause Identification: Pinpoints the exact root cause for quick remediation.
- Custom Dashboards: Creates custom dashboards to display information about specific metrics.
- Trend Analysis: Stores information for many years to help with trend analysis.
Why do we recommend it?
WhatsUp Gold monitors your Azure environments to gather information about performance and usage. It dissects and analyses this information and presents the findings on custom dashboards to help you make important decisions. It is cloud-based, hence no installation or deployment is required. Also, its intuitive dashboards are easy to use.
With WhatsUp Gold, you can find unused and underused resources and take steps to improve their utilization rate. These insights will help you save on costs, resulting in optimized outputs for every dollar you spend. More importantly, it can send alerts when your spending inches close to your budget, so you can make the necessary tweaks to prevent overspends. Its dashboards and charts are also excellent.
Who is it recommended for?
It works well for network engineers, cloud specialists, and IT teams who want to ensure the smooth functioning of their Azure environments and optimize their spending. It is also a good choice for MSPs who manage Azure environments for their clients.
Pros:
- Monitors End-user Experience: Monitors metrics like response times and frequency of use to understand user experience and adoption.
- Optimizes Costs: Tracks your usage and optimizes your spending.
- Custom Alerts: Generates alerts when your spending inches towards your budget.
- Detailed Reports: Generates detailed reports to improve performance.
Cons:
- Complex: it can be complex for new users.
WhatsUp Gold offers two plans – Premium and Total Plus. Start a 30-day free trial.
3. ManageEngine Applications Manager (FREE TRIAL)

ManageEngine Applications Manager Azure monitoring capabilities provide deep insights into the performance of applications running on Azure, leveraging seamless integration with various Azure services like Azure App Services, Azure SQL Database, and Azure VMs. It offers real-time analytics and detailed metrics, allowing for granular tracking of application health and performance.
Key Features:
- Azure Service Integration: Seamlessly connects with various Azure services for comprehensive monitoring.
- Real-Time Analytics: Provides instant insights and data analysis specific to Azure environments.
- Customizable Dashboards: Tailor your monitoring view to focus on Azure application metrics.
- Automated Root Cause Analysis: Quickly identifies and resolves issues within Azure applications.
- User-Friendly Interface: Easy navigation and operation for managing Azure services.
- End-to-End Azure Visibility: Complete visibility into transactions and performance of Azure-hosted applications.
- Scalability: Supports Azure applications of all sizes with scalable solutions.
- Cross-Platform Integration: Integrates Azure monitoring with other tools and platforms seamlessly.
- Alerting System: Customizable alerts to keep you informed of critical issues in Azure applications.
- Performance Optimization: Tools to enhance the performance and user experience of Azure-hosted applications.

Why do we recommend it?
ManageEngine Applications Manager is a solid choice for organizations looking for broad monitoring that includes Azure services. It supports real-time tracking of performance metrics for core Azure components like virtual machines, databases, and apps. What sets it apart is its ability to unify monitoring across on-premise systems, other cloud platforms, and Azure in one dashboard. Its alerting and dependency mapping features are particularly useful for maintaining availability and troubleshooting issues quickly.
Who is it recommended for?
This tool is ideal for mid-sized to large enterprises that use Azure as part of a broader hybrid or multi-cloud infrastructure. It’s well-suited for IT operations teams that want centralized visibility across diverse platforms. Application support teams will also benefit from the performance metrics and alerting tools for Azure workloads. Companies focused on uptime and service delivery across complex environments will find strong value in its consolidated monitoring approach.
Pros:
- Azure Service Monitoring: Monitors key Azure services like App Services, SQL Database, and Virtual Machines with deep performance insights.
- Customizable Alerts: Triggers alerts based on predefined thresholds or anomalies in Azure service behavior.
- Dependency Visualization: Offers clear mapping of Azure service dependencies to help identify root causes quickly.
- Unified Monitoring Console: Allows you to view Azure resources alongside other on-prem and cloud applications in one dashboard.
Cons:
- Performance Overhead: Large-scale Azure environments may experience slowdowns in data refresh or visualization.
The tool’s automated root cause analysis rapidly identifies bottlenecks and issues within the Azure environment, facilitating quick resolution and minimal downtime. Additionally, its customizable dashboards and robust alerting system ensure that IT teams can tailor their monitoring setup to meet specific operational requirements and maintain optimal performance. You can start by downloading a 30-day free trial.
4. Turbo360 Azure Monitoring (FREE TRIAL)

Turbo360 (formerly Serverless360) is a package of operational tools for monitoring Azure services. The system can define logical applications, which are based on groups of Azure services. This simplifies their monitoring because Azure provides separate streams of statistics for each of its services. The dashboard for this Business Applications service shows live performance data for each logical application as if it really was a single unit.
Key Features:
- Comprehensive Azure Visibility: Offers full-stack insights across Azure services including App Services, Service Bus, and Azure Functions.
- Customizable Dashboards: Build personalized views to monitor specific resources and KPIs relevant to your Azure environment.
- Proactive Alerting: Sends instant alerts based on thresholds or anomalies in Azure performance metrics.
- Dependency Mapping: Visualizes inter-service dependencies for quicker root cause identification and impact analysis.
- Automated Issue Detection: Identifies performance degradation and service disruptions in real time using intelligent algorithms.
Why do we recommend it?
Turbo360 is a top recommendation for Azure monitoring due to its robust operational tools that simplify the monitoring of Azure services. The platform’s unique feature of defining logical applications facilitates a comprehensive view of live performance data in a unified dashboard, simplifying the monitoring of grouped Azure services. The Business Activity Monitoring tool with distributed tracing provides real-time insights into business processes and application interactions, enhancing troubleshooting capabilities. Configurable expectation thresholds and alerting mechanisms, integrated with popular channels like Slack and Microsoft Teams, ensure timely notifications for effective incident management. Whether deployed as a SaaS platform, virtual appliance, or individual modules within Azure accounts, Turbo360 caters to diverse deployment needs.
The logical applications will be included in an application dependency map so that you can identify the services and resources that feed into them and the applications that use their services. This map makes root cause analysis easier in case performance issues arise.
The Business Activity Monitoring tool in the Turbo360 platform implements distributed tracing. This watches each of your business processes as they activate leading applications and then continues to follow activity as each supporting application and service gets triggered. This system provides live performance displays in the Turbo360 dashboard and also writes to log files, which can be queried in the event of a problem.
Who is it recommended for?
Turbo360 is recommended for organizations and Azure users seeking a comprehensive monitoring solution tailored to Azure services. Its logical application grouping is particularly beneficial for businesses with complex Azure architectures, offering a consolidated view of live performance metrics. The platform is ideal for IT administrators, system engineers, and Azure-focused teams looking for a flexible monitoring solution with configurable alerting mechanisms. The Business Activity Monitoring tool makes it suitable for enterprises prioritizing detailed insights into business processes and application interactions. Turbo360’s compatibility with popular collaboration tools further enhances its appeal for streamlined Azure monitoring.

The system administrator can set expectation thresholds on each of the metrics that the Turbo360 system provides. If one of those levels gets crossed, the Serverless360 monitor generates an alert. The system alerts can be forwarded to key technicians by Slack, PagerDuty, Webhook, or Microsoft Teams.
The third module in the Turbo360 platform is the Azure Documenter. This tracks the utilization of resources in each Azure account. The package produces a summary of activity at the end of each day, and this can be used to check Azure invoices for metered services.
The Turbo360 system is available as a SaaS platform. It is also possible to install the package on your own servers to run as a virtual appliance. Another option available is to get each module as a service within your Azure account. In terms of pricing, the Business Application Monitoring and Management module starts at $150 month, the Business Activity Monitoring end-to-end distributed tracing module (BAM) starts at $300 per month, and the Azure Documenter starts at $49 per month. All modules are billed annually. You can learn more about Turbo360 with a free demo. You can also start a 15-day free trial.
5. Site24x7 Azure Monitoring (FREE TRIAL)

Site24x7 Azure Monitoring is part of a cloud-based infrastructure package that checks on the functions of all of the software that supports user-facing interfaces. This includes virtualizations and cloud platforms. The Azure monitor in Site24x7 Infrastructure will keep track of the performance of the services that you subscribe to on Azure as well as the operating system of the platform. The Site24x7 system is also able to monitor AWS, Google Cloud Platform, and Microsoft Office cloud servers.
Key Features:
- Comprehensive Monitoring Service: For more than 100 native Azure services including the apps, containers, databases, and storage management systems that will be implementing the various services that you subscribe to on Azure.
- Tracking System: Identifies the root cause of poor performance or errors in your front-end apps by chaining back through the dependencies to the real resources that are failing.
- System of Alerts: Notifies technicians if service errors on Azure are identified, allowing your IT operations team to leave the monitoring to Site24x7 knowing that they will be notified if problems arise.
- AI-Based Detection System: Spots combinations of processes that spell trouble when resources are locked and processes are hanging and works out why.
- Automated Remediation: Ensures that problems are dealt with even when all of the technicians are out of the office. Standard maintenance actions can also be taken care of with out-of-hours automated processes.
- Multi-Tenancy Structure: Suitable for the needs of managed service providers, keeping the data and operations of each client completely separate.
Why do we recommend it?
Site24x7 Azure Monitoring stands out as a comprehensive cloud-based infrastructure solution that effectively monitors various aspects of software, including virtualizations and cloud platforms. The system’s ability to monitor over 100 native Azure services, covering apps, containers, databases, and storage management, ensures a thorough examination of subscribed Azure services. Site24x7’s distinctive feature is its tracking system, which efficiently identifies the root cause of performance issues by tracing dependencies back to the underlying resources. The AI-based detection system enhances troubleshooting by identifying problematic process combinations and resource issues, contributing to proactive issue resolution. With automated remediation actions and multi-tenancy support, Site24x7 caters to the needs of IT operations teams and managed service providers.
Who is it recommended for?
Site24x7 Azure Monitoring is recommended for organizations and IT operations teams seeking a robust cloud-based infrastructure monitoring solution. It is particularly suitable for users heavily invested in Azure services, offering comprehensive monitoring for a wide range of native Azure services. The tracking system and AI-based detection make it ideal for businesses prioritizing quick identification and resolution of performance issues. Additionally, Site24x7’s multi-tenancy support makes it a valuable choice for managed service providers, ensuring separate data and operations for each client. The free version, monitoring up to five servers or URLs, serves as an excellent starting point for smaller-scale monitoring needs.
Site24x7 Infrastructure is offered as a base package, called Starter, which can be built upon with add-on services, which are paid extras. There is a free version, which will just monitor the uptime of up to five servers or URLs. Get started with a 30-day free trial .
6. Paessler PRTG Network Monitor (FREE TRIAL)

With the PRTG Network Monitor from Paessler, we get a collection of monitoring systems for networks, servers, and applications that reside on cloud platforms like Azure. It is used to monitor network devices, bandwidth, servers, applications, virtual environments, remote systems, IoT, and much more.
Key Features:
- Custom Sensor Creation: Supports user-defined sensors for tailored monitoring of specific systems or metrics.
- Automatic Network Discovery: Scans and maps your entire network to quickly identify all connected devices.
- Cloud & Virtual Environment Support: Offers out-of-the-box monitoring for AWS, Azure, VMware, and Hyper-V environments.
- Distributed Monitoring: Enables monitoring across multiple locations using remote probes.
- Flexible Licensing Model: Offers scalable licensing based on sensor count rather than devices, making it adaptable for businesses of all sizes.
Why do we recommend it?
Paessler PRTG Network Monitor earns our recommendation as a versatile and comprehensive solution designed to monitor networks, servers, and applications, including those on cloud platforms like Azure. The tool’s user-friendly features, such as auto-discovery and pre-configured device templates, facilitate a seamless onboarding process for users, whether they are starting or transitioning from another network monitoring tool. PRTG provides a centralized dashboard offering a comprehensive overview of an organization’s entire Azure infrastructure, ensuring continuous monitoring of critical components such as virtual machines. The availability of specialized sensors for Azure, particularly from partner AutomonX, enhances the tool’s ability to collect and report relevant metric values for Azure resources. Furthermore, its alerting capabilities, integration with Microsoft Azure and Martello iQ, and diverse notification options contribute to its effectiveness in ensuring proactive issue resolution.
Getting started or switching from another network monitoring tool is easy thanks to the PRTG auto-discovery and pre-configured device templates. Once installed on Windows Server it gets to work:
- It provides a comprehensive overview of an organization’s entire Azure infrastructure through a centralized, customizable dashboard.
- PRTG makes sure Microsoft Azure virtual machines are up and running around the clock.
- Its Microsoft Azure Virtual Machine Sensor monitors the status of each VM and displays CPU usage – as well as used and remaining CPU credits.
- Paessler’s partner AutomonX offers a pack of 18 Azure sensors for PRTG which also collects relevant metric values and information and reports back to PRTG and provides custom error limits in a form that is understandable by the EXE/Script Advanced Sensor.
- In case of issues, it can be configured to give prompt alerts – administrators simply define threshold values and then choose how they want to receive alerts: via SMS, email, or push notification.
- Also, with its full integration with Microsoft Azure and Martello iQ, all Azure resources are tracked and their performance or availability is viewable in one dashboard.
Who is it recommended for?
Paessler PRTG Network Monitor is recommended for organizations and IT professionals seeking a robust and user-friendly solution for network, server, and application monitoring, especially in Azure environments. The tool’s versatility makes it suitable for a wide range of monitoring needs, from network devices and bandwidth to virtual environments and IoT. It is particularly beneficial for users managing Microsoft Azure resources, offering specialized sensors to monitor and track the status of virtual machines. The seamless integration with Microsoft Azure and Martello iQ provides a centralized view of Azure resources, streamlining monitoring efforts. With a 30-day unlimited free version available, PRTG Network Monitor allows users to experience its capabilities before transitioning to the free version after the trial period.
Download an unlimited 30-day free version of Paessler PRTG Network Monitor (after 30 days, the tool reverts to a free version).
7. AppDynamics Application Performance Monitoring (APM)

The Application Performance Monitoring (APM) tool is AppDynamics‘ solution for managing an enterprise Azure cloud stack – from the end-user in front to the database servers in the back. Administrators can use APM to track and identify – and then troubleshoot and resolve – any performance issues in applications as well as services like Azure Cloud Services, Microsoft Azure Queue, Microsoft Azure Remote Services, VMs, and Microsoft SQL Server instances.
Key Features:
- Business Transaction Monitoring: Tracks end-to-end performance across complex user journeys and backend services.
- Dynamic Baselines & Anomaly Detection: Uses AI to learn normal performance patterns and flags deviations automatically.
- Auto-Discovery of Application Topology: Automatically maps relationships between application components as they change.
- Cloud-Native Monitoring: Supports modern architectures including microservices, containers, and cloud deployments.
- Integration with DevOps Tools: Connects with CI/CD pipelines and popular tools like Jenkins, PagerDuty, and ServiceNow.
Why do we recommend it?
AppDynamics APM stands out as a powerful solution for effectively managing and optimizing enterprise Azure cloud stacks, providing end-to-end visibility from user interfaces to backend database servers. The tool’s comprehensive features empower administrators to track, identify, troubleshoot, and resolve performance issues across various components, including applications, Azure Cloud Services, Microsoft Azure Queue, VMs, and Microsoft SQL Server instances. The automatic discovery, mapping, and visualization of application topology within Azure enable rapid identification of performance-affecting components. AppDynamics APM leverages AI-powered problem identification and root cause analytics for efficient monitoring and troubleshooting, ensuring a seamless user experience. The emphasis on business transaction monitoring further enhances its ability to provide insights into user experiences and transaction flows, making it a top choice for organizations seeking robust Azure cloud performance management.
In fact, a point that needs to be mentioned here about AppDynamics production monitoring is that the key unit of measurement is business transactions. It can auto-discover business transactions that end users are experiencing in the application giving a better insight into UX as well as understanding how transactions flow across, and inside, each application tier, role, and service.
Who is it recommended for?
AppDynamics APM is recommended for enterprises and administrators seeking an advanced and comprehensive solution for monitoring and optimizing Azure cloud environments. Specifically designed for managing production applications in Azure, the tool’s capabilities extend to Azure Cloud Services, VMs, and more. It caters to organizations looking to accelerate application migration to Azure by providing automatically generated application topology maps, business correlation, and resource utilization tracking. The AI-powered analytics make it suitable for fast and accurate monitoring and troubleshooting of applications, clusters, and core cloud infrastructure. With a focus on business transaction monitoring, AppDynamics APM is well-suited for organizations prioritizing user experience and aiming for quick mean time to recovery or mean time to restore (MTTR).
Start a 14-day FREE trial of AppDynamics Application Performance Monitoring (APM).
8. SolarWinds Server & Application Monitor (SAM)

SolarWinds Server & Application Monitor (SAM) is the tool for a complete performance monitoring of an Azure environment – including all applications and infrastructures involved – be it in the cloud, on-premises or in a hybrid setup. It comes with both agent and agentless monitoring capabilities.
Key Features:
- Template-Based Monitoring: Includes 1200+ pre-built templates for servers, applications, and services to speed up deployment.
- Performance Baselines: Learns normal behavior to help identify anomalies and performance degradations over time.
- Application Dependency Mapping: Visualizes application relationships and dependencies to streamline troubleshooting.
- Cloud and Hybrid Environment Support: Offers deep monitoring for AWS, Azure, and hybrid environments.
- Intelligent Alerting System: Configurable alerts reduce noise and prioritize critical issues based on impact.
Why do we recommend it?
SolarWinds Server & Application Monitor (SAM) stands out as a top choice for comprehensive Azure monitoring due to its ability to provide complete performance insights across Azure environments, covering applications and infrastructure in the cloud, on-premises, or in hybrid setups. SAM’s versatile monitoring capabilities, including both agent and agentless options, offer a holistic view of systems, applications, and infrastructure performance, irrespective of their location. The tool excels in Azure PaaS monitoring, tracking key metrics for services like App Service, Event Hubs, and SQL Database, as well as Azure IaaS monitoring, ensuring efficient tracking of services such as virtual machines (VMs) and Kubernetes. SAM’s dynamic baselining, auto-discovery, and historical performance analysis contribute to its effectiveness in maintaining optimal Azure architecture health.
A single dashboard gives insights into systems, applications, and infrastructure performance, again, regardless of where they reside.
The tool’s monitoring can be divided into two broad categories:
- Azure PaaS monitoring – performance monitoring for PaaS services such as App Service, Event Hubs, and SQL Database.
SAM is designed to monitor, trend, and correlate key Azure services and metrics for many Microsoft software products, such as Windows, Office 365, Exchange, and SQL Server. It also monitors critical Azure components such as CPU, memory, requests, response times, and more for your dynamic Azure workloads.
- Azure IaaS monitoring – monitor and track the performance for IaaS services such as virtual machines (VMs) and Kubernetes.
SAM has auto-discovery capabilities to ensure any Azure VM or container starts being monitored as soon as it is created. It also monitors network communication between the VMs themselves, or with other applications, and visualizes it in dynamic maps.
Who is it recommended for?
SolarWinds SAM is recommended for businesses and IT professionals seeking a robust Azure monitoring solution capable of handling diverse environments, including cloud, on-premises, and hybrid setups. It is particularly well-suited for enterprises with complex Azure architectures and a mix of PaaS and IaaS services. The tool’s dynamic baselining and alerting features make it valuable for organizations aiming to establish performance benchmarks and ensure optimal service delivery. With its user-friendly interface and comprehensive monitoring capabilities, SAM is ideal for IT administrators, system engineers, and enterprises looking to streamline Azure performance monitoring efficiently.
You can try a fully functional SolarWinds Server & Applications Manager (SAM) through a 30-day free trial.
9. Datadog

Thanks to its partnership with Microsoft, Datadog can be natively embedded in the Azure portal. This allows the tool to build streamlined experiences for purchasing, configuring, and managing it directly from inside the portal.
Key Features:
- Full-Stack Observability: Monitors infrastructure, applications, logs, and user experience from a single platform.
- Out-of-the-Box Integrations: Includes 600+ built-in integrations with popular services like AWS, Azure, Kubernetes, and Docker.
- AI-Powered Anomaly Detection: Automatically detects performance anomalies using machine learning.
- Distributed Tracing: Follows requests across services and containers for precise root cause identification.
- Infrastructure as Code Support: Integrates with Terraform, CloudFormation, and other IaC tools for seamless deployments.
Why do we recommend it?
Datadog is recommended for its seamless integration with Microsoft Azure, allowing native embedding in the Azure portal. This unique integration streamlines the user experience for purchasing, configuring, and managing Datadog directly from within the Azure portal. As a monitoring and analytics tool, Datadog excels in providing comprehensive insights into Azure infrastructure, covering servers, databases, and applications. Its partnership with Microsoft enhances its suitability for DevOps teams, enabling effective monitoring of distributed architectures, including containers and cloud instances. The Datadog Application Performance Monitoring (APM) offers robust tools for collecting, searching, and analyzing traces, making it invaluable for investigating service disruptions. The platform’s advanced dashboards, reporting capabilities, and the ability to monitor alerts enhance its overall effectiveness in performance monitoring and issue resolution.
As for the tool itself, it is a monitoring and analytics tool that can be used to determine performance metrics as well as event monitoring for the Azure infrastructure as a whole. And it is because it can monitor services such as servers, databases, and applications in particular that Datadog is useful to DevOps teams.
Datadog collects and correlates all the data streaming in from these complex environments and makes sense of it all with extensive support for over 40 Azure services via easy-to-install integrations.
Who is it recommended for?
Datadog is recommended for DevOps teams, administrators, and organizations seeking a powerful monitoring and analytics tool tailored for Azure environments. Its native integration with the Azure portal makes it an excellent choice for users who prefer a unified experience within the Azure ecosystem. The tool’s versatility in monitoring various components, including servers, databases, and applications, caters to the diverse needs of organizations managing complex infrastructure. Datadog’s focus on Application Performance Monitoring (APM) makes it particularly suitable for investigating service disruptions and ensuring optimal application performance. The platform’s user-friendly dashboards and reporting functionalities enhance its appeal for administrators looking to drill down into performance metrics and troubleshoot issues efficiently.
Download a 14-day FREE of Datadog.
10. LogicMonitor

The LogicMonitor Azure Monitoring tool is offered as a Software-As-a-Service-based (SaaS) automated monitoring service. The tool focuses on the infrastructure and application performance of Azure resources –regardless if it is running on-premises, in the cloud, or on hybrid cloud architecture.
Key Features:
- Unified IT Infrastructure Monitoring: Monitors networks, servers, applications, and Azure cloud resources from a single platform.
- Automated Device Discovery: Instantly detects and begins monitoring devices using SNMP, WMI, and APIs.
- AI-Driven Forecasting & Alerts: Uses machine learning to predict issues and reduce alert noise with intelligent thresholds.
- Cloud & Hybrid Support: Offers deep visibility into AWS, Azure, GCP, and on-prem environments.
- Dynamic Topology Mapping: Automatically generates visual maps of infrastructure relationships and dependencies.
Why do we recommend it?
LogicMonitor is recommended for its comprehensive Software-as-a-Service (SaaS) automated monitoring service designed to focus on both infrastructure and application performance across Azure resources. Whether deployed on-premises, in the cloud, or within hybrid cloud architectures, LogicMonitor provides a unified solution. The LM Exchange serves as a centralized repository for LogicMonitor’s extensive collection of technology integrations, offering over 2,000 pre-built integrations covering major platforms such as AWS, Cisco, and Microsoft. This broad integration capability simplifies data collection, visualization, and alerting, making it an ideal choice for organizations with diverse technology stacks. LogicMonitor’s cloud monitoring strategy addresses resource performance, Azure availability, and Return on Investment (ROI), providing a holistic view of cloud infrastructures.
The LM Exchange is a central repository for LogicMonitor’s growing collection of technology integrations. These integrations, or LogicModules, are templates and instructions that tell the system what data to collect, how to collect it, how to show it, and how to alert on it. With over 2,000 pre-built integrations covering AWS, Cisco, Microsoft, and more, LM Exchange makes it easy to find, customize, update, and share out-of-the-box templates.
This visibility is achieved with a cloud monitoring strategy that includes the three components critical to measuring the overall health of cloud infrastructures:
- Resource Performance Monitoring – tracking various Azure components to make sure they run efficiently
- Azure Availability Monitoring – ensuring high uptimes for the whole cloud infrastructure
- ROI Monitoring – check and balancing investment in the platform for optimal ROI
The tool makes migrations to the cloud more manageable and cost-effective with LM Cloud’s complete cloud monitoring strategy.
There’s more:
- Administrators get instant visibility into their cloud deployment with automatic discovery of resources across regions, services, and accounts; they are the first to know of Azure availability issues that may impact services.
- It eliminates gaps in monitoring with out-of-the-box application and OS-level metrics that complement data collected via its Azure Monitor.
- The tool visualizes the health of an Azure cloud deployment with automated dashboards and reports.
What is impressive about LogicMonitor is that it helps with the financial cost-benefit analysis of an Azure installation, as a whole, by monitoring and analyzing the overall cost of subscriptions, services, operations, and much more. This means administrators will never be caught by surprise when it comes to settling their bills.
Who is it recommended for?
LogicMonitor is recommended for organizations, administrators, and IT teams seeking a powerful and flexible cloud monitoring solution tailored for Azure environments. Its SaaS-based approach makes it accessible and scalable for various deployment scenarios, including on-premises, cloud, or hybrid setups. The LM Exchange’s extensive library of integrations caters to users with diverse technology stacks, offering flexibility and ease of customization. Administrators looking for instant visibility into their Azure deployment, automatic resource discovery, and comprehensive monitoring of application and OS-level metrics will find LogicMonitor valuable. The tool’s ability to visualize Azure deployment health through automated dashboards and reports enhances its suitability for users focused on performance analysis and reporting. Additionally, LogicMonitor’s emphasis on financial cost-benefit analysis ensures transparency in managing Azure-related expenses, making it an excellent choice for administrators concerned about budgetary considerations.
Try LogicMonitor FREE for 14 days.
11. Sumo Logic Azure Management

Administrators using Sumo Logic Azure Management can expect a tool that supports Azure apps, services, and complex hybrid architectures. It is a tool that integrates with other popular tools. In fact, it integrates – quite effectively – with services like Azure Monitor, Event Hub, Azure Audit, Network Inspector, SQL, Active Directory, and more.
Why do we recommend it?
Sumo Logic Azure Management is recommended for its comprehensive support for Azure applications, services, and hybrid architectures, making it a valuable tool for administrators overseeing complex environments. The tool’s effective integration with various Azure services, including Azure Monitor, Event Hub, Azure Audit, Network Inspector, SQL, and Active Directory, ensures seamless collaboration with the Azure ecosystem. Sumo Logic’s use of machine learning for issue correlation enhances its capability to identify patterns, troubleshoot errors, and pinpoint root causes efficiently. Native integrations for popular technologies such as Kubernetes, Docker, Azure AKS, and Office 365, further extend its versatility. Sumo Logic Azure Management’s dedicated apps, including Azure Audit, Azure Web Apps, and Azure SQL, provide specialized monitoring and analysis features tailored for Azure deployments.
This, coupled with the fact that Sumo Logic Azure Management uses machine-learning for correlating issues, errors, and failures to detect patterns – helps in identifying and resolving root causes.
The tool gives a full insight into business tools with support for Microsoft Office 365, including monitoring and analysis of Office 365 audit logs. It also has native integrations for Kubernetes, Docker, Azure AKS, as well as other Azure functions.
In addition, Sumo Logic Azure Management also has dedicated apps that help with the smooth running of an Azure deployment which include:
- Azure Audit – sifts through Microsoft Azure Audit Logs and Active Directory information which helps in spotting threats and suspicious activity in real-time.
- Azure Web Apps – monitors the performance of web applications with the help of data from the Azure web server and application diagnostic logs that is then converted into real-time
- Azure SQL – keeps an eye on the health and performance of Azure SQL Databases.
What stands out with Sumo Logic Azure Management is perhaps the fact that administrators can satisfy local data sovereignty and privacy requirements with Sumo Logic’s global deployments that include locations in Europe, Asia, and the U.S.
Who is it recommended for?
Sumo Logic Azure Management is recommended for administrators and IT teams responsible for managing Azure environments, especially those with diverse and hybrid architectures. Its ability to integrate with critical Azure services makes it suitable for users leveraging various components of the Azure ecosystem. Administrators seeking advanced capabilities, such as machine learning-driven issue correlation and support for Microsoft Office 365 monitoring, will find Sumo Logic Azure Management beneficial. The tool’s dedicated apps, focusing on Azure Audit, Azure Web Apps, and Azure SQL, cater to specific monitoring needs, offering specialized insights into Azure components.
Start a FREE trial of Sumo Logic Azure Management.
12. Dynatrace Azure Monitoring

Dynatrace Azure Monitoring offers advanced observability for the entire stack of the Azure infrastructure. Administrators get insights into their installation’s traces, metrics, and logs.
Once the tool has found an asset via auto-discovery – which is a non-stop process to ensure the architecture map is up-to-date at all times – it goes on to automatically monitor Azure cloud services like App Service, Database Performance, AKS, HDInsight, and more.
There are even more features from this tool:
- Hit the ground running – its automated deployment ensures total coverage across all Azure applications and the infrastructure they sit on without manual deployment, configuration, or updates necessary.
- Administrators can achieve visibility into every part of their Azure installation – at the level of hosts, VMs, containers and orchestration, network, devices, logs, events, and more – with the help of AI-assisted issue tracking.
- This AI – called “Davis” – continuously analyzes billions of dependencies to provide precise root cause analysis allowing resolutions to occur in mere minutes, and before any negative impacts occur.
- Davis continuously baselines performance and adapts as the environment changes; it offers deeper insights as it automatically captures transactions across the stack – from server to the code level.
- This Azure monitoring tool serves as a single, reliable source of mission-critical performance data that administrators find to be crucial as they try to manage their cloud service single-handedly or collaboratively as a team.
Why do we recommend it?
Dynatrace Azure Monitoring is recommended for its advanced observability capabilities that provide comprehensive insights into the entire Azure infrastructure stack. The tool’s auto-discovery feature ensures continuous updates to the architecture map, automatically monitoring critical Azure cloud services such as App Service, Database Performance, AKS, and HDInsight. With automated deployment, configuration, and updates, administrators can quickly achieve total coverage across all Azure applications and infrastructure without manual intervention. The AI-driven issue tracking, powered by “Davis,” analyzes billions of dependencies for precise root cause analysis, enabling rapid resolutions before any negative impacts occur. Dynatrace serves as a single, reliable source of mission-critical performance data, offering clear and accurate feedback for effective cloud service management.
The clear, accurate feedback and information administrators receive paints a complete picture of any issue so they can focus on quick resolution instead of panicking – even if there is a major crisis.
Who is it recommended for?
Dynatrace Azure Monitoring is recommended for administrators and teams responsible for managing Azure environments, especially those requiring advanced observability and automated monitoring capabilities. The tool’s comprehensive coverage, including hosts, VMs, containers, orchestration, network, devices, logs, and events, makes it suitable for users seeking visibility into every aspect of their Azure installations. Organizations dealing with mission-critical applications and services will benefit from Dynatrace’s AI-driven issue tracking, ensuring rapid and precise root cause analysis. Whether managing the cloud service individually or collaboratively as a team, administrators will find Dynatrace to be a reliable solution for effective performance monitoring and issue resolution.
Try Dynatrace Azure Monitoring FREE for 15 days.
Which Azure monitoring tool is right for you?
We have come to the end of our post on the eight best Azure monitoring tools. We hope you have found the information useful. If you think we have missed an Azure monitoring tool please, let us know about it. Leave us a comment below.