When Amazon Web Services (AWS) was first launched in 2006, no one could have anticipated that it would become the leading cloud service provider in the world. Countless enterprises use legacy networks with decentralized cloud services. In a cloud computing environment, it’s more important than ever that companies have Amazon Web Services monitoring tools to monitor performance.
Here is a list of the eight best Amazon web services monitoring tools:
- SolarWinds Server & Application Monitor (FREE TRIAL) Server and application monitoring solution with autodiscovery for EC2 instances and EBS volumes. It includes a dashboard, out-of-the-box templates, and a configurable alerts system.
- ManageEngine Applications Manager (FREE TRIAL) Application monitoring platform with autodiscovery for EC2 and RDS cloud instances. It monitors AWS EC2, RDS, S3, SNS, ELB and more.
- Site24x7 (FREE TRIAL) Server monitoring tool that can group supervision of servers located anywhere and also in the cloud. This is a cloud-based service.
- Paessler PRTG Network Monitor (FREE TRIAL) Free network monitoring tool that can monitor CloudWatch data. It includes a range of pre-configured sensors and alerts for AWS EC2, ELB, EBS, RDS, and more.
- Opsview Cloud Cloud monitoring tool that monitors AWS EC2, ELB, RDS, S3, Auto Scaling, DynamoDB, and more. It includes pre-configured packs to help monitor performance.
- Dynatrace Application performance monitor that automatically discovers AWS EC2 instances. It integrates data from the AWS cloud watch. Includes additional features like dependency mapping and AI.
- AppDynamics Application performance management tool with monitoring for AWS ECS, Amazon EC2, EKS, Fargate, and more. It includes features like anomaly detection and AI-driven root cause analysis.
- LogicMonitor Network monitoring software that can monitor AWS CloudWatch metrics. It is compatible with AWS, EC2, EKS, ECS, Amazon RDS, DynamoDB, ElastiCache, ELB, and more.
Our methodology for selecting an AWS monitoring tool
We reviewed the market for AWS penetration testing systems and analyzed tools based on the following criteria:
- Feature Set: The range of functionalities offered by the tool, including real-time monitoring, log management, application performance monitoring, infrastructure monitoring, auto-discovery, and customization options.
- Ease of Use: How user-friendly the interface is, considering setup complexity and ongoing management requirements.
- AWS Integration: Strength of the tool’s integration with AWS services, including pre-built dashboards, metrics, and native functionality for AWS-specific resources.
- Cost: Pricing structure of the tool, considering factors like subscription models, free tiers, and cost-effectiveness for your needs.
- Scalability: The tool’s ability to handle monitoring large and complex AWS deployments as your environment grows.
- Focus Area: Whether the tool leans more towards application performance monitoring, infrastructure monitoring, or offers a more balanced approach.
- User Reviews and Reputation: Positive reviews and established reputation within the AWS monitoring community.
By considering these factors, the list offers a variety of tools that cater to different needs and budgets. It’s recommended to explore free trials or demos before making a final decision.
The best Amazon web services monitoring tools
1. SolarWinds Server & Application Monitor (FREE TRIAL)

SolarWinds Server & Application Monitor, or SAM, is a server and application monitoring tool that can be used to optimize the performance of AWS cloud services. With SolarWinds Server & Application Monitor you can automatically discover EC2 instances and EBS volumes.
Key Features:
- Cloud Monitoring: Integrates with your AWS account via APIs to gather performance metrics and health checks.
- Application Performance: Monitors applications deployed on AWS instances, pinpointing performance issues.
- Application Dependency Mapping: Shows how applications rely on each other and underlying AWS resources.
- Cross-Stack Visibility: Correlates data from various AWS services to understand performance bottlenecks.
- Customization: Offers pre-built templates and lets you customize which metrics to track and alert on.
- Alerting: Sets off notifications when performance deviates from defined thresholds.
Why do we recommend it?
SolarWinds Server & Application Monitor provides comprehensive monitoring for Amazon Web Services (AWS), offering deep visibility into cloud resources, including EC2 instances, RDS databases, and S3 storage. Its pre-configured monitoring templates and customizable dashboards simplify setup and ensure efficient tracking of AWS performance and costs.
Performance data is displayed through the dashboard, which includes a number of visualization options such as graphs and status icons making it easy to read from a glance. The software comes with out-of-the-box templates you can use to monitor your environment.
To speed up remediation time, SolarWinds Server & Application Monitor has an alerts system. The alerts systems let you configure alerts that notify you about issues like AWS throttling, AWS exceeded limits and status failures. Notifications are delivered by email and SMS.
Who is it recommended for?
This tool is best suited for organizations heavily reliant on AWS infrastructure and seeking a unified solution to monitor both cloud and on-premises resources. It is particularly valuable for IT teams aiming to optimize cloud performance, manage costs, and proactively address potential issues.
Pros:
- Unified Monitoring: Manages both on-premises and AWS resources from a single interface.
- Ease of Use: Relatively user-friendly interface compared to some more complex monitoring tools.
- Detailed Insights: Provides in-depth views of application health and performance within AWS.
- Scalability: Handles monitoring large and complex AWS environments.
- Out-of-the-Box Templates: Pre-built templates streamline monitoring setup, especially for AWS environments.
- 30-Day Free Trial: Users can try SAM for free for 30 days before committing to a purchase.
Cons:
- Limited Native AWS Features: Lacks some functionalities of dedicated AWS monitoring tools.
- Complexity: Setting up and customizing monitoring can be complex for beginners.
- Cost: Can be expensive for users who only need basic AWS monitoring.
Server & Application Monitor offers a complete server and application monitoring experience that comprehensively covers AWS infrastructure. SolarWinds Server & Application Monitor starts at $2,995 (£2,275). You can download the 30-day free trial.
2. ManageEngine Applications Manager (FREE TRIAL)

ManageEngine Applications Manager is a real-time application monitoring program with AWS monitoring. The software automatically discovers EC2 and RDS cloud instances. The tool collects performance data on CPU usage, latency, storage space, memory, network traffic, and more.
Key Features:
- Multi-Tiered Monitoring: Provides visibility into your entire AWS stack, from cloud servers to applications.
- AWS-Specific Metrics: Tracks key performance indicators (KPIs) of your AWS resources like EC2 instances, S3 buckets, and Lambda functions.
- Cloud Cost Management: Offers insights into your AWS resource utilization for cost optimization.
- Anomaly Detection: Uses machine learning to identify unusual patterns in AWS performance metrics, helping you proactively address potential problems.
- Alerting: Triggers notifications when AWS performance metrics breach predefined thresholds.
- AWS Cloud Instance Discovery: The software automatically discovers EC2 and RDS cloud instances, simplifying setup and configuration.
Why do we recommend it?
ManageEngine Applications Manager offers robust monitoring for Amazon Web Services (AWS), providing insights into key metrics such as EC2 performance, RDS instance health, and EBS utilization. Its user-friendly interface and pre-configured templates streamline AWS monitoring, enabling quick identification of performance issues and resource optimization opportunities.
You can use the platform to monitor AWS services such as Amazon Elastic Compute Cloud (EC2), Amazon Relational Database Service (RDS), Amazon Simple Storage Service (S3), Amazon Simple Notification Service (SNS), Amazon Elastic Load Balancing (ELB), and more.
For EC2 monitoring, ManageEngine Applications Manager gathers information on availability, health, disk I/O, memory and disk utilisations, latency, volume I/O, and network traffic (all of this information can be viewed as pie charts and graphs).
You can use the alerts system thresholds that notify you about changes to your cloud environment via email and SMS. Once you see the alert you can then start the diagnostic process. The Root Cause Analysis (RCA) window can help you to troubleshoot and find the root cause.
Who is it recommended for?
This tool is ideal for businesses leveraging AWS infrastructure that require real-time visibility and proactive management of their cloud services. It’s particularly beneficial for IT teams managing hybrid environments, as it combines AWS monitoring with on-premises application and server management capabilities.
Pros:
- Unified Platform: Monitors both on-premise and AWS infrastructure from a single console.
- Ease of Use: Known for a user-friendly interface compared to some feature-rich monitoring tools.
- Deep Visibility: Offers comprehensive views of AWS performance and resource health.
- Automatic Instance Discovery: The automatic discovery of EC2 and RDS instances simplifies the monitoring setup process.
Cons:
- Pricing Information: The lack of publicly available pricing information means potential users need to request a quote directly from ManageEngine, which can be inconvenient for some organizations.
- Learning Curve: Like many comprehensive monitoring tools, Applications Manager may have a steep learning curve for new users to fully utilize its features and customization options.
- Focus on Applications: Leans more towards application performance monitoring, so infrastructure-centric monitoring might require additional tools.
ManageEngine Applications Manager is a good fit for enterprises that want to monitor the performance of AWS and other applications from one location. To find out the pricing information, you’ll need to request a quote from the company directly. You can download the 30-day free trial.
3. Site24x7 (FREE TRIAL)

Site24x7 Infrastructure is a cloud-based server monitoring system that is part of a wider platform of system administration tools. The Infrastructure tool also monitors the applications and services that support user-facing software and maps their dependencies.
Key Features:
- Cloud-Based Server Monitoring: Can monitor servers regardless of their location.
- Application and Service Monitoring: Supports user-facing software and maps their dependencies.
- Customizable Monitoring with Plugins: Customization through specialized plugins called “integrations,” including a range of AWS plugins for services like EC2, Lambda, Elastic Beanstalk, Elastic Container Service, Kubernetes Service, and Lightsail Instance.
- Performance Thresholds and Alerts: Metrics monitored by the Infrastructure module are subject to performance thresholds. When performance drops below acceptable levels, alerts are generated.
Why do we recommend it?
Site24x7 provides comprehensive monitoring for Amazon Web Services (AWS), offering detailed insights into over 60 AWS services, including EC2, RDS, Lambda, and S3. Its unified dashboard, anomaly detection, and cost analytics make it a powerful tool for tracking performance, optimizing resources, and managing AWS expenses effectively.
This monitoring system is able to supervise servers wherever they are located. It can be tailored by the addition of specialized plugins, called “integrations” that add the capabilities of interfacing with specific products. There is a long list of AWS plugins available for Site24x7 Infrastructure. These include:
- AWS EC2
- AWS Lambda
- AWS Elastic Beanstalk
- AWS Elastic Container Service
- AWS Elastic Kubernetes Service
- AWS Lightsail Instance
These integrations each have their own tailored monitoring checks to perform; they don’t just apply standard monitoring processes to any and all resources that they supervise. Each service is tracked by a dedicated screen in the cloud-based dashboard, which can be accessed through any standard Web browser. Each screen in the dashboard can be customized through drag-and-drop widgets.
Each of the metrics that the Infrastructure module covers are subject to performance thresholds. These ensure that technicians don’t have to sit and watch the console of the monitoring service. When system performance drops below an acceptable level, the Site24x7 system generates an alert and sends out a notification to key staff through SMS messages or emails.
Who is it recommended for?
Site24x7 is an excellent choice for organizations seeking an all-in-one cloud monitoring solution to manage their AWS infrastructure alongside hybrid IT environments. It is particularly suited for IT teams that prioritize proactive issue detection, cost control, and simplified performance tracking across diverse AWS services.
Pros:
- Dedicated Monitoring Checks: Each integration has tailored monitoring checks specific to the service it monitors, providing detailed insights into performance.
- Customizable Dashboard: The customizable dashboard allows users to create personalized monitoring views tailored to their needs.
- Cloud-Based Access: Being cloud-based, Site24x7 can be accessed from anywhere with internet connectivity, making it convenient for remote monitoring.
- 30-Day Free Trial: Users can start with a 30-day free trial to evaluate the platform before making a purchase decision.
Cons:
- Dependency on Internet Connectivity: Since it’s cloud-based, stable internet connectivity is required for data collection and access to the dashboard.
- Pricing Model: The pricing structure and plans for Site24x7 may vary based on the features and integrations required, which can be a consideration for budget-conscious organizations.
Get started with a 30-day free trial .
4. Paessler PRTG Network Monitor (FREE TRIAL)
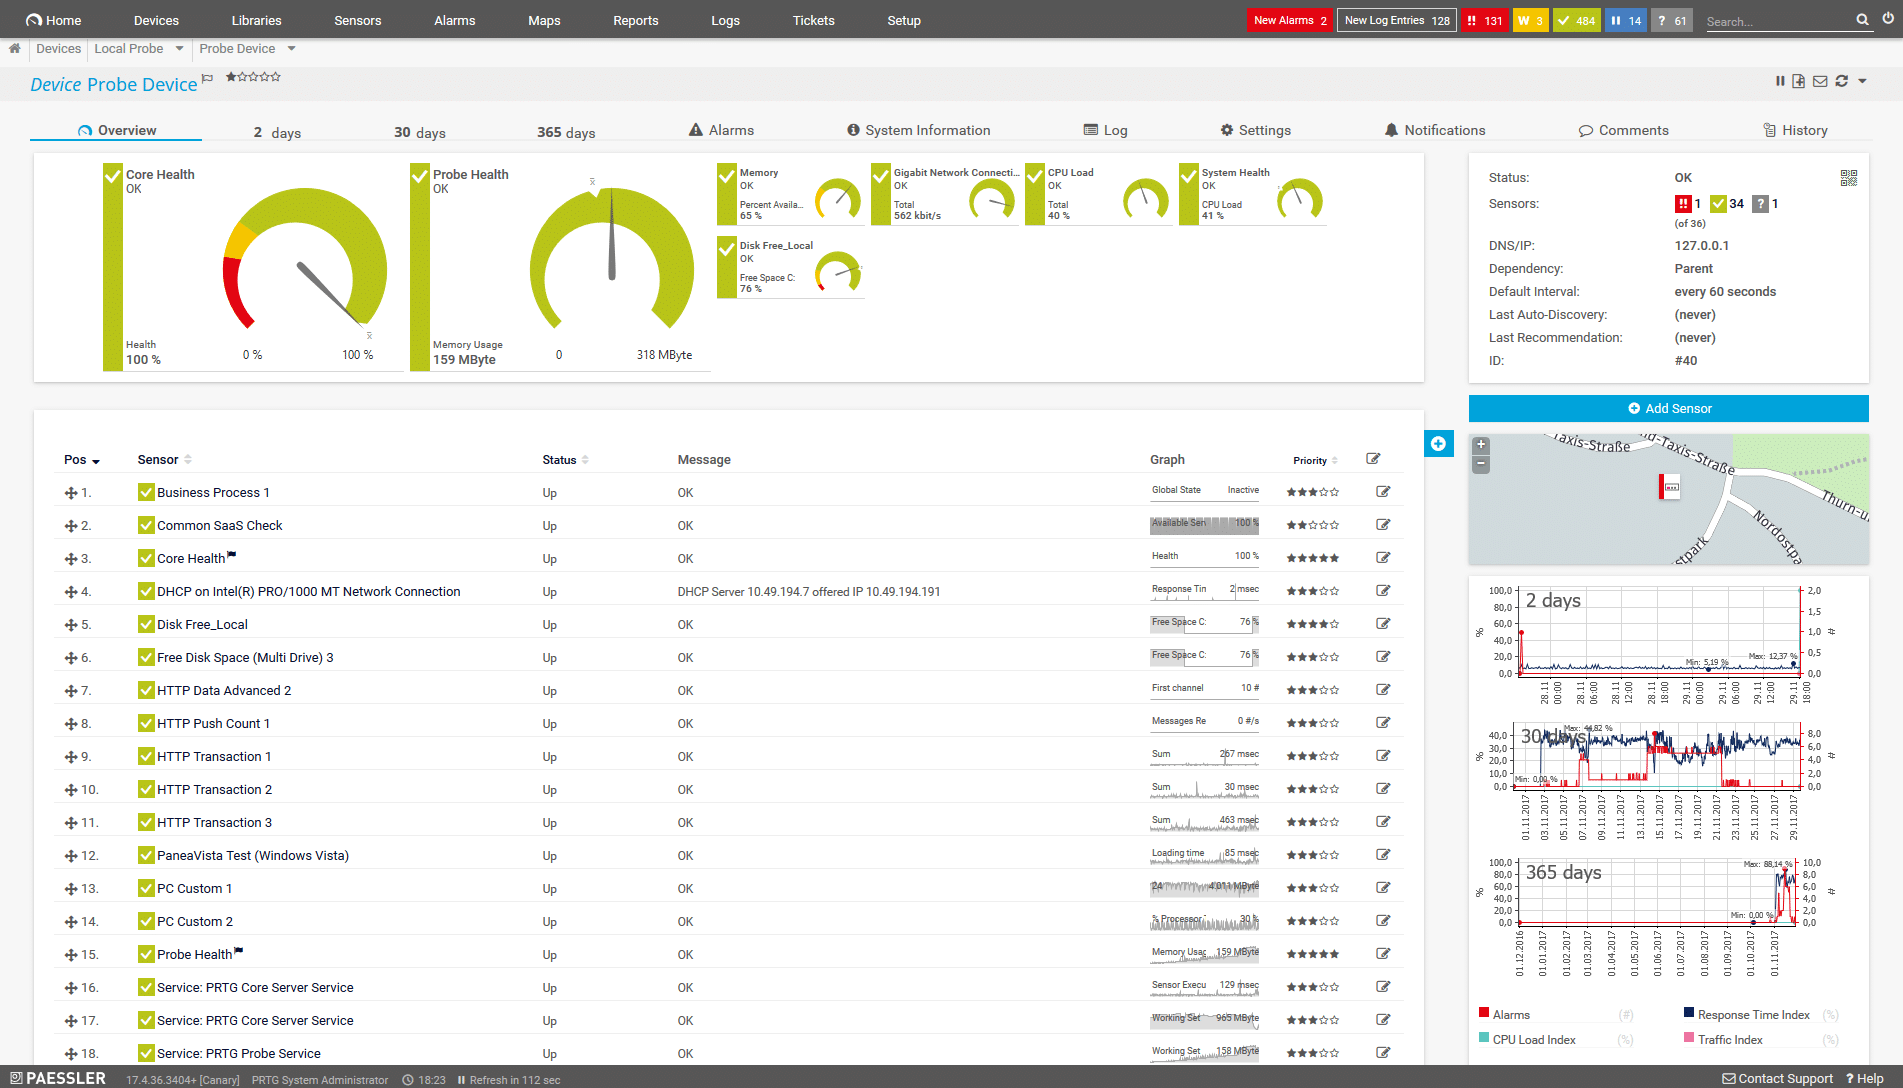
Paessler PRTG Network Monitor is a free network monitoring software that can monitor AWS. You can use it to view CloudWatch data, and more through a range of onboard sensors. The sensors display metrics that are relevant to the service you are trying to monitor, with dials to make the output easier to read.
Key Features:
- Free Network Monitoring Software: PRTG Network Monitor is a free network monitoring software that can monitor AWS services.
- CloudWatch Integration: Can view CloudWatch data and more using onboard sensors that display relevant metrics for monitoring AWS services.
- Onboard Sensors: Includes onboard sensors for monitoring Amazon EC2, EBS, ELB, RDS, and other AWS components, each focusing on different aspects of your AWS infrastructure.
- Monitoring Metrics: Sensors provide metrics like Disk Read, Disk Write, Downtime, Total Read Time, Total Write Time, and more for detailed monitoring.
- Configurable Alerts: PRTG Network Monitor has a configurable alerts system that notifies users via email, SMS, push notifications, Slack messages, etc., when parameters cross set thresholds.
Why do we recommend it?
Paessler PRTG Network Monitor offers comprehensive monitoring capabilities for Amazon Web Services (AWS), integrating seamlessly with AWS environments to track performance metrics across services like EC2, RDS, and EBS. Its pre-configured sensors and customizable dashboards provide real-time insights, enabling efficient resource management and proactive issue resolution.
These sensors offer monitoring for Amazon Elastic Cloud Computing (EC2), Amazon Elastic Block Store (EBS), Amazon Elastic Load Balancing (Amazon ELB), Amazon Relational Database Service (Amazon RDS), and more. Each sensor monitors a different component of your AWS infrastructure.
For example, if you want to monitor EBS then you can use the Amazon CloudWatch EBS Sensor. With the EBS sensor, you can monitor Disk Read, Disk Write, Downtime, Total Read Time, Total Write Time, and more. You can then use the configurable alerts system to notify you when a parameter crosses a certain threshold. Alerts can be sent through email, SMS, push notification, Slack message, and more.
Who is it recommended for?
This solution is ideal for organizations utilizing AWS infrastructure who require a unified monitoring tool to oversee both cloud-based and on-premises systems. IT teams seeking to enhance visibility into their AWS services and ensure optimal performance will find PRTG Network Monitor particularly beneficial.
Pros:
- Free Version: Accessible for smaller environments or those with limited monitoring needs.
- Simple Setup: Setup is straightforward, although an AWS CloudWatch account is required.
- 30-Day Free Trial: Users can try the software with a 30-day free trial before deciding on a paid version.
Cons:
- Sensor Limitations: The free version is limited to less than 100 sensors, which may not be sufficient for larger environments or extensive monitoring needs.
- Paid Upgrade Costs: While the free version is available, upgrading to higher sensor limits incurs costs starting at $1,600 (£1,222), which may be a consideration for budget-conscious organizations.
- Dependency on AWS CloudWatch: Users need an AWS CloudWatch account for full functionality, which adds a dependency on another service.
Setting up PRTG Network Monitor is simple, but you need to have an AWS CloudWatch account. PRTG Network Monitor is available for free for less than 100 sensors. If you need more sensors you can purchase an upgrade. Paid versions start at $1,600 (£1,222) for 500 sensors. You can download the 30-day free trial.
5. Opsview Cloud
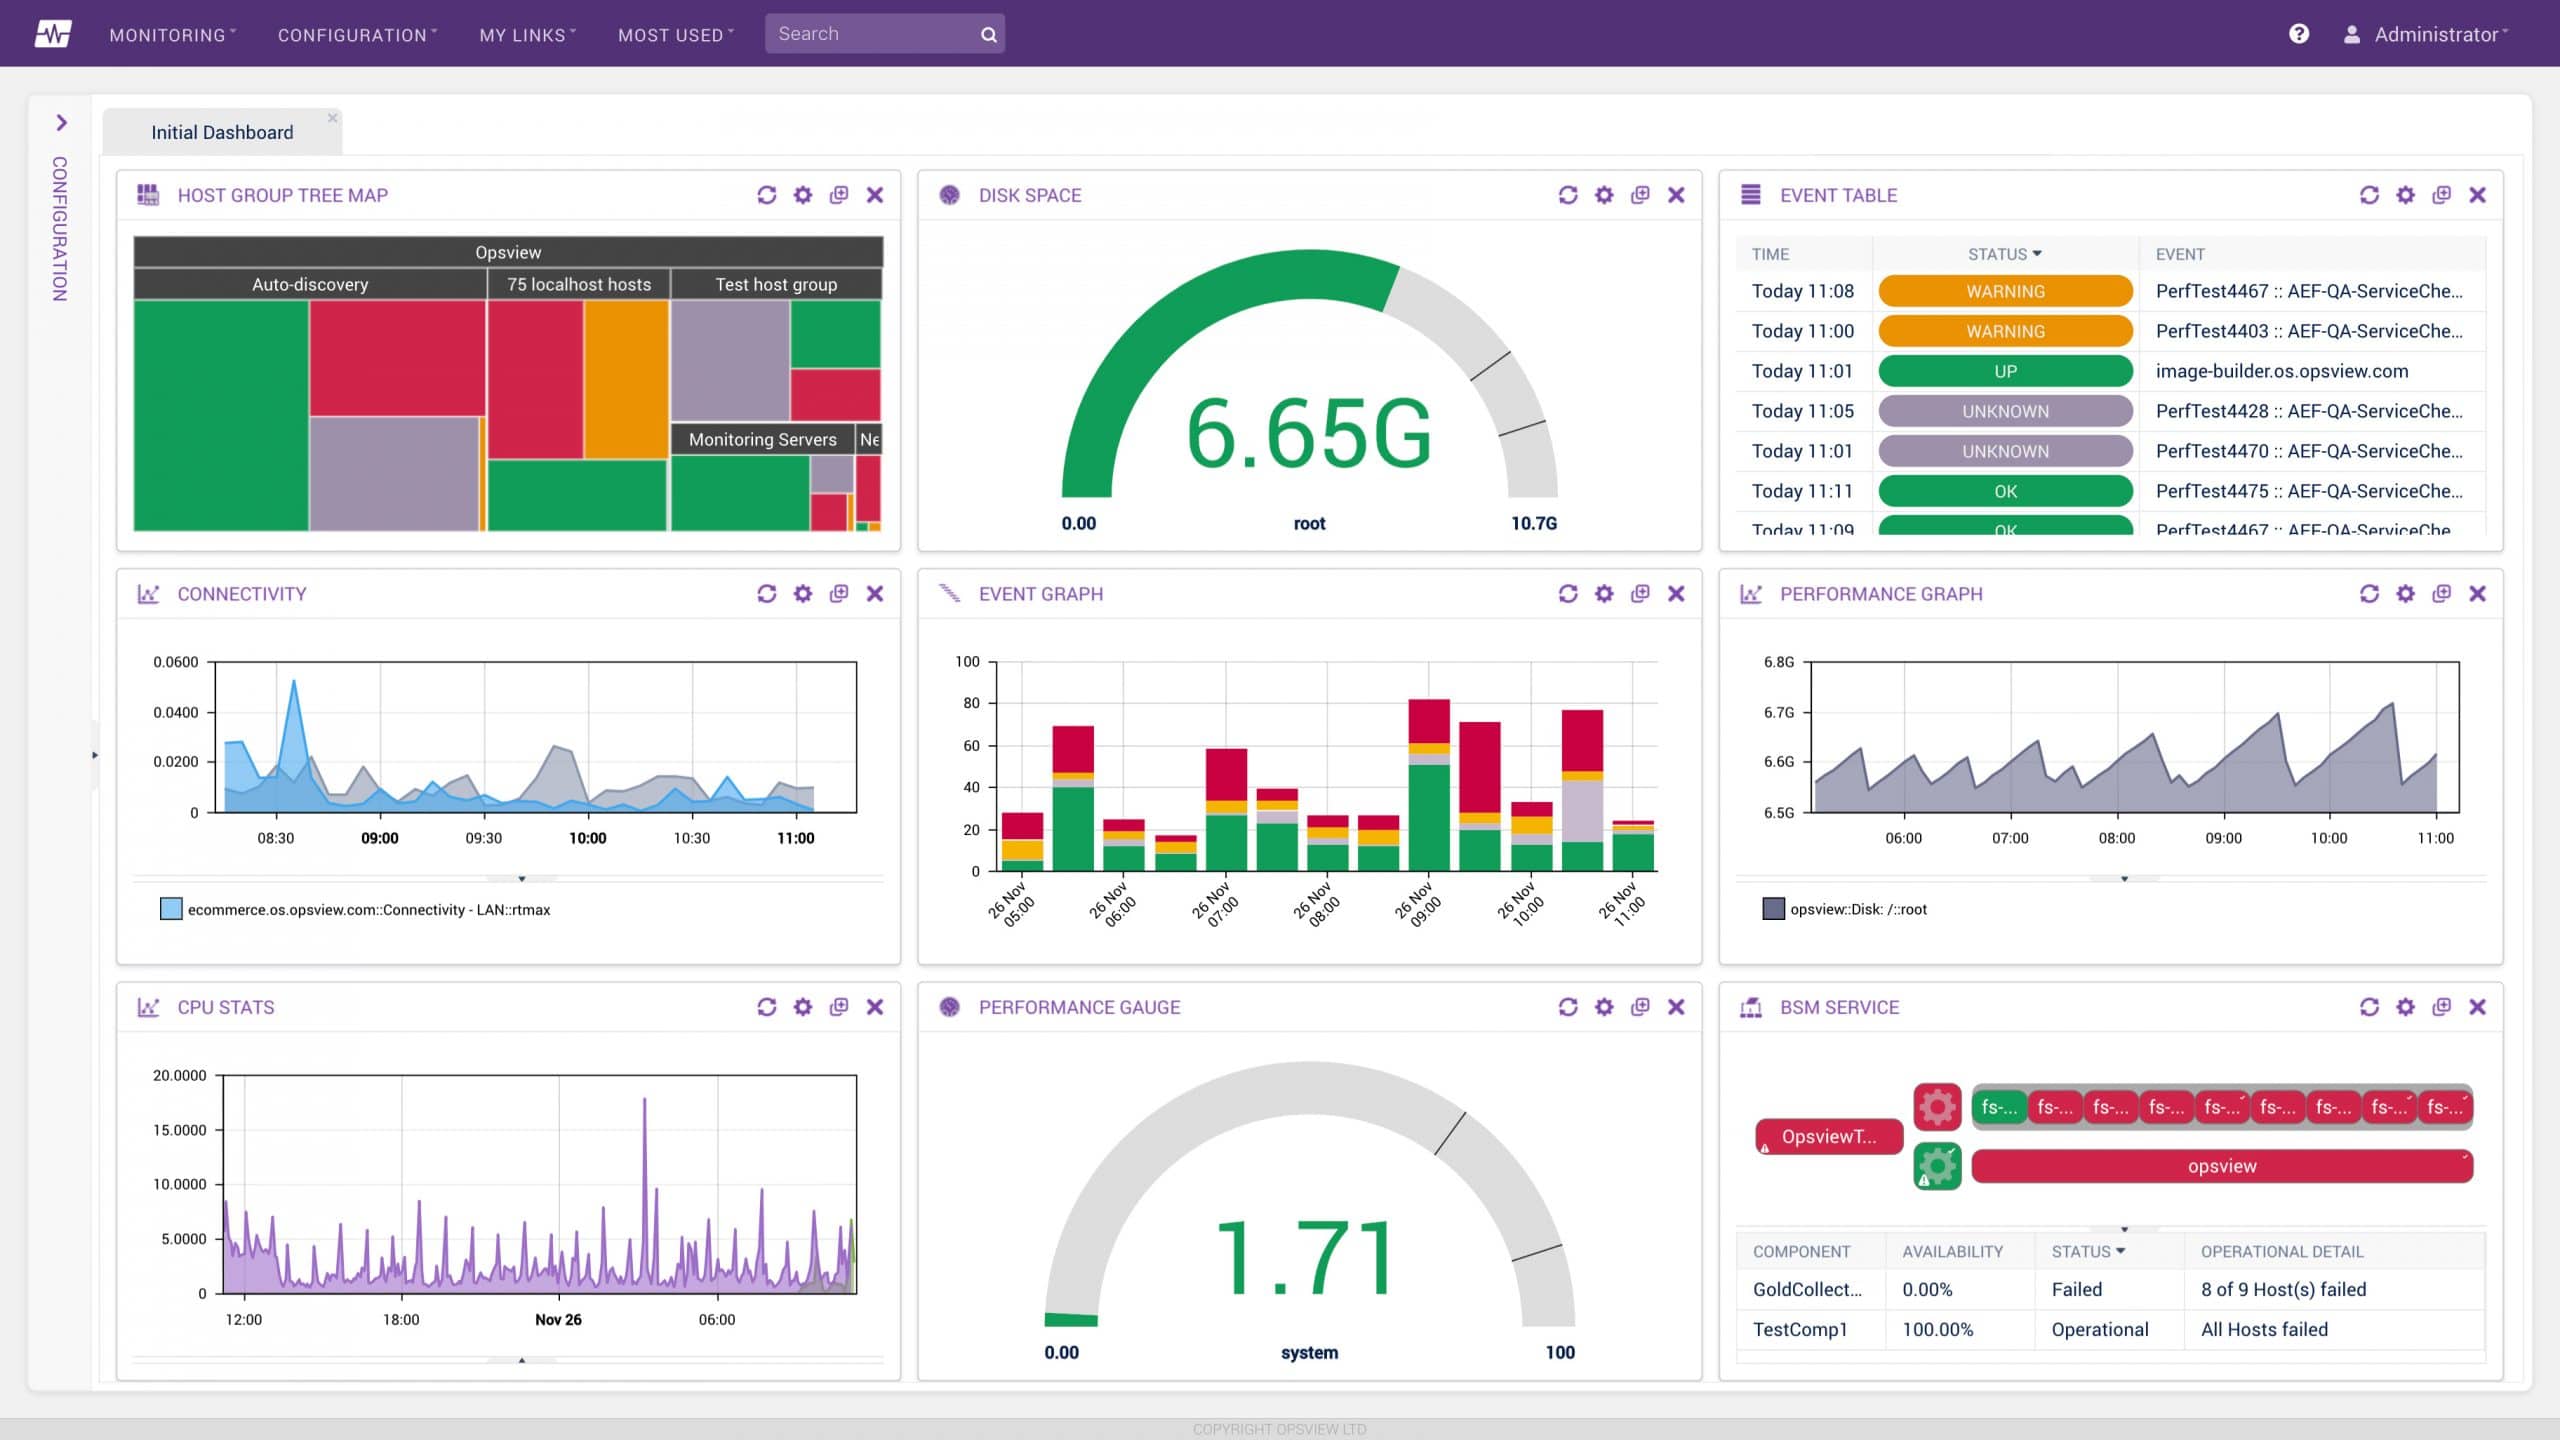
Opsview Cloud is a cloud monitoring solution that can monitor AWS. With Opsview Cloud you can monitor AWS Auto Scaling, AWS Custom, AWS DynamoDB, AWS EC2, AWS ELB, AWS RDS, AWS Route 53, and AWS S3. Each of these components has an Opspack available, that acts as a plugin. Each plugin records different performance metrics.
Key Features:
- Auto-Discovery and Configuration: Automatically discovers and configures monitoring for your AWS resources, reducing manual setup.
- AWS Service Monitoring: Integrates with various AWS services like EC2, S3, Lambda, and RDS, providing performance metrics and health checks.
- Business Service Monitoring (BSM): Enables monitoring the health of your critical business services that rely on AWS resources.
- Cloud Monitoring Solution: Opsview Cloud is a cloud monitoring solution designed to monitor AWS infrastructure.
- Opspack Plugins: Each AWS component has an Opspack plugin available, acting as a plugin to record different performance metrics.
Why do we recommend it?
Opsview Cloud offers comprehensive monitoring for Amazon Web Services (AWS), integrating seamlessly with services like EC2, S3, and RDS. Its pre-configured Opspacks provide detailed metrics and customizable dashboards, enabling efficient tracking of performance and proactive issue resolution.
For example, the AWS – EC2 CloudWatch Opspack monitors information such as CPU utilization and CPU credit usage. For ELB, you can monitor latency, health host counts, and backed connections errors. Using a range of packs gives you a comprehensive view of performance and availability across your entire AWS stack.
Who is it recommended for?
This solution is ideal for organizations utilizing AWS infrastructure who require unified visibility across their cloud and on-premises environments. IT teams seeking to enhance operational efficiency through automated monitoring and tailored alerting will find Opsview Cloud particularly beneficial.
Pros:
- Scalability: Supports enterprises ranging from 150 hosts to over 50,000, making it suitable for organizations of varying sizes.
- Free On-Premises Version: Free on-premises version of Opsview supports up to 25 hosts for smaller-scale monitoring needs.
- Ease of Use: Known for a user-friendly interface, simplifying AWS monitoring setup and management.
- Auto-Discovery: Saves time and effort compared to manual configuration for each AWS resource.
- Live Demo: Users can schedule a live demo to get a firsthand experience of Opsview Cloud’s features and capabilities.
Cons:
- Limited Native AWS Features: Compared to dedicated AWS monitoring tools, Opsview Cloud might have a slightly smaller range of built-in functionalities for specific AWS services.
- Cost for Larger Deployments: While there is a free on-premises version for smaller deployments, larger organizations may incur costs for the cloud-based Opsview Cloud, which can vary based on the scale of monitoring required.
- Dependency on Internet Connectivity: Since it’s a cloud-based solution, stable internet connectivity is required for data collection and access to monitoring features.
If you’re looking for a cloud-based monitoring tool, Opsview Cloud is an excellent choice for monitoring AWS infrastructure. Opsview Cloud supports enterprises between 150 hosts to over 50,000. There is also a free on-premises version that supports up to 25 hosts. You can schedule a live demo.
6. Dynatrace
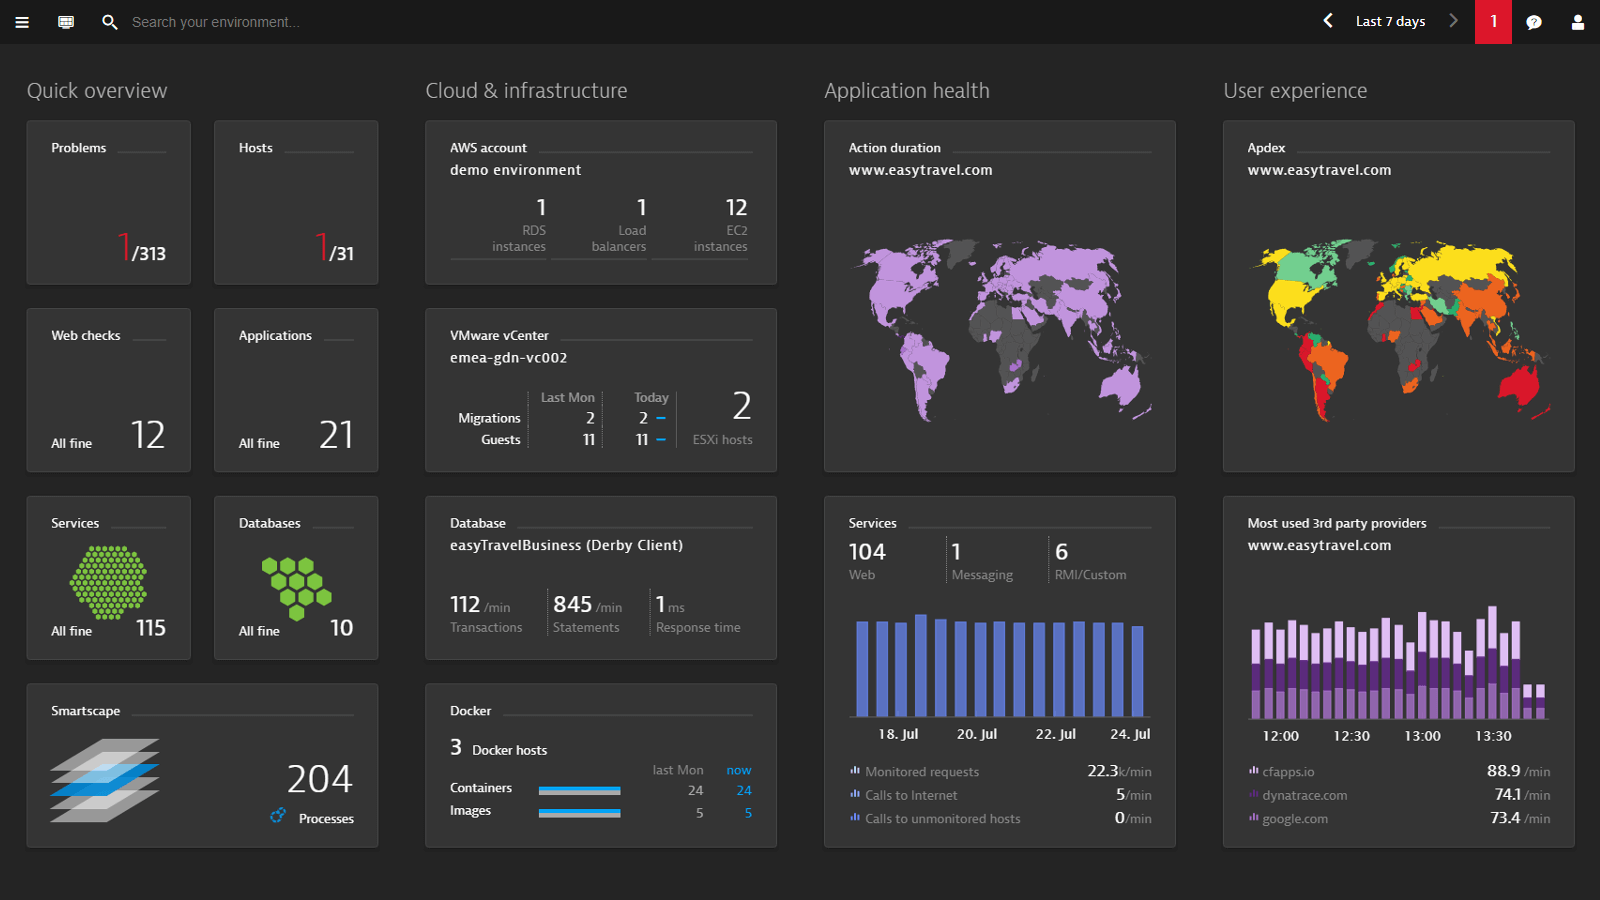
Dynatrace is an application performance monitor with AI-driven AWS monitoring. The platform integrates with data from AWS CloudWatch and can automatically discover EC2 instances. Once the instances have been discovered you can view a rundown of performance data through one pane of glass.
Key Features:
- Deep Visibility: Provides real-time, end-to-end monitoring across your entire AWS stack, including microservices, containers, and infrastructure.
- Auto-Discovery and Configuration: Automatically discovers and configures monitoring for your AWS resources, minimizing manual setup.
- PurePath Distributed Tracing: Analyzes application performance across all tiers within your AWS environment, pinpointing bottlenecks and errors.
- Davis AI Engine: Uses AI to correlate data and identify root causes of performance issues in your AWS resources.
- Smartscape Topology Mapping: Creates a dynamic map of your AWS infrastructure, visualizing dependencies and interactions between components.
- AWS-Specific Integrations: Integrates with various AWS services like EC2, Lambda, and S3, providing pre-built dashboards and metrics.
- Alerting and Automation: Triggers alerts and automates remediation actions based on predefined conditions within your AWS environment.
Why do we recommend it?
Dynatrace provides comprehensive monitoring for Amazon Web Services (AWS), automatically discovering and mapping AWS services such as EC2, S3, and RDS. Its AI-driven analytics deliver real-time insights into performance metrics, enabling proactive issue detection and resolution. The platform’s seamless integration with AWS CloudWatch ensures continuous visibility into your cloud infrastructure.
The software is compatible with Amazon DynamoDB, Amazon EBS, Amazon EC2, Amazon RDS, Amazon S3, AWS CodePipeline, AWS ELB, and AWS Lambda. For EBS monitoring, Dynatrace collects data on throughput, IOPS, disk latency, and idle time. If you’re monitoring RDS instances then you can measure CPU utilization, storage space, throughput, database connections, network read/write latency, and IOPS rate.
See exactly how your cloud infrastructure fits together with the dependency mapping feature, which displays Applications, Services, Processes, Hosts, and Datacenters on an onscreen map. Mapping is very useful because it allows you to put your virtual resources in context when troubleshooting performance issues.
Who is it recommended for?
This solution is ideal for organizations utilizing AWS who require deep observability into their cloud environments. IT teams seeking to leverage AI-powered monitoring for efficient resource management and rapid problem-solving will find Dynatrace particularly beneficial.
Pros:
- AI-Powered Insights: Leverages AI to proactively identify and diagnose performance problems, saving time and effort.
- Root Cause Analysis: Helps pinpoint the exact root cause of performance issues within your AWS environment.
- On-Premise or SaaS Deployment: Available as both an on-premise and SaaS-based platform to suit different deployment preferences.
- Deployment Flexibility: Users can choose between on-premise and SaaS deployment options based on their preferences and requirements.
- Free Trial: The availability of a free trial allows users to test the platform’s features and capabilities before committing to a purchase.
Cons:
- Pricing Information: The lack of publicly-available pricing information requires users to contact the company directly, which may be inconvenient for some organizations.
- Learning Curve: Like many advanced monitoring tools, Dynatrace may have a learning curve for new users to fully leverage its AI-driven capabilities and customization options.
- Dependency on Internet Connectivity: For SaaS-based deployment, stable internet connectivity is necessary for data collection and access to monitoring features.
Dynatrace is a natural choice for enterprises that want an AI-led AWS and application monitoring experience. The solution is available as an on-premise or SaaS-based platform. Contact the company directly for pricing information. You can start the 15-day free trial.
7. AppDynamics
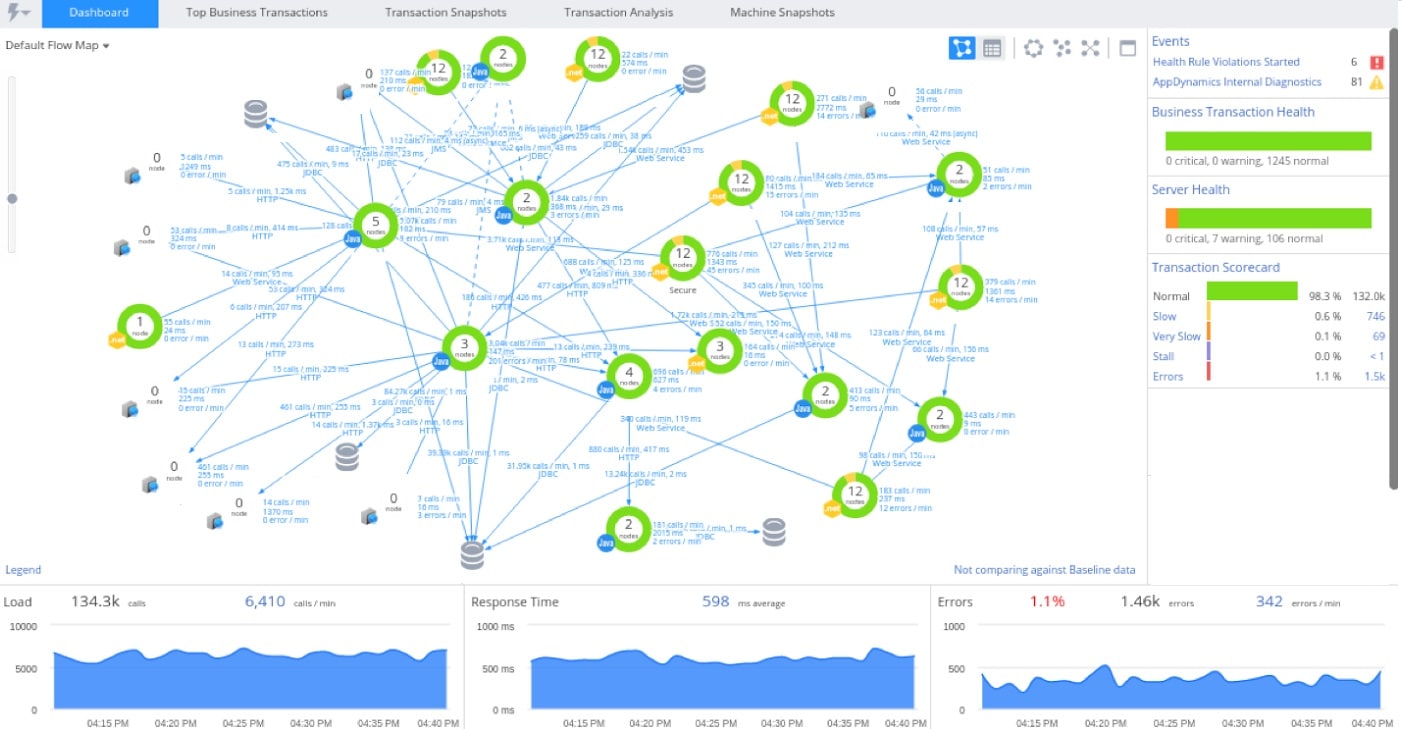
AppDynamics is an application performance management solution that can monitor Amazon ECS, Amazon EC2, Amazon EKS, AWS Fargate, and AWS Lambda. With AppDynamics, the user can automatically discover cloud services to monitor the performance down to the code level. After discovering the services you can view them on an application dependency map.
Key Features:
- Code-Level Analysis: Drills down to the code level to identify performance bottlenecks within your AWS applications.
- Real-Time Business Transaction Monitoring: Tracks user experience and performance of business transactions running on AWS.
- Automatic Discovery and Configuration: Discovers and configures monitoring for your AWS resources automatically, reducing manual setup.
- AWS-Specific Extensions: Offers a variety of extensions for specific AWS services like Auto Scaling, S3, and CloudWatch, providing deeper insights.
- Auto-Correlation: Utilizes AI-powered technology to correlate data from various AWS components to pinpoint root causes of performance issues.
- Application Performance Management: AppDynamics is an application performance management solution that monitors various AWS services including Amazon ECS, EC2, EKS, Fargate, and Lambda.
Why do we recommend it?
AppDynamics offers comprehensive monitoring for Amazon Web Services (AWS), supporting native AWS technologies such as EC2, RDS, SQS, S3, and DynamoDB. Its integration with AWS CloudWatch allows for real-time performance metrics, enabling proactive issue detection and resolution. The platform’s automatic discovery and visualization of application topologies facilitate seamless monitoring across hybrid environments.
To diagnose performance issues the software uses performance baselining. The tool creates dynamic baselines of key performance metrics, and uses anomaly detection to identify abnormal performance. Then you can use the AI-powered root cause analysis to find out what caused the problem.
AppDynamics offers a high-quality AWS monitoring experience that will meet the needs of most large organizations. There are three App Performance Monitoring Packages available to purchase: APM Pro, APM Advanced, and APM Peak.
Who is it recommended for?
This solution is ideal for organizations utilizing AWS who require deep visibility into their cloud-native applications. IT teams seeking to monitor complex, distributed systems will benefit from AppDynamics’ ability to correlate application performance with business outcomes, ensuring optimal user experiences.
Pros:
- Deep Application Insights: Offers exceptional depth in monitoring application performance within your AWS environment, including code-level analysis.
- Real-Time User Experience Monitoring: Helps understand how performance issues impact users interacting with your AWS applications.
- Automatic Monitoring: Reduces manual configuration effort for monitoring AWS resources.
- AWS Integration: Provides extensions and functionalities specifically designed for monitoring AWS services..
- Free Trial: Users can start a 15-day free trial to evaluate the platform’s capabilities before purchasing.
Cons:
- Pricing Information: The lack of publicly available pricing information requires users to request a quote directly from the company, which may be inconvenient for some organizations.
- Complexity: Setting up and utilizing all of AppDynamics’ features can have a steeper learning curve.
- Limited Free Tier: The free tier of AppDynamics might have limited functionalities for AWS monitoring.
APM Pro offers monitoring for application business transactions. APM Advanced monitors network and server performance. APM Peak includes business performance monitoring with transaction analytics. You can request a quote from the company directly. Start the 15-day free trial.
8. Logic Monitor

LogicMonitor is an infrastructure monitoring tool for enterprises that can monitor AWS and AWS CloudWatch metrics out-of-the-box. There is performance and availability monitoring for Amazon EC2, Amazon EKS, Amazon ECS, Amazon RDS, Amazon DynamoDB, Amazon ElastiCache, Amazon ELB, and more.
Key Features:
- Centralized Monitoring: Monitors your entire IT infrastructure, including AWS resources, from a single platform.
- Auto-Discovery and Configuration: Automatically discovers and configures monitoring for your AWS resources, reducing manual setup.
- Pre-Built AWS Content Packs: Offers pre-configured templates and dashboards specifically designed for monitoring AWS services like EC2, S3, and Lambda.
- Customizable Monitoring: Allows you to create custom dashboards and alerts tailored to your specific needs within your AWS environment.
- Alerting and Escalation: Triggers alerts and escalates notifications based on predefined thresholds for AWS metrics.
- API Monitoring: Monitors the health and performance of APIs running on your AWS infrastructure.
- Root Cause Analysis Tools: Provides tools to help identify the root cause of performance issues within your AWS environment.
- Alerts System: LogicMonitor features an alerts system that can be configured to notify users via email, SMS, and voice messages when an AWS service experiences downtime.
Why do we recommend it?
LogicMonitor provides comprehensive monitoring for Amazon Web Services (AWS), offering real-time visibility into critical services such as EC2, S3, and RDS. Its agentless architecture simplifies deployment, while pre-configured dashboards and automated discovery streamline the monitoring process. Additionally, LogicMonitor’s AI-driven analytics facilitate proactive issue detection and performance optimization.
An auto-discovery feature automatically detects AWS infrastructure in your environment. From then onwards you can keep track of performance events and AWS data through the dashboard. For EC2, you can monitor CPU utilization, disk read metrics, disk write metrics, network in, network out, and more.
For fast resolution, LogicMonitor has an alerts system. You can configure alerts to be sent out by email, SMS, and voice messages if an AWS service is down. You can also set escalation chains so that if the first point of contact is unavailable then the alert will be rerouted to another individual.
Who is it recommended for?
This solution is ideal for organizations utilizing AWS who seek a unified platform to monitor both cloud-based and on-premises infrastructure. IT teams aiming to enhance operational efficiency through automated monitoring, customizable alerts, and detailed reporting will find LogicMonitor particularly beneficial.
Pros:
- Unified Monitoring: Manages both on-premise and AWS resources from a single platform, simplifying monitoring workflows.
- Ease of Use: Known for a relatively user-friendly interface compared to some feature-rich monitoring tools.
- Pre-Built AWS Content: Saves time by providing pre-configured templates and dashboards for common AWS services.
- Customization: Offers flexibility in creating dashboards and alerts tailored to your AWS monitoring needs.
- Free Trial: Users can start a 14-day free trial to evaluate the platform’s capabilities before committing to a purchase.
Cons:
- Device Limitation Pricing: The pricing structure based on device limits may require users to choose a package that aligns with their monitoring needs, which can lead to potential cost considerations.
- Learning Curve: Like most monitoring tools, LogicMonitor may have a learning curve for new users to fully utilize its features and customization options.
- Potential for Alert Fatigue: With extensive customization options, there’s a risk of creating too many alerts, leading to alert fatigue.
LogicMonitor is a tool that works best in hybrid environments where the user wants to monitor cloud services and physical devices with one unified solution. Standard Pricing packages start at 50, 100, or 200 devices. You can start the 14-day free trial.
Choosing an AWS Monitoring Tool
While you can use CloudWatch to monitor AWS, the visibility and depth of features offered by network monitoring agents are a must-have. When so many platform Amazon Web Services Monitoring tools allow you to integrate external CloudWatch data it makes sense to take advantage and use a third-party tool for improved visibility.
All of the products on this list are formidable AWS monitoring tools. SolarWinds Server & Application Monitor, Paessler PRTG Network Monitor, and ManageEngine Applications Manager stand out as some of the more accessible tools. If you want more advanced capabilities then it is worth looking at Dynatrace and AppDynamics (particularly for dependency mapping).