
Application Performance Management (APM) tools help your organization track, troubleshoot, and improve the performance of software applications.
These tools track resource usage, peak hours, and can help you improve the user experience for your external or internal facing software applications.
Here is our list of the best Application Performance Management tools:
- Progress WhatsUp Gold EDITOR’S CHOICE Proactively monitors the performance of your applications to comply with SLAs. It also sends alerts to help identify the root cause. Get a 30-day free trial.
- ManageEngine Application Manager (FREE TRIAL) Supports over 100 different applications. Start a 30-day free trial.
- Site24x7 Application Performance Monitor (FREE TRIAL) An APM that is able to trace all of the underlying processes that contribute to any application. Start a 30-day free trial.
- AppDynamics Power enterprise-level APM tool that leverages machine learning.
- Azure Monitor Robust and secure tool backed by Microsoft.
- SolarWinds Server & Application Monitor Great for medium to larger sized MSPs and enterprises. Combines concise reporting with intelligent anomaly detection.
- Foglight Allows for past solutions to performance problems to be archived and rerun.
- AppEnsure Easily segments traffic and utilization by a specific application.
Our methodology for selecting the best application performance management tool:
We’ve broken down our analysis for you based on these key criteria:
- Ease of Integration: Prioritizes tools that seamlessly integrate with existing systems and applications.
- Comprehensive Monitoring Capabilities: Focuses on tools offering extensive monitoring of applications’ performance and resources.
- User Experience Enhancement: Values tools that contribute to improving end-user experience.
- Customizability and Flexibility: Considers the ability to tailor the tool to specific organizational needs.
- Alerting and Reporting Features: Emphasizes the importance of effective alerting mechanisms and detailed reporting for proactive management.
The Best Application Performance Management Tools
1. Progress WhatsUp Gold (FREE TRIAL)

Progress WhatsUp Gold comes with out-of-the-box monitoring profiles for popular and critical apps that you can implement with minimal customization. Alternatively, you can also create profiles from scratch if that suits you better. Along with the real-time monitoring of your apps’ performance, WhatsUp Gold also sends instant alerts, so your team can fix issues before they impact the wider infrastructure.
Key Features:
- Monitors commercial and in-house applications.
- Allows you to create multi-step action policies that get triggered automatically when specific events occur.
- Comes with customizable dashboards to provide pertinent information for every user.
- Maintains a log of all changes that have happened in every application.
Why do we recommend it?
Progress WhatsUp Gold is highly recommended for its comprehensive features that cover every kind of application on any infrastructure. Whether you want to use the built-in templates or create one from scratch, WhatsUp Gold makes it easy for you to set up monitoring profiles for each commercial and custom application on your infrastructure.
Moreover, you can set the thresholds for every application’s performance, and when any metric exceeds the threshold, WhatsUp Gold sends instant alerts to your team. This enables your team to stay on top of issues and troubleshoot them quickly. Its customizable dashboards and network maps also provide the required context for troubleshooting.
Lastly, you can set up multi-step action policies that can be automatically triggered when a certain event happens. Such a process ensures that the first-level response happens automatically, giving your team considerable time to explore the root cause and fix the problem.
Who is it recommended for?
This tool is well-suited for MSPs and IT teams working in mid to large enterprises. It also works well for companies that have a wide range of applications.
Pros:
- Its scalable design supports customization and business expansion.
- Instant alerts provide complete control over emerging issues.
- Self-healing actions through automated scripts save time and effort.
- Customizable dashboards provide the required information for every user.
- Provides historical status reports to drill down and analyze application performance over time.
Cons:
- Initial setup and configuration can be complex.
Start a 30-day free trial.
EDITOR'S CHOICE
WhatsUp Gold is the Editor’s Choice for the best application performance management tools because it offers end-to-end control and visibility into commercial and in-house applications. A highlight of this tool is its self-healing actions, which can consist of multiple steps. These actions respond instantly to a problem or situation, while sending an alert to your team, and providing the context for them to address the root cause. Its well-designed dashboards and reports support internal and external compliance. Due to these features, WhatsUp Gold is highly recommended by our team.
Download: Get a 30-day FREE Trial
Official Site: https://www.whatsupgold.com/application-performance-monitoring
OS: Windows Server 2012 or later
2. ManageEngine Application Manager (FREE TRIAL)
If you’re looking for board performance monitoring across a diverse number of databases and servers, the ManageEngine Application Manager might be for you. Supporting over 100 applications and database servers, Application Manager covers a considerable amount of platforms and apps to make monitoring your environment from a single point simple and convenient.
Key Features:
- Supports 100+ applications
- Scalable up to 50,000 apps
- Built-in Apdex scoring
- Simple setup and deployment
Why do we recommend it?
ManageEngine Application Manager is recommended for its vast support of over 100 applications and scalability, making it a versatile choice for diverse IT environments.
With the ability to monitor up to 50,000 applications, there’s plenty of room to grow and expand your network of servers and services. Application Manager does scalability right, by providing features and services that serve both smaller businesses as well as enterprise environments.
Application Manager allows you to drill down to the specific threads to get a transactional view of the request that is slow or causing a negative impact on your network. The summaries are broken up by an overview with easy to digest graphs that make taking corrective action easy. Once a problem has been identified and fixed you can track and measure user satisfaction through a built-in Apdex scoring report.
Setup and deployment of Application Manager is easy and comes with out-of-the-box monitoring solutions for many of the most common platforms, including cloud containers such as OpenStack, AWS, and Azure. If you maintain an ERP system you’ll be able to monitor that as well as any other middleware or messaging applications that sit between it, making ManageEngine Application Manager as powerful internally as it is externally.
Who is it recommended for?
This tool is ideal for businesses looking for broad performance monitoring across a diverse array of databases and servers. Its ability to handle large-scale monitoring makes it suitable for both small and larger enterprises.
Pros:
- Supports a wide range of applications and database servers.
- Scalable to monitor up to 50,000 applications.
- Includes out-of-the-box monitoring solutions for common platforms.
Cons:
- Pricing is not transparently listed, requiring potential users to seek further information.
Pricing for ManageEngine Application Manager isn’t listed on their site but is estimated at around $945.00 per user, per year. For the most accurate and up to date information you can download a free 30-day trial.
3. Site24x7 Application Performance Monitor (FREE TRIAL)

Site24x7 Application Performance Monitor (Site24x7 APM) is one of the system administration services offered by the cloud-based platform, Site24x7. This tool specializes in digging into the code dependencies of applications built on SDKs such as .NET, Java, Ruby, Node.js, and PHP.
Key Features:
- Detailed process tracing
- Supports multiple SDKs
- Alerting process
- Mobile device analysis
Why do we recommend it?
Site24x7 APM is recommended for its detailed process tracing capabilities and support for multiple software development kits, making it effective for end-to-end application visibility and performance management.
The service is able to identify all of the processes spawned by each application and track their performance individually, building up a picture of a critical path of execution for each module. This real-time analysis makes the task of identifying problems with performance easier to achieve. A problem might occur because of coding errors, resource locks, or the failure of programs to release resources or fully shut down.
This process tracer is a great feature for end-to-end visibility of applications. You probably don’t know all of the levels of services that each application runs on, especially if it calls processes that are resident on other servers. This gives you end-to-end performance metrics, which spot why response times are slow on an application.
The tracing capabilities extend to software launched from any location, including cloud servers. The APM can even analyze applications launched from mobile devices and follow the processing of each as it is offloaded onto microprocesses running on many different servers.
The visibility of execution extends down to the operating system level of servers. The APM can detect when necessary resources are running low and warn administrators before applications grind to a halt.
One of the key features of the Site24x7 APM is its alerting process. This sets acceptable performance thresholds and levels of safety of resource capacity. Once a threshold is crossed, the monitor generates an alert, which is displayed in the system console and also forwarded on by SMS or email. This enables administrators to get on with other tasks, knowing that they only have to pay attention to the APM when notified of evolving problems.
Who is it recommended for?
This tool is well-suited for IT administrators needing in-depth analysis of application dependencies and performance across various platforms, including mobile devices.
Pros:
- Offers comprehensive process tracing for end-to-end visibility.
- Supports a wide range of SDKs for diverse application monitoring.
- Effective alerting system for proactive issue resolution.
Cons:
- The complexity of features might require a learning curve for new users.
Site24x7 is a subscription package and the APM has a complicated menu of services. The base package costs $35 per month when paid annually and then you can add on extras to create a tailored package. Site24x7 offers a free trial of the Application Performance Monitor.
4. AppDynamics

AppDynamics is a household name among most sysadmins, and for good reason. This Cisco-owned tool gives you detailed advanced application performance management functions that are built with scale in mind. If you’re looking to track dozens of cloud-cloud based services, servers, and API calls, this APM might be what you’re looking for.
Key Features:
- Advanced APM functions
- Machine learning for baseline
- Deep Code Insights
- User access control
Why do we recommend it?
AppDynamics is recommended for its advanced application performance management capabilities and use of machine learning to establish performance baselines, ideal for tracking a wide array of cloud-based services and servers.
At its core, the application dashboard brings up a topological view of your infrastructure and highlights realtime statistics with color-coded graphs to give you a clean 30,000-foot view of your assets. Part of that reporting uses machine learning to create baselines based on past performance. At a glance, you’ll be able to see not only real-time statistics but if your performance is above or below historic recordings.
Your baseline performance is tracked by a feature called the Cognition Engine, which can also use that performance data to detect anomalies that proactively alert staff to issues to resolve problems before they can cause downtime or negative user experience. Once a problem arises, technicians can use a number of tools to help identify and fix the problem quickly. Deep Code Insights allow you to view and edit code in a production environment without impacting overall performance.
AppDynamics calls these non-intrusive insights ‘Watchpoints’, which passively collect data and report issues live. This eliminates the need for spinning up a test environment and trying to replicate the issue yourself, all while keeping the service live and functioning.
On the user end, AppDynamics has a robust management side that gives you the control to assign specific assets and zones to certain users. This becomes more important as you scale and is a critical feature when planning how to manage your environment while mitigating risk.
Who is it recommended for?
It’s particularly suitable for sysadmins in large-scale environments who require detailed application performance insights and real-time data analysis to manage complex networks.
Pros:
- Features Deep Code Insights for real-time code editing in production.
- Provides a user-friendly application dashboard with real-time statistics.
- Enables efficient anomaly detection and resolution with Cognition Engine.
Cons:
- The comprehensive features may be overwhelming for smaller setups.
AppDynamics is available as both a SaaS and on-premise solution. You can test out a 15-day SaaS trial for free to see if it’s the right fit for your business.
5. Azure Monitor

Powered by Microsoft, Azure Monitor tests, tracks, and reports the performance and usage of your web applications and physical infrastructure either on-premises or as a service. With a ‘pay-as-you-go’ model Azure Monitor is a scalable and attractive performance management tool for any sized business.
Key Features:
- Powered by Microsoft
- Pay-as-you-go model
- Hypothetical scenario testing
- Extensive data integration
Why do we recommend it?
Azure Monitor is recommended for its scalability and the unique ability to run hypothetical scenarios, making it a versatile tool for businesses of any size, especially those utilizing Microsoft environments.
A feature I enjoyed was the ability to easily run hypothetical scenarios through your environment. Azure Monitor uses machine learning constructs to help predict how your environment will react under certain loads, and give you a clear idea on how you can prepare for large traffic volumes and structure performance upgrades.
The UI component is sleek and simple, giving you quick access to your Top lists and aggregate charts for both real-time and historical data analysis. Metrics for both web applications and server hardware are easy to visualize and structure a plan around.
Under the Intelligence tab, you can access your data’s live telemetry through a node-based map. Integrations with tools such as DevOps, PagerDuty, and Jira keep your monitor options open if you already have a favorite visualization tool.
From a security perspective, Azure Monitor boasts investing over 1 billion dollars annually into their own cybersecurity research and employs more than 3500 network security experts who maintain and continuously secure your data and privacy.
Who is it recommended for?
This tool is ideal for organizations seeking a scalable solution to monitor both web applications and physical infrastructure, with a focus on data security and extensive integration capabilities.
Pricing varies based on your data usage but starts at $2.76 (£2.21) per GB. You can get started for free.
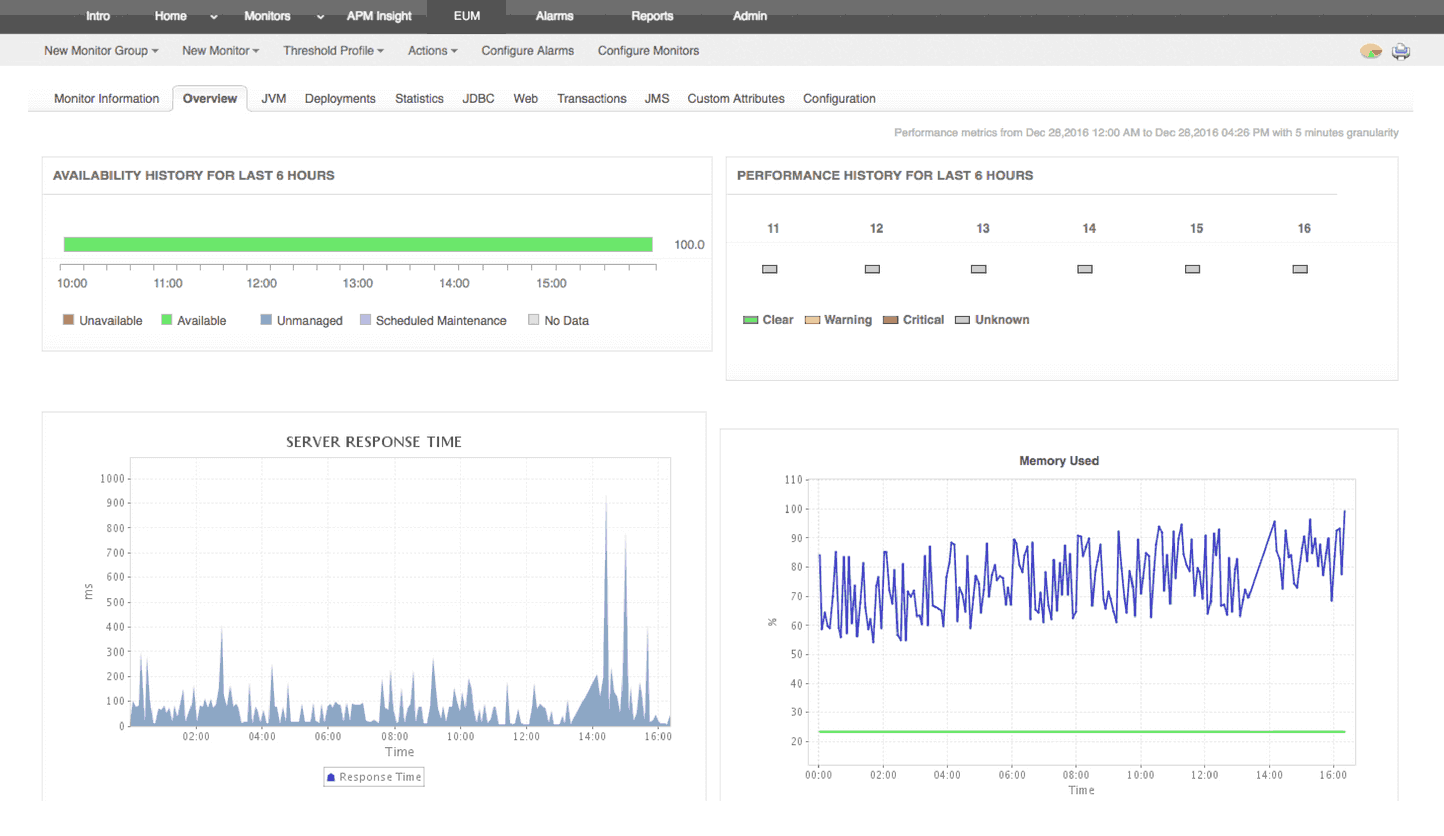
6. SolarWinds Server & Application Monitor
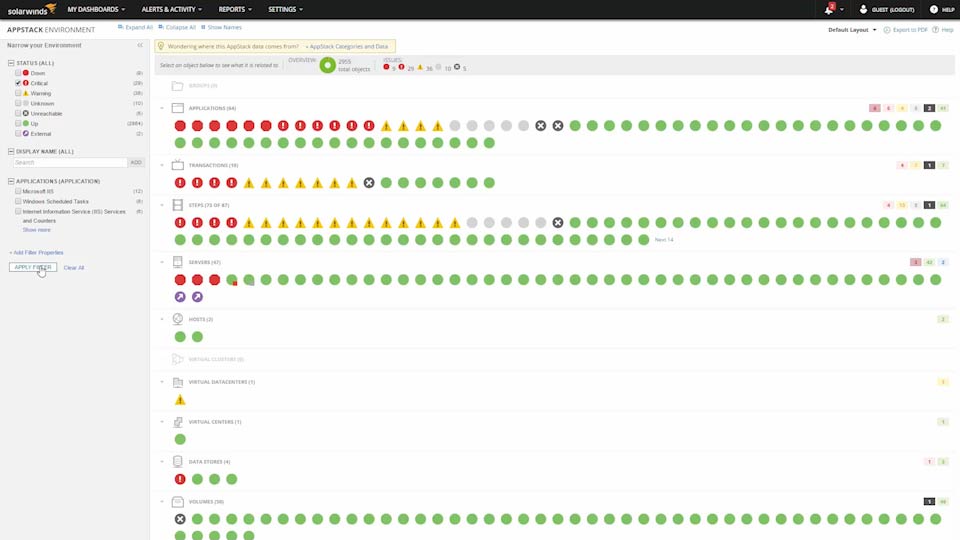
SolarWinds Server & Application Monitor (SAM) is a scalable and feature-filled application monitor that pulls essential information from your applications and brings that data to life through maps and reporting. SAM is designed to specifically help medium to large-sized companies track their system usage and help solve problems before their customers are impacted.
Key Features:
- Scalable for MSPs, enterprises
- Over 1200 pre-built templates
- Drag-and-drop customizable dashboards
- Condition-based alerting
Why do we recommend it?
SolarWinds Server & Application Monitor is recommended for its scalability and comprehensive monitoring capabilities. It’s particularly effective in medium to large-sized enterprises, offering over 1200 pre-built templates and intuitive dashboards for efficient performance management.
SAM helps you get to the root of problems quickly, and determine where slowdowns and problems are occurring. SAM takes the guesswork out of hunting down slowness and performance troubles. The data you capture will immediately tell you if you’re looking at an application problem, network congestion, or failing hardware.
Even in complex environments, SAM crawls entire networks to discover physical and virtual servers, software applications, and storage systems. A personal favorite feature of SAM is its pre-built templates and dashboard overviews.
Without scripting or heavy configuration, SAM can practically be run out of the box and start pulling relevant statistics like uptime, response time, and resource utilization. SAM currently comes with over 1200 templates for some of the most widely used servers and applications that you can put to work right away.
A major challenge with most application performance management tools is their ability to flexibly display custom data. During testing, SAM did an excellent job in this regard and even allows for drag and drop customizable dashboards without any scripting or lengthy customization process. SAM can also display your entire network topology and show real-time data, making it easy to visualize chokepoints and plan upgrades around your current infrastructure.
Lastly, SAM utilizes condition-based alerting to make sure you and your team are always in the loop. You can set triggers, variables, and dependencies with enough granularity that you’re not overwhelming you, or your staff with false or redundant alerts.
Who is it recommended for?
This tool is ideal for medium to larger-sized MSPs and enterprises looking for a robust application performance management solution. Its extensive template library and customizable dashboards make it suitable for complex network environments.
Pros:
- Scalable design suitable for medium to large enterprises.
- Provides over 1200 pre-built monitoring templates.
- Features drag-and-drop customizable dashboards for easy use.
- Offers condition-based alerting to avoid redundant alerts.
- Enables quick identification of network congestion and failing hardware.
- Effective in complex environments, mapping both physical and virtual resources.
Cons:
- Might be overwhelming for small businesses due to its extensive features.
7. Quest Foglight

Quest Foglight helps you proactively detect and resolve performance issues before they impact your bottom line. You’ll have access to a full suite of troubleshooting tools and integrations with tools such as Microsoft Azure, NoSQL, Oracle, and SAP database environments.
Key Features:
- Database monitoring
- Automated change tracking
- Solution search for past issues
- Extensive troubleshooting tools
Why do we recommend it?
Quest Foglight is recommended for its robust database monitoring capabilities and automated change tracking, making it an excellent choice for SQL server monitoring and historical issue resolution.
While you’ll find many of the standard features most APM tools provide, I felt a bit overwhelmed with the interface when compared to the clean menus and data visualization from solutions like SolarWinds Server & Application Manager. With that aside, Foglight does provide deep insights into stats such as uptime, CPU utilization, memory load, and overall traffic.
If your main concern is monitoring SQL servers, Foglight does provide quality database monitoring and analysis. Features like adaptive baselines and automated change tracking help you measure and compare the changes you make on the back end, to the increased performance and usability on the front end.
A unique feature that Foglight offers is the ability to search for past solutions that have been implemented before. This is done under the Alarm section and is particularly useful if you’re running a small team with limited documentation, or just need to know what was done to resolve an issue in the past without relying on notes.
Who is it recommended for?
This tool is particularly beneficial for IT professionals who prioritize database monitoring and need a solution with the capability to search for and implement past successful solutions.
Pros:
- Strong focus on quality database monitoring and analysis.
- Offers features like adaptive baselines for performance comparison.
- Unique feature to search for past implemented solutions.
Cons:
- The interface can be overwhelming compared to more streamlined solutions.
You can test out all of Foglight’s features for free on a 30-day trial.
8. AppEnsure
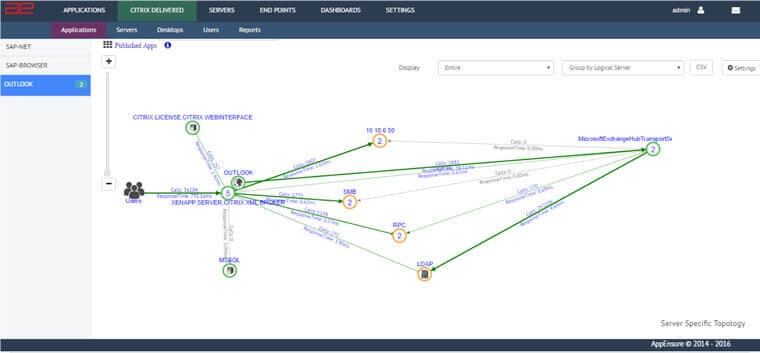
AppEnsure is capable of monitoring numerous physical, virtual, and cloud-hosted environments. Automatic Application Discovery pulls all running applications across a given network and builds a dashboard presenting real-time information that can be quickly sorted through, rearranged, or customized to your liking.
Key Features:
- Monitors physical, virtual environments
- Dynamic topology mapping
- Root cause analysis
- Customizable dashboard
Why do we recommend it?
AppEnsure is recommended for its versatility in monitoring various environments, including physical, virtual, and cloud-hosted, and its effective root cause analysis capabilities.
The dynamic topology mapping gives you a clear picture of where your data is going and how it’s being processed. Under the Remote Applications tab, you can toggle between numerous apps to see exactly how each one is performing on its own. This makes it simple to isolate slow hosts who might only be having trouble with specific programs.
Root cause analysis dissects events on a hop-by-hop basis and compares them to historical averages to understand the difference between normalities and anomalies. When a segment has impacted the application performance an alert is triggered with a suggested course of action and description of the event.
Who is it recommended for?
This tool is ideal for IT administrators who manage diverse network environments and need a tool that provides clear, actionable insights into application performance issues.
Pros:
- Effective root cause analysis for precise problem identification.
- Customizable dashboard enhances user experience.
- Automatic Application Discovery feature for easy setup.
Cons:
- May not offer the depth of features found in more specialized tools.
If you’re looking to test out AppEnsure yourself, you can start by downloading a free trial.
Choosing an Application performance management tool.
When your co-workers and customers rely on the servers you maintain, uptime and efficiency are paramount to your organization. Depending on your size and needs, the type of application performance management tool will change.
For medium to larger sized MSPs and enterprises, SolarWinds Server & Application Monitor strikes the perfect balance between out-of-the-box usability and custom scripting, reporting, and flexible integrations. All of the key insights are nicely wrapped and presented in an intuitive interface that gives sysadmins just the right amount of information at a glance.
For smaller organizations looking to monitor a few servers, applications, or cloud solutions, AppOptics is an affordable streamlined solution that gives you actionable performance management reports, with room to expand later.
Does your organization rely on application performance tools? Have they helped save you from downtime or a disaster? Share your stories with us in the comments below.


